
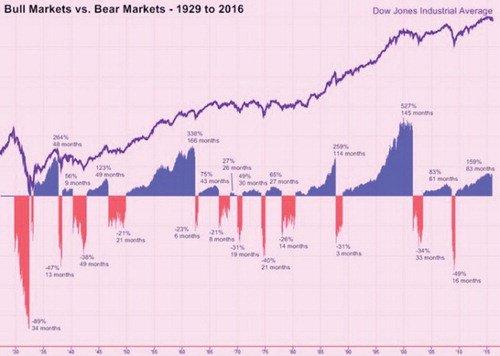
The theme of this first collection to appear in Quantitative Finance Letters is ‘Bubbles, Crashes, Their Prediction, Exit and Prevention Strategies'. Financial bubbles, corrections and crashes are strikingly common. In the USA, the S&P500 has experienced 23 corrections, defined as a decline of at least 10% over less than a year, since the mid 1960s. Figure shows the cycles of bull and bear markets on the Dow Jones Industrial Average from 1929 to 2016. In China, the Shanghai Composite Index had 24 corrections since it opened 25 years ago. Predicting bubbles and crashes early, and being able to avoid them, has a very significant impact on the long-term performance of investment managers.
Figure 1. Bull and bear markets on the Dow Jones Industrial Average (1929–2016, source: Yahoo!).
The articles in this collection follow four broad themes:
bubbles;
crash detection;
exit and prevention strategies;
non-predictable market declines.
1. Bubbles
A first concern for many investor is to be able to clearly identify when a bubble is forming. Bubbles exist when prices are rising just because people think prices will continue to rise. Prices are higher than the fundamentals justify. In ‘Testing for Asset Price Bubbles: Three New Approaches', Robert Jarrow discusses three approaches to test for the existence of and asset price bubble. The first is local martingale model due to Jarrow, Protter, Shimbo and Kchia. The second is based on put and call prices and makes use of the fact that no-arbitrage valuation applies to puts even in a bubble whereas call prices will reflect the impact of the bubble. The third methodology, the return multi-factor model, decomposes asset returns in two components: the return due to the fundamental value and the return due to the bubble. The second and third methods are new and original, and they have not been explored in the literature. All three methods avoid the pitfall common to traditional bubble tests: the requirement to test the underlying asset pricing models jointly with the existence of a bubble. In all three methods, the validity of the underlying model can be established first, before testing the existence of an asset price bubble.
Philip Protter follows with ‘Mathematical Models of Bubbles', in which he presents an overview of the latest mathematical results related to local martingale-based bubble detection models. He starts by providing an overview of the mathematical modelling of financial bubbles before discussing recent results on the (local or full) martingale properties of stochastic volatility models and their implication for bubble detection models. Next, he proposes a bubble model based on a jump process, before concluding with recent research on how bubbles form.
Bubbles and crashes occur across all asset classes, from stocks to commodities, real estate, bonds and even tulips. In ‘Credit Market Bubble Building? A Forming Credit Bubble Could Burst by 2017', Edward Altman and Brenda Kuehne present evidences that a bubble has been inflating on the credit market. They start by comparing the current benign credit cycle to other benign cycles between 1971 and 2015. Then, they analyse the pattern of new issuance (volume, credit quality) before turning their attention to LBO financing. Finally, they use Altman's Z and Z″ score to compare the level of corporate risk in 2014 and 2012 with that observed at the start of the last credit crisis in 2007. Altman developed the Z score in 1968 to predict the probability that a firm will go into bankruptcy within two years based on five financial ratios: Working Capital/Total Assets, Retained Earnings/Total Assets, Earnings Before Interest and Taxes/Total Assets, Market Value of Equity/Book Value of Total Liabilities,Sales/Total Assets. Altman applied a discriminate analysis to a sample of 66 firms, half of which had filed for bankruptcy.
2. Crash detection
As an alternative to identifying a bubble, one can attempt to predict the ensuing crash. Sébastien Lleo and William Ziemba discuss the bond-stock earnings yield differential model (BSEYD) in a two-part paper. They give a historical account of its use from the genesis of the model when William Ziemba devised it in Japan in 1988 through 2016. The model has been successful at predicting crashes in many countries including the USA, Canada, Japan, Germany, the UK, Iceland and China. The model predicted the Iceland, China and US 2007–2009 crashes. We also compare the accuracy of the BSEYD with Shiller's high PE ratio on the US market from 1962 to 2012. Although both models are statistically significant, the BSEYD is generally more accurate. Finally, we discuss three other crash measures: Ziemba's T-measure, Buffett's value of the stock market to value of the economy and Sotheby's stock price measure.
3. Exit and prevention strategies
John Swetye and William Ziemba describe the approaches of the famous investor Marty Zweig in making buy/sell or entry/exit decisions in financial markets using Fed information. The paper is based on books by Zweig (1986, 1987). The methods were used with great success from 1971 to 2013. In contrast to the approach of Zhitlukhin and Ziemba (2015) which bases exit and entry decisions only on prices, Zweig's models use many variables: prime rate, discount rate, reserve requirement, installment debt, the Value Line Index, and ratio of advancing stock volume to declining stock volume. Cumulative scores from the variables are tracked using two models: the Monetary and Momentum models. Decisions are based on thresholds for the cumulative scores combined into a ‘Super Model’. The Zweig approach is discussed for recent stock market movements.
In ‘A Simple Procedure to Incorporate Predictive Models in a Continuous Time Asset Allocation', Mark Davis and Sébastien Lleo consider the incorporation of expert opinion and analyst views into a continuous time portfolio optimization problem. The observable asset price premiums and views are modelled as Brownian motion processes with the drift an affine process depending on unobservable factors. It is assumed that the views have an implied Gaussian format, characterized by a mean and variance. The econometrics (regression model) underlying many expert views supports this approach. The consistent stochastic differential equation framework facilitates: (i) the estimation of the factor process parameters using Kalman filtering; (ii) the solution of the stochastic control problem using the Ricatti equation.
Mikhail Zhitlukhin and William Ziemba consider the problem of when to exit the stock market based on the sequence of observed prices at discrete time to current time. The change in prices is assumed to be lognormal. The exit time only depends on the prices and the investor preference as given by a negative power utility over a defined horizon. The exit time or stopping time is based on a decision that the market dynamics (mean, variance) are likely to change. A time-dependent threshold for a Shiryaev–Roberts statistic (calculated from estimated model price distribution parameters, alternative model parameter specifications, and a negative power utility) is determined and the exit time is the first passage time to the threshold. The methodology is applied to various stock market crashes to demonstrate the effectiveness of the exit time/threshold approach. The selected parameter specifications required to calculate the threshold are experimental, but the consistency of effective settings across examples indicates general applicability. Examples include Apple computer stock in 2012, the Nasdaq 100 in 2000, the Nikkei stock index and golf course memberships around 1990, and US stock market crashes in 1929 and 1987.
4. Non-predictable market declines
To conclude this themed collection, William Ziemba discusses non-predictable stock market declines. The major stock market crashes discussed in the literature (see Zhitlukhin and Ziemba) are predictable either from price movements or market indicators such as the BSEYD. There are numerous smaller market declines of 5–15% which are not predicted by traditional methods. Some of these market declines are discussed in this paper. Although these markets are not ‘bubbles’, the use of investment strategies which weather volatile markets is clearly important. Professor Ziemba describes his approaches to navigating the choppy waters of financial markets that he uses in his own futures and futures-options trading stock indices.
We are grateful to these authors for their insightful contribution to the themed collection.
1 February 2016