
ABSTRACT
Characterisations of ancient sheep breeds and wool types and theories about wool fibre processing are integral parts of textile archaeology. The studies build on statistical calculations of measurements of wool fibre diameters and reveal characteristics of the yarns that are attributed to the available raw wool and to the production methods of the time. Different microscope types have been used for data collection. Presently digital images from either scanning electron microscopy (SEM) or transmitted light microscopy (TLM) are the preferred methods. The advantage of SEM is the good depth of field at high magnification, while TLM is simpler to use and more readily available. Several classification systems have been developed to facilitate the interpretation of the results. In this article, the comparability of the results from these two methods and from the use of different magnifications in general is examined based on the analyses of a large number of the Danish prehistoric textiles. The results do not indicate superiority of one microscope type in favour of another. Rather, they reveal differences in the calculations that can be ascribed to the diversity of the fibres in the individual yarns as well as to the methodology and the magnification level.
Introduction
Recent debate in archaeology has focused on the reliability of scientific methods in archaeological research (most recently, Sørensen Citation2017) and how they influence our interpretations of the past. Textile archaeology utilises a wide gamut of scientific analytical techniques, one of which is wool fibre analysis. The range of the fibre diameters in a yarn affects the appearance of the finished textile, so its understanding is essential for elucidating the development of ancient textile production. Sheep wool has been a major textile material in Scandinavia and Europe at least since the Bronze Age. Selection has been imposed on sheep populations since the domestication process commenced in the Fertile Crescent approximately 10,500 calibrated radiocarbon years BP (Peters et al. Citation2005), resulting in a spectrum of phenotypically distinct breeds, whose fibre is still used for a diverse range of products, from fine clothing to coarse carpets and upholstery. By studying wool fibres on a microscopic level, we can come closer to understanding the issues of selective breeding and fleece processing used to refine the production of wool since it began to be used as a major textile material during the Bronze Age.
Denmark is extremely fortunate in the preservation of wool textiles in bogs and burials, particularly from the Bronze and Iron Ages, providing an unprecedented opportunity to explore wool fibre development. Wool fibre analyses carried out on numerous samples of Danish archaeological textiles by the Danish National Research Foundation’s Centre for Textile Research (CTR) have lead us to investigate the reliability of the methods used. This article presents the results of tests carried out to examine the comparability of two different measurement techniques and their effect on the data. The study has important implications not only for the methodology of wool analysis, but also for our understanding of selective breeding and textile production in prehistoric Scandinavia and beyond.
Background: wool and its analysis
In spite of the invention of synthetic textile fibres about 100 years ago and the ongoing research to improve them for human wear, sheep wool continues to be an important material in our modern societies and archaeological textiles document its use for garments as far back in time as the Early Bronze Age (Barber Citation1991, Ryder Citation1983a). Today as in the past, the value of wool is determined by its fineness, crimp, yield, colour, and staple strength and length. Fineness is one of the most important parameters in the modern wool industry and is defined by the mean fibre diameter of each individual fleece calculated from numerous diameter measurements made using advanced automatic technology (Qi et al. Citation1994). The fleeces with the finest fibres are valued most and are selected to be used for garments. The fineness of the individual fibres depends on many different factors such as the sex, age, and health of the animal from which they derive, where on the body they have grown, and the time of year they have been harvested. The diameter of each fibre also varies along its length. For these reasons, the modern sheep grown to produce wool for industrial purposes are reared to yield as much and as homogeneous fibre as possible.
The method of measuring fibre diameters was adapted to the study of prehistoric wool textiles and sheep skins during the 1960s to 1970s (Ryder Citation1964, Citation1969, Citation1974, Citation1981, Citation1983a, Citation1983b, Citation1987, Citation1988, Citation1992, Citation2000, Citation2005). Comparing the results with fleeces from modern, so-called wild, heritage or ‘primitive’ sheep breeds which still exist in remote areas of Europe, lead to conclusions about ancient breeds, and an evolutionary model for sheep fleece development was established (Ryder Citation1969, Citation1983a).
What distinguishes fleeces of the wild sheep breeds and what makes them comparable to prehistoric wool is that they in general consist of an outer coat of coarse kemp (with diameters from c. 60 to more than 100 microns), hair or medium fibres (with diameters from c. 25 to 60 microns), and a much finer underwool (with diameters up to c. 25 microns) (Ryder Citation1983a, p. 45, Rast-Eicher Citation2008, p. 122, Rast-Eicher and Bender Jørgensen Citation2013, p. 1225). According to the evolutionary model, sheep husbandry and breeding caused the underwool to become less fine over time while the outer coat became less coarse, eventually resulting in the disappearance of kemp and hair at the expense of the extremely fine fibres (Ryder Citation1983a).
The study of wool fibre fineness by measuring their diameters has since become an integral part of the standard analyses of archaeological wool textiles and consists of diameter measurement of 100 or more fibres per yarn or staple and statistical analyses resulting in distribution histograms. Various scholars have also developed fleece classification systems (see summary in Gleba Citation2012) and, of the two that will be mentioned here, Ryder’s system recognises six fleece types ().
Table 1. Ryder’s classification system recognises six fleece type categories and builds on the methods used in the wool industry to classify the individual fleeces.
Wool samples from several of the prehistoric Danish textiles as well as samples of fur from some of the skin capes have previously been studied and the results were used to characterise the fleece types according to Ryder’s system (Bender Jørgensen and Walton Citation1986, p. 177, Walton Citation1988, p. 144, Ryder Citation1988, p. 136). As a result, the Danish Bronze and Early Iron Age textiles have been interpreted as being made from fleeces with very fine underwool and a relatively small amount of kemp (1–7%), and the majority of the samples were classified as ‘Hairy’ or ‘Hairy Medium’ and coming from a primitive moulting sheep breed.
In recent years, a new understanding has developed that wool in textiles should be seen as the result of conscious choices and meticulous processing of the material (Good Citation1999, Christiansen Citation2004, Rast-Eicher Citation2008). Analyses of fibre diameters are now interpreted as a way to understand the work involved in the processing of the wool into yarns. Preliminary sorting of the fibres for the intended use may start while plucking or cutting the fleece. Hand spinning is further facilitated by combing and teasing the wool, whereby dirt and tangles are removed (Andersson Strand Citation2012, p. 31). Through this preparatory work, the coarser fibres may be separated from the finer to achieve more uniform fibre combinations, and fibres from fleeces from different animals may be mixed in this process. The information obtained from diameter measurements of wool from textiles thus does not necessarily represent one single fleece but is an intricate and complex mixture of several different biological, technological, and human factors in the transformation from raw fleece to wool yarn.
Rast-Eicher (Citation2008) proposed a fibre categorisation system addressing the processing specifically. It is derived from one used in the wool industry (Doehner and Reumuth Citation1964) and assigns single or multiple letters to wool with different percentages of fibres of different diameters (). The system has 11 categories, taking into account the percentage of fine fibres measuring less than 25 and 30 microns and the number of outliers exceeding 30, 40, and 60 microns in the yarn samples (Rast-Eicher Citation2008).
Table 2. Rast-Eicher’s classification system consists of a flexible letter system of 11 wool quality categories and takes the process from raw wool to yarns into account.
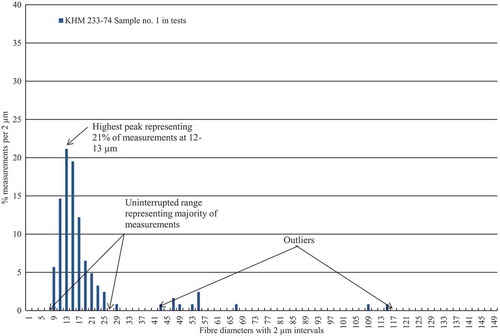
The two mentioned categorisation systems are both based on the width of the uninterrupted range in the histogram which represents the majority of the measurements and the presence, size, and percentage of fibres with diameters larger than 40 microns in any given sample, which represent outliers ().
Figure 1. Wool fibre distribution diagram. The important features to look at in a distribution diagram are the width of the uninterrupted range, the position and the height of the peaks, and the position and number of the outliers.
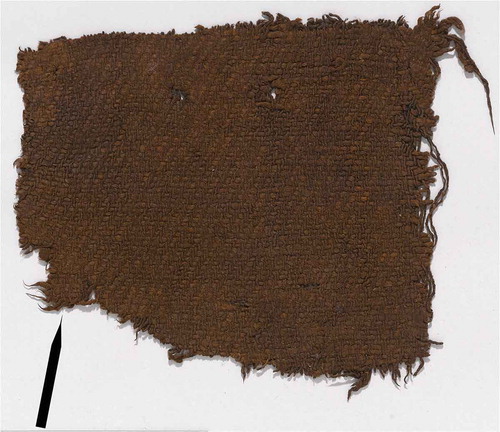
Certain parameters, such as the preservation of the prehistoric fibre material, are beyond the analyst’s control, and can make assessment of the original fibres extremely difficult. Little is known about how not only use, but also charring, mineralisation or desiccation of waterlogged textiles has affected the fibre diameters (Mannering and Peacock Citation1998). Moreover, in the case of textiles that are still in their organic state, it is common practice to take fibre samples where they will cause minimum visual damage, that is, near open edges or holes where degradation is often more advanced and may have influenced the fibre diameter ().
Figure 2. Sampling from textile fragments. Sampling is most often done near open edges or holes where degradation can be more advanced.
The previous analyses of archaeological wool fibre diameters were made using a projection microscope (Bender Jørgensen and Walton Citation1986, Ryder Citation1988, Walton Citation1988). Today, the analyses are typically made on digital images of the fibres and one standard approach has been developed by Rast-Eicher who used scanning electron microscopy (SEM) and based the investigations on analyses of mineralised textile fibres (Rast-Eicher Citation2008). SEM makes impressive images with a very fine depth of field and has a wide magnification range reaching above 10,000×. However, when the Danish National Research Foundation’s CTR initiated a systematic and comprehensive investigation of wool fibres in order to get an understanding of the available wool and the wool production in the prehistoric Danish societies, it was decided to use digital images from transmitted light microscopy (TLM) for the analyses.
Our study included 76 yarn samples from the Danish bog textiles dated to the Early Iron Age (500 BC–AD 375). They were photographed at 40× magnification (low) and the measurements of the fibres were made on the images (Mannering et al. Citation2010). The results turned out to be 5–16 microns finer than the earlier studies made using a projection microscope at 400× magnification (Bender Jørgensen and Walton Citation1986, Ryder Citation1988, Walton Citation1988). These differences raised questions regarding the accuracy of the measurements at the lower magnification, and reanalysis of a selection of the samples using SEM at 300× magnification was therefore carried out. On evaluating the results from the two analyses of the same yarn samples, we found it necessary to make a thorough investigation of the comparability of the two methods currently used by practitioners in the field. This was carried out on 36 samples from 13 textiles () and could document that inherent uncertainties existed in both, independent of the magnification.
Table 3. Yarn samples from 13 textiles from eight sites dated to the Bronze and Early Iron Ages have been studied in this project. They are listed alphabetically after the sites and numbered consecutively with reference to the specific tests in which they appear.
Experimental
The comparative study consisted of five tests (labelled Tests 1–5):
Test 1
SEM and TLM were compared by measurements on images of a standard glass stage micrometre acquired by SEM at 100×, 500×, and 1000×magnification and by TLM using 4×, 10×, and 40× objectives.
Test 2
SEM and TLM were compared by measuring the fibre diameters on images of wool fibres from the same samples using SEM at 300× magnification and TLM with a 4× objective.
Test 3
The precision of measurements at different magnifications in TLM was tested by comparing the results from diameter measurements on photographs of wool fibres using a 4× objective and a 10× objective.
Test 4
The statistical significance of the results was tested by analysis of fibres from samples of the same yarn in a textile selected at two different places. The photographs were captured using TLM with a 4× objective.
Test 5
Human and technical factors were tested by an analysis of fibre diameter measurements made on the same photographs on two separate occasions. The photographs were captured using TLM with a 4× objective in four cases and a 10× objective in one case.
The measurements of the fibres in Tests 3–5 were further classified following Rast-Eicher’s categorisation system (Rast-Eicher Citation2008) and the results were analysed.
In the case of TLM, only the objective magnification is listed here. The camera increases the magnification more than tenfold. An Olympus type BH-2 microscope equipped with a Cool Snap digital camera (A99M81023) from RS Photometrics was used for the analyses of fibres using a 4× objective. The measurements in these cases were made in ImageJ, an open-access image processing and analysis program. A Primo Star iLED microscope from Zeiss with 4×, 10×, and 40× objectives and equipped with an AxioCam ERc5s camera was used for the remaining TLM images, and the measurements in these cases were made using the camera software. The cameras were calibrated by a standard method for high-magnification light microscopes with a stage micrometre showing 1 mm divided into 10-micron sections.
The SEM analyses in Test 1 were made using a TD JEOL JSM-5310 LV scanning electron microscope equipped with Oxford Instruments Link ISIS software version 3.35. The images for this test were acquired at two different scanning speeds: (1) Slow, where each pixel is measured four times on average and (2) Kalman, where the images are made by combining the information from several quick scans of the entire viewing area. Kalman is often chosen for acquiring higher magnification images of uncoated textile fibres because the fibres absorb static charge and deteriorate if the electron beam is held in one place for too long, as it is with the Slow method. The measurements on the images were performed in Photoshop.
The SEM analyses in Test 2 were carried out using a Hitachi S 3200N Scanning Electron Microscope and the measurements made directly on the screen using the SEM software after image capture. The images for this test were acquired at slow speed.
Results and discussion
Test 1
In this test, the accuracy of the measurements obtained when using TLM as opposed to SEM at different magnifications was investigated. The embedded scale bars in SEM images acquired using scan speed Kalman at 500× magnification and scan speed Slow at 1000× magnification, respectively, were used for measurements on the image of the stage micrometre (). On the image acquired at scan speed Kalman, the results varied across the micrograph indicating a slight distortion of the image. The distance of 100 microns (0.1 mm) deviated from 0.6–3.2% longer to 0.3–8% shorter than the stated 100 microns (, and ). On the image acquired at scan speed Slow, the results were more uniform across the micrograph, but they were in all cases longer by 4.1–5.8% (, ).
Figure 3. Measurements on images acquired at scan speed Kalman. Using the embedded scale marker bar of 100 microns, measurements of 0.1 mm on the micrometre deviate by plus 0.6–3.2% to minus 0.3–8% across the SEM image acquired at scan speed Kalman at 500× magnification. The exact measurements are listed in .
Figure 4. Measurements on images acquired at scan speed Slow. Using the embedded scale marker bar of 50 microns, measurements of 0.05 mm on the micrometre deviates by plus 4.1–5.8% across the SEM image acquired at scan speed Slow at 1000× magnification. The exact measurements are listed in .
Table 4. Measurements of distances on a micrometre using the embedded SEM scale marker bars differ depending on the scan speed in SEM: In scan speed Kalman, 100 µm can be both longer and shorter than 0.1 mm. In scan speed Slow, 50 µm is in all cases longer than 0.05 mm.
Subsequently, measurements were made of the embedded scale bars of lengths 500 microns, 100 microns, and 50 microns on images taken at 100×, 500×, and 1000× magnifications, respectively, with both scan methods using the appropriate distances on the photograph of the stage micrometre as a scale (). In all cases, the measurements of the SEM scale bars turned out to be from 0.29 to 5.79% shorter than stated and the differences appeared at both scan speeds and all three magnifications. The results from the highest magnification did not appear more accurate than the ones from the lowest magnification.
Table 5. The lengths of 0.5 mm, 0.1 mm, and 0.05 mm on the micrometre can be both shorter and longer than the equivalent distances on the SEM scale bar and differ according to the scan speed.
In the third analysis of the SEM images, different distances on the micrometre itself were made using the same scales as above of 50, 100, and 500 microns on the micrometre at the same three magnifications (). Six out of the 40 measurements recorded were precisely equal (two at each magnification), whereas the remaining were either shorter up to 7.7% or longer up to 6.1%. The biggest discrepancies were recorded at the highest magnification.
Table 6. Using 0.5 mm, 0.1 mm, and 0.05 mm on the micrometre as scales for measurements of the micrometre, the results in most cases turn out either shorter or longer by 0.3% to 7.7% depending on the scan speed. Discrepancies are seen at all three magnifications.
On the TLM images at three different magnifications, distances of 10, 20, 50, and 100 microns on the micrometre were measured using the camera software (). In the images taken using the 10× objective, two measurements were 1.9% longer than 10 and 20 microns, respectively, whereas the deviations in the remaining results were less than 1%. Both the least and the most accurate results were found at the two highest magnifications.
Table 7. Measurements of distances on the micrometre using the camera software in TLM images with three different objectives give variable results and the most accurate measurements as well as biggest discrepancies are found at the two higher magnifications.
Test 1 demonstrated that measurements made on images from SEM and TLM of the same scale differed. In TLM, the measurements of the scale were shorter by 0.2 and 0.3% in two out of nine cases and in the remaining cases they were longer by 0.1–1.9% (see ). Measurements of the embedded SEM scale marker bars using the micrometre as scale revealed that calibration of the SEM scale bar differed from the standard micrometre (see ). It also became apparent that the results would vary depending on the scan method (see –). With the Kalman method, the images got slightly distorted causing the measurements on the micrometre to be either shorter up to 7.9% or longer up to 3.2%. With the Slow method they were in all cases longer by between 4.1 and 5.8%. The different analyses demonstrated that measurements on images from the two different microscope types were not directly comparable due to the different calibration methods. SEM is calibrated by a ratio between the scan area and the ultimate image size while TLM uses a physical calibration tool.
Test 2
The purpose of Test 2 was to compare the results from TLM and SEM images of diameter measurements of archaeological wool fibres picked from the same yarn samples. The fibre analyses of the Danish bog textiles were made using TLM with a 4× objective. A selection of the samples was reanalysed using SEM and the results were calculated (). They showed that the finest fibres recorded generally were finer in the TLM analyses than in the SEM analyses and that the calculations of the statistical modes from the TLM measurements were lower in all cases but one. The differences in the modes were not consistent but varied between 0 and 10 microns, although in most cases they were between 4 and 6 microns. Two different results are illustrated in histograms ( and ). In , the shapes of the uninterrupted curves are very similar, but the SEM results are positioned slightly to the right of the TLM results on the x-axis (indicative of the slightly coarser range of diameters), while in the two histograms are positioned similarly but the measurements from the SEM analyses have a wider uninterrupted range and a few outliers.
Figure 5. Sample no. 24 analysed using two different methods. Histograms of sample no. 24 has the TLM curve positioned to the left of the SEM curve. TLM produces finer measurements than SEM.
Figure 6. Sample no. 6 analysed using two different methods. In the histograms of sample no. 6, the TLM and the SEM curves appear very similar but a few outliers have been recorded in the SEM analysis.
Table 8. The statistical mode calculated from the results from the same yarn samples using different methods is generally higher by a few microns in the SEM results and the finest measurements are generally seen in the TLM results.
The differences recorded in Test 2 correspond well to the results from Test 1 and can be explained by the different calibration methods. However, the inconsistency of the results is surprising and may be caused by the fact that different parts of the same yarn samples were analysed, a factor which is investigated further in Test 4.
Test 3
This test was made to determine to what extent the use of a 4× objective as opposed to a 10× objective for the TLM analysis would influence the results of the fibre diameter measurements. Nine samples were analysed (). Here, too, the tests were made on different parts of the same yarn sample.
Table 9. Results using TLM with the lower magnification appear to be slightly finer giving a lower statistical mode in all cases but one. The results also demonstrate that the same yarn can be attributed two very different categories.
As in Test 2, the finest diameter measurements were seen in the results from the lowest magnification. The statistical modes at the lower magnification were subsequently lower than at the higher magnification by 2–6 microns except in one case. The shapes of the curves in the histograms were very similar, and differences resulting from the magnifications were not altogether clear. There are examples of histograms positioned almost identically () and of histograms positioned differently () as was also seen in Test 2.
Figure 7. Sample no. 13 analysed using TLM at different magnifications. The two histograms of results from TLM analyses at low and high magnification are positioned similarly and give the same impression of the fibre composition in the yarn.
Figure 8. Sample no. 36 analysed using TLM at different magnifications. The two histograms of results from TLM analyses at low and high magnification differ not only in their position on the x-axis but also in the widths of the uninterrupted curves and the peak heights.
It is generally assumed that higher magnification should enhance the precision, but the results from the lower magnification appeared to be comparable with regard to the fibre composition, as illustrated by the overall shapes of the histograms.
Rast-Eicher’s categorisation system (Rast-Eicher Citation2008) was applied to the results in this test, and it became apparent that even minor differences in the range of measurements caused divergent categorisations. In seven out of nine cases, the categorisation for the two analyses of the same yarn samples differed. The most striking examples were Samples 35 and 36 (see ). Using the 4× objective, no fibres coarser than 30 microns were recorded in these samples, whereas with the 10× objective a significant number were present resulting in the same yarns being attributed Categories AAA and B and AAA and CD, respectively. The uninterrupted ranges in the histograms, however, do not indicate significant differences in the fibre content and it is the number and size of the outliers that determine the categorisation (see ). Similar to Test 2, the results from Test 3 also indicated that an uneven distribution of the fine and coarser fibres in the yarns is more likely to cause differences in the categorisation than the chosen magnification does.
Test 4
As the results from the two previous tests have suggested, the possibility exists that the fibre compositions vary within the same strand of yarn to such an extent that the same yarn can be attributed two very different categories. To explore this question, two different samples from 11 yarns were analysed at the same magnification (TLM with 4× objective) and the impressions of the fibre combinations in both the categorisations and the histograms were examined closely ().
Table 10. The categorisations of two samples from the same yarns vary in most cases and the results demonstrate to what extent small variations in the fibre composition influence the categorisations.
The categorisations were identical in four of the 11 cases. In the remaining cases, the most pronounced differences were between categories AAA and B, equivalent to a drop of four steps in the system, which were recorded in sample nos. 16/17 (), 20/21, and 22/23, and between categories AA and CD, equivalent to a drop of five steps, which was recorded in sample nos. 9/10 (). The former was caused by 1–2% increase in the content of outliers, while the latter was caused by a decrease in the percentage of fine fibre as no fibres above 60 microns were recorded in either of these samples.
Figure 9. Categorisations of sample nos. 16 and 17 from the same yarn. The TLM analyses of fibres from samples 16 and 17 picked from the same yarn in the textile result in almost identical histograms but very different categorisations due to one measurement of 81 microns in sample 17.
Figure 10. Categorisations of sample nos. 9 and 10 from the same yarn. The histograms of the TLM results from samples 9 and 10 picked from the same yarn in the textile resemble each other and no measurements above 60 microns are recorded. The width of the curve of sample no. 10 is slightly wider and causes the different categorisation.
The results demonstrated the extent to which small variations in the fibre composition influence the categorisations. The presence of outliers in the yarns is not consistent and the analyses of these 11 yarns showed that the fibre compositions in a single yarn can vary to the extent that two parts of it are categorised very differently. The analyses also clarified that the fineness of the fibre combination in some of the yarns is overruled within the categorisation system by the existence of only a few outliers exceeding 60 microns. In these cases, an evaluation and comparison of the histograms, with respect to the uninterrupted ranges and the percentages of fine fibres in our opinion, give a better understanding of the fibre composition than the letter classification by itself.
Test 5
The statistical reliability of the fibre measurements was further examined in a final test where the results from two separate analyses made by the same person on the same photographs were compared. For this test, TLM photographs taken with a 4× objective of four samples and with a 10× objective of one sample were used (). The statistical modes differed in all cases and although the curves in the histograms appeared similar ( and ) small differences in the fibre measurements again resulted in different categorisations of three of the samples. This illustrated that the human factor also resulted in measurement uncertainty to a degree that caused the calculations to differ.
Figure 11. Two TLM analyses of the same digital images of sample no. 13. Two separate analyses of the images of sample no. 13 result in very similar histograms and give the same impression of the fibre content.
Figure 12. Two TLM analyses of the same digital images of sample no. 14. The recording of two outliers in analysis 1 of sample no. 14 is the major difference between the two analyses of the same images.
Table 11. Two analyses of the same images illustrate the complexity of the material and the difficulties of obtaining identical results. The statistical mode differs in all cases and the categorisations differ in three out of five cases.
Manually operating a computer mouse and finding the clearest places to mark the outlines of the fibres can result in size variations ranging to several pixels. This problem may be further influenced by the sharpness of the pictures and the quality of the computer screen. Together with the facts that the fibres are rarely completely round in cross-section and that the width of a single fibre varies along its length, it must be concluded that it is impossible to fully recreate analyses. It is expected that this problem would be compounded if the fibre diameters were measured by different researchers.
Conclusions
Across time and space, wool fibres of specific qualities such as the ability to insulate for or against heat, to make textiles water repellent, easy to spin, dye or felt, were selected for the production of diverse textiles intended for diverse purposes. Already at the end of the third millennium BC, Near Eastern Ur III archives mention at least five categories of wool quality, with category 1 being the finest and destined for the production of royal garments (Waetzoldt Citation1972). Two millennia later, Roman encyclopaedian Pliny, Citation1940 the Elder (Naturalis Historia 8, 190) informs us that the most expensive sheep wool of his day (first century AD) came from the Po region, and was valued for its whiteness and fineness. Medieval economies of Europe were built on wool trade, which encouraged the breeding of sheep with specific qualities (Munro Citation2009, p. 4). Over the last few decades, textile archaeologists have been attempting to identify breeds mentioned in these written sources by measuring the diameters of fibres in extent archaeological wool samples.
Differences between the wools used already during the Bronze Age in Central Europe and Scandinavia have been noted (Rast-Eicher and Bender Jørgensen Citation2013, Grömer et al. Citation2018, p. 356), with the fine fibres in the Scandinavian wools having on average lower diameters. Understanding such regional variations can in some instances help identifying exotic materials. Thus, some unusual Hallstatt Bronze Age fleeces with dyed, naturally nearly white wool and fibre diameter measurements that did not correspond to the typical Bronze Age fleeces found in the salt mines of Hallstatt in Austria have been interpreted as possible imports (Rast-Eicher and Bender Jørgensen Citation2013, p. 1234). Such cases are more evident in the material dating to the medieval period, from which many more wool textiles survive. For example, among the over 400 textile fragments recovered from the thirteenth- to fifteenth-century AD Elbing in Poland, many were identified as English or Spanish (merino) imports, based on the comparison of their histograms to the ones of fibres in modern samples from the Shropshire and Merino breeds (Maik Citation1998, p. 219).
Even within a single textile, different types of wool may be combined to achieve a specific aim: for example, the wool in the warp of the tablet-woven bands from the Iron Age salt mines of Hallstatt was carefully selected and processed, likely in order to withstand abrasion of the tablets (Rast-Eicher and Bender Jørgensen Citation2013, p. 1232). The warp and weft of the Norse Medieval garments found on Greenland were made of different parts of the sheep fleece, with long and strong hair used for the warp (which needed to withstand the tension on the loom), and shorter and finer underwool used for the weft, which provided insulation (Walton Rogers Citation2004). These were conscious choices on the part of the craftspeople, who understood the different properties imparted onto textiles by their choice and processing of the specific raw material.
Archaeological data does not permit us to disentangle the complexities of how wool quality was defined by particular cultures during various periods of the past, but it is still possible to see the potential of their available resources and that there were various methods for obtaining the ideal raw material appropriate for the end product. Nor is it possible to deduce the exact fibre composition of prehistoric raw or unprocessed wool directly from the textiles. Prehistoric skins have been considered ideal for this purpose and several analyses have been made of fibres from skin capes from the same contexts as the textiles and interpreted as such (Ryder Citation1990, Rast-Eicher and Bender Jørgensen Citation2013). However, our recent analyses of fibres from Danish Early Iron Age skin capes, made of cured but not de-haired sheep skins, seemed to indicate that the skins had also been selected for their special qualities and with specific use in mind, wherefore they do not necessarily represent the raw material used for textile production (Mannering and Gleba CitationForthcoming).
The extremely good preservation of the Danish prehistoric textiles has enabled the execution of the five tests described above. In most other cases, fibre analyses are carried out on one small sample from one yarn in a textile. Knowing the inherent uncertainties in the analyses that have been highlighted by the tests makes interpretation of the complex mixture of information our measurements provide even more challenging. The results are influenced by the type of microscope (Tests 1 and 2), the magnification (Test 3), the nature of the material, and the restrictions for sampling which make it impossible to measure the exact same fibres at the exact same locations (Tests 2 and 4). The analyst and the resolution of the images can also affect the results (Test 5). However, the results can provide useful information because the uncertainties appear inconsistent and occur regardless of the method and the magnification, and because the histograms obtained from the same samples using either microscope type as well as different magnifications are comparable (Tests 2 and 3).
The differences in the measurements that we observed were either on the micron level which did not influence the overall results or they were in the amount of outliers, usually the fibres with large diameters (see , , , , ), which could have a great impact on the resulting categorisations (Test 3, 4, 5) because it is the number and size of the outliers that define the categorisation of wool in both Ryder’s and Rast-Eicher’s classification systems. Furthermore, since sorting the wool of a fleece can skew a sample towards the finer end of the distribution in any case, we need to focus on the uninterrupted range and the shape of the histogram rather than the outliers, which do not present the whole picture (as already pointed out by Gleba Citation2012).
A more nuanced and less rigid approach for interpreting the results can be to study and compare the appearances of the histograms representing the different yarns, to evaluate the uninterrupted ranges and the height of the peaks, and to calculate the percentages of fine, medium, and coarse fibres. This offers the possibility of detecting patterns despite the uncertainties demonstrated by our tests, and an understanding of the fibre compositions in the wool yarns from the Danish prehistoric textiles has been obtained by this method and has revealed interesting details that can be attributed to either the raw material or its processing (Skals and Mannering Citation2014). This way, too, it is easier to abstain from attributing quality definitions, a risk which is often a consequence of using classification systems.
The methodological refinements allow differentiating important regional as well as chronological patterns in the wool yarn composition, which may be attributed to the work processes of the craftspeople. The characteristic differences between the wool yarns from the Early Bronze Age, the Pre-Roman Iron Age, and the Roman Iron Age in Denmark (Skals and Mannering Citation2014) are not the only examples. Chronologically, there are also differences between the Bronze Age and Iron Age wool in Hallstatt, Austria (Rast-Eicher and Bender Jørgensen Citation2013), and in Italy (Gleba Citation2012). In all cases, Bronze Age wools have very fine underwool and a significant presence of very coarse fibres. Over time, the mean diameter of underwool increases and that of coarse hair fibres decreases, leading towards greater homogeneity of the fleeces. There are also differing wool types contemporaneously present during the Pre-Roman Iron Age in Scandinavia (Mannering and Gleba CitationForthcoming) and the Iron Age in Italy (Gleba Citation2012), suggesting either the coexistence of several different sheep varieties and/or differential selection and processing of wool.
The very detailed studies of prehistoric wool are particularly made possible by the large number of wool textiles preserved in Denmark and, to date, only the salt mines in Hallstatt, Austria, have produced a comparable amount of organically preserved wool textiles dating to the European Bronze and Iron Ages (Rast-Eicher Citation2013, Rast-Eicher and Bender Jørgensen Citation2013). As more archaeological samples from across Europe and the Near East are analysed, we will be able to accumulate statistically significant amounts of samples for a better understanding of sheep fleece evolution through time and space and contribute new insights into prehistoric consumption and exchange of wool, textiles, and livestock. But we must ensure that our methods are robust and reliable, and we should not be afraid of making more nuanced and subtle interpretations of the archaeological data.
Acknowledgments
The research leading to these results was funded by the Danish National Research Foundation’s Centre for Textile Research [DNRF64], the National Museum of Denmark, the European Commission’s Marie Curie Actions under the European Union’s Seventh Framework Programme [FP7-PEOPLE-IEF-2008-236263], and the European Research Council under the European Union’s Seventh Framework Programme [FP/2007-2013-312603].
Additional information
Funding
References
- Andersson Strand, E., 2012. The textile Chaîne Opératoire: using a multidisciplinary approach to textile archaeology with a focus on the ancient near east. Paléorient, 38 (1–2), 21–40. doi:10.3406/paleo.2012.5456
- Barber, E.J.W., 1991. Prehistoric textiles. The development of cloth in the neolithic and bronze ages with special reference to the aegean. Princeton: Princeton University Press.
- Bender Jørgensen, L. and Walton, P., 1986. Dyes and fleece types in prehistoric textiles from Scandinavia and Germany. Journal of Danish Archaeology, 5, 177–188.
- Christiansen, C.A., 2004. A reanalysis of fleece evolution studies. In: J. Maik, Editor. Priceless invention of humanity – textiles. NESAT VIII. Łódź: Łódzkie Towarzystwo Naukoweó, 11–17.
- Doehner, H. and Reumuth, H., 1964. Wollkunde. Berlin/Hamburg: Paui-Parey-Verlag.
- Gleba, M., 2012. From textiles to sheep: investigating wool fibre development in pre-Roman Italy using scanning electron microscopy (SEM). Journal of Archaeological Science, 39, 3643–3661. doi:10.1016/j.jas.2012.06.021
- Good, I., 1999. The ecology of exchange: textiles from Shahr-I Sokhta, Eastern Iran. Sheep to Textiles: Approaches to Investigating Ancient Wool Trade. Textile Trading and Distribution in Antiquity, Thesis (PhD). University of Pennsylvania.
- Grömer, K., Bender Jørgensen, L., and Baković, M., 2018. Missing link: an early wool textile from Pustopolje in Bosnia and Herzegovina. Antiquity, 92 (362), 351–367. doi:10.15184/aqy.2018.18
- Maik, J., 1998. Westeuropäische Wollgevebe im mittelalterlichen Elbląg (Elbing). In: L.A. Bender Jørgensen and C. Rinaldo, Eds. Textiles in European archaeology. Report from the 6th NESAT Symposium, 7-11th May 1996 in Borås. Göteborg: Göteborg University, 215–232.
- Mannering, U., Possnert, G., Heinemeier, J. and Gleba, M. 2010. Dating Danish textiles and skins from bog finds by means of 14C ‘AMS. Journal of Archaeological Science, 37, 261–268. doi:10.1016/j.jas.2009.09.037
- Mannering, U. and Gleba, M., Forthcoming. Designed for life and death. Oxford: Oxbow Books.
- Mannering, U., and Peacock, E., 1998. A note on mineral preserved textiles from the cemetery at Nørre Sandegård Vest, Bornholm, Denmark. Archaeological Textiles Newsletter, 26, 8-13.
- Munro, J., 2009. Three centuries of luxury textile consumption in the low countries and England, 1330-1570: trends and comparisons of real values of woollen broadcloths (Then and Now). In: K. Vestergård Pedersen and M.-L.B. Nosch, Eds. The medieval broadcloth: changing trends in fashions, manufacturing, and consumption. Oxford: Oxbow Books, 1–73.
- Peters, J., Von den Driesch, A., and Helmer, D., 2005. The upper euphrates tigris basin: cradle of agro-pastoralism? In: J.-D. Vigne, J. Peters, and D. Helmers, Eds. The first steps of animal domestication. Oxford: Oxbow Books, 96–123.
- Pliny, R. H., 1940. Natural History, Volume VIII, Books 8-11, Transl. HRackham, Loeb Classical Library No. 353, Harvard: Harvard University Press.
- Qi, K., et al., 1994. Evaluation of the optical fibre diameter analyses (OFDA) for measuring fiber diameter parameters of sheep and goats. Journal of Animal Science, 72, 1675–1679.
- Rast-Eicher, A., 2008. Textilien, wolle, schafe der eisenzeit in der schweiz. Basel: ArchäologieSchweiz.
- Rast-Eicher, A., 2013. The fibre quality of skins and textiles from Hallstatt salt mines. In: K. Grömer, et al., Eds. Textiles from Hallstatt. Weaving culture in bronze age and iron age salt mines. Budapest: Archaeolingua col 28 Vols. 163-178.1
- Rast-Eicher, A. and Bender Jørgensen, L., 2013. Sheep wool in Bronze Age and Iron Age Europe. Journal of Archaeological Science, 40, 1224–1241. doi:10.1016/j.jas.2012.09.030
- Ryder, M.L., 1964. Fleece evolution in Unterzuchungen zur neusumerisc domestic sheep. Nature, 204 (4958), 555–559. doi:10.1038/204555a0
- Ryder, M.L., 1969. Changes in the fleece of sheep following domestication. In: P.J. Ucko and G.W. Dimbleby, Eds. The domestication and exploitation of plants and animals. London: Duckworth, 495–521.
- Ryder, M.L., 1974. Wools from Antiquity. Textile History, 5, 100–110. doi:10.1179/004049674793692046
- Ryder, M.L., 1981. Wools from Vindolanda. Journal of Archaeological Science, 8, 99–103. doi:10.1016/0305-4403(81)90015-7
- Ryder, M.L., 1983a. Sheep and Man. London: Duckworth.
- Ryder, M.L., 1983b. A re-assessment of Bronze Age wool. Journal of Archaeological Science, 10, 327–331. doi:10.1016/0305-4403(83)90070-5
- Ryder, M.L., 1987. Merino history in old wool: the use of wool remains in ancient skin and cloth to study the origin and history of the fine-woolled sheep that became the Spanish Merino. Textile History, 18 (2), 117–132. doi:10.1179/004049687793700691
- Ryder, M.L., 1988. Danish Bronze Age Wools. Journal of Danish Archaeology, 7, 136–143.
- Ryder, M.L., 1990. Skin, and wool-textile remains from Hallstatt, Austria. Oxford Journal of Archaeology, 9 (1), 37–49. doi:10.1111/ojoa.1990.9.issue-1
- Ryder, M.L., 1992. The interaction between biological and technological change during the development of different fleece types in sheep. Anthropozoologica, 16, 131–140.
- Ryder, M.L., 2000. Issues in conserving archaeological textiles. Archaeological Textiles Newsletter, 31, 2–7.
- Ryder, M.L., 2005. The human development of different fleece-types in sheep and its association with the development of textile crafts. In: F. Pritchard and J.P. Wild, Eds. Northern Archaeological Textiles NESAT VII. Oxford: Oxbow Books, 122–128.
- Skals, I. and Mannering, U., 2014. Investigation of wool fibres from danish prehistoric textiles. Archaeological Textiles Review, 56, 24–25.
- Sørensen, T.F., 2017. The two cultures and a world apart: archaeology and science at a new crossroads. Norwegian Archaeological Review, 50 (2), 101–115. doi:10.1080/00293652.2017.1367031
- Waetzoldt, H., 1972. Unterzuchungen zur neusumerischen textilindustrie. Rome: Studi Economici e Tecnologici 1.
- Walton, P., 1988. Dyes and wools in Iron Age Textiles from Norway and Denmark. Journal of Danish Archaeology, 7, 144–158.
- Walton Rogers, P., 2004. Fibres and dyes in norse textiles. In: E. Østergård, Ed. Woven into the Earth. Textiles from Norse Greenland. Aarhus: Aarhus University Press, 79–92.