
 ?Mathematical formulae have been encoded as MathML and are displayed in this HTML version using MathJax in order to improve their display. Uncheck the box to turn MathJax off. This feature requires Javascript. Click on a formula to zoom.
Abstract
Parkland agroforestry can store carbon and conserves biodiversity. Studying the relationship between carbon stock and biodiversity is crucial in understanding the tradeoff between major benefits of the parkland agroforestry system, and way to achieve the optimum balance between them. Therefore, this study aims to estimate the biomass and SOC in community type, and explore the relationship between carbon stocks and diversity. Tree with DBH (Diameter at breast height) > 2 cm was measured and species were identified in 75 (50x100m) randomly located plots. Species richness (S), Species evenness (J), Shannon-weiner diversity index (H’) and Simpson diversity index (D) of the study area were 3.02, 0.81, 0.82 and 0.46 respectively. Similarly, the mean aboveground (AGC), belowground (BGC) and soil organic (SOC) carbon were 7.9, 3.03 and 20.07 Mg C ha-1 respectively. There was a liner and weakly significant correlation between AGC and tree J in plant community 2 (r = −0.558, P < 0.05) and 3 (r = −0.451, P < 0.05), and there was a negative correlation between J (r = −0.552, P < 0.05), D (r = −0.646, P < 0.05) and H’ (r = −0.643, P < 0.05) with TC (Total carbon) in plant community 2. However, there was no significant relationship between J, D and H’ with TC in plant communities 1 and 3. In these parkland agroforestry systems, the relationship tree species diversity with AGC and TC appeared to be highly variable; it indicates that parkland agroforestry systems have significantly improved the vegetation and SOC. However, forest carbon enhancement cannot assure the biodiversity conservation and promotion in a parkland agroforestry system.
PUBLIC INTEREST STATEMENT
The paper clearly showed Biodiversity and its relationship with the carbon cycle has become an important consideration in international efforts to mitigate the loss of climate change, by reducing the conversion of natural ecosystems. Furthermore, the role that biodiversity play in shaping ecosystem functioning has become a concern in ecology. For developing the best ecological plans to protect biodiversity, maintain ecosystem productivity and mitigate the effects of global warming, the relationships between species diversity and ecosystem productivity and thus carbon stocks have received particular emphasis in recent decades The research findings showed that, the relationship tree species diversity with aboveground carbon and ecosystem carbon appeared to be highly variable; it indicates that, parkland agroforestry systems has significantly improved the vegetation and soil carbon, and forest carbon enhancement cannot assure the biodiversity conservation and promotion in parkland agroforestry system.
Competing interest
The authors declare no competing interests.
1. Background
In the tropical region, deforestation and forest degradation have significant contributors to the most pressing global environmental challenges, such as biodiversity loss and climate change (Strassburg et al., Citation2010; Talbot, Citation2010). Increase in population, demand for forest products and services, agricultural expansion, industrialization in the forested areas and declining food crop productivity are some of the major factors increasing the problem. The net forest cover of Ethiopia declines from 15.11 million ha in 1990 to 12.5 million ha in 2015 (FAO, Citation2015); however; the average annual deforestation rate is estimated at 141,000 ha (Food for FAO, Citation2010). The destruction of natural forests leads to the loss of biodiversity that important ecosystem function.
Agroforestry has been an old and diverse practice in Ethiopian farming systems (Bishaw & Abdelkadir, Citation2003; Gebrehiwot, Citation2004). Parkland agroforestry, hedgerow intercropping, multiple strata home gardens and riparian zone vegetation are the most noticeable traditional practices across most agroecosystems of Ethiopia (Bishaw & Abdelkadir, Citation2003). There are many types of traditional agroforestry practices found in different parts of the country, including Northern Ethiopia (Gebreegziabher et al., Citation2010; Hadgu et al., Citation2009; Kassa et al., Citation2010).
Agroforestry practices can play an important role in a sustainable environment and agricultural production. It is well-known that models that combine of woody perennials (trees, shrubs, palms, bamboos, etc.) with annual crops and/or animals in the same piece of land can contribute to climate change adaptation and mitigation (Gebrewahid et al., Citation2018; Hunde, Citation2015; Matocha et al., Citation2012; Mbow et al., Citation2014), regulating soil, water, and air quality, reducing inputs by natural regulation of pest causing more efficient nutrient cycling (Smith et al., Citation2013), increasing yield (Vaast & Somarriba, Citation2014), maintain food security (Jamnadass et al., Citation2013; Kiptot et al., Citation2014), soil fertility enhancement (Gebrewahid et al., Citation2019b) and biological diversity (Gebrewahid & Abrehe, Citation2019a; Sanchez et al., Citation1997).
Carbon pools are components of the ecosystem that can either accumulate or release carbon and have classically been split into two main categories such as biomass carbon stocks and soil carbon stocks. Biomass Carbon stock can be defined as the removal of atmospheric carbon dioxide and storage in green plant biomass through the process of photosynthesis (Noble et al., Citation2000). These sinks can be above-ground biomass (trees) and living below the ground biomass in the soil (roots and microorganisms) (Nair et al., Citation2009). Carbon storage is largely influenced by species composition (Bunker et al., Citation2005; Henry et al., Citation2009) and thus there may occur a high relationship between carbon stocks and agroforestry practices. A land-use system containing tree species with higher woody plant density will have a higher biomass carbon storage (Rahayu et al., Citation2005).
The relationship between forest diversity and carbon stock has become an important consideration in the carbon cycle and in adapting to climate change (Midgley et al., Citation2010). Furthermore, the role of forest diversity plays a significant role in supporting ecosystem processes, function and services have become an issue in environment and ecology (Loreau et al., Citation2001). For developing environmental management plans to play climate change mitigation & adaptation and to protect biodiversity, the relationships between forest diversity and biomass carbon stocks have received particular emphasis over the last decades (Bosworth et al., Citation2008; Lei et al., Citation2009; Van Con et al., Citation2013). Taking together and looking for the relationship between carbon stocks and biodiversity trees is important to optimize the most environmental benefits of carbon storage and biodiversity conservation in the agroforestry system. In addition, such studies help to highlight the global environmental benefits of parkland agroforestry.
The relationship between tree species diversity and carbon stock shows the complexity underlying mechanisms and needs for further studies (Cavanaugh et al., Citation2014). Lack of consistent pattern on how carbon (biomass and soil) stock and diversity measures are related (Chisholm et al., Citation2013). The use of multiple measures of species evenness, Shannon-Weiner and Simpson’s diversity may enhance our understanding of how carbon storage and biodiversity measures are related in various plant community types of a parkland agroforestry system. To our knowledge, no study has focused on how biodiversity measures can influence the way aboveground and ecosystem (biomass + soil) carbon stocks are related to evenness, Shannon-Weiner and Simpson’s diversity index in a parkland agroforestry system. The aim of this work was to estimate the biomass and soil carbon stock in plant community type and to explore the relationship between carbon stock and biodiversity measures. As a hypothesis, it was expected to find a significant difference in carbon stock and species diversity measures between communities and a positive relationship between them.
2. Method
2.1. Study area
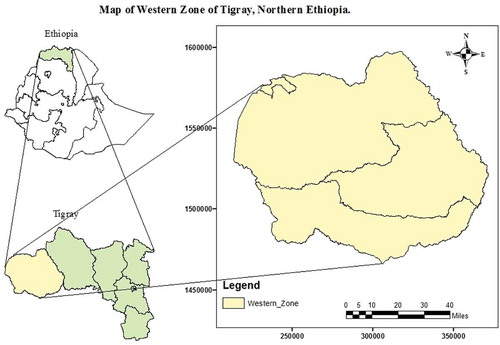
The study was carried out in the Western administrative zone of the Tigray region, Northern Ethiopia (13°42′ to 14°28′ North Latitude and 36°23′ to 37°31′ East Longitude) (Figure ). The study site is comprised of parkland agroforestry that occupies lower, middle and upper altitude gradients. The total land area of the western zone of Tigray is 1.5 million ha. The western zone of Tigray is one of the less densely populated areas in Ethiopia, with an average density of 33-person km−2. The elevation ranges from 500 to 3000 m a.s.l. and the annual rainfall (RF) for the zone ranges from 609–2316 mm (mean annual RF was 1504 mm) and mean annual temperature ranges (Min. and Max.) from 27 to 45°C and 10 to 22°C. A range of soil types are found, but the dominant soil type is Vertisols, Luvisols, and Cambisols. The farming is carried out to meet household needs and to derive cash. Mechanized agriculture is practiced ata lower altitude. The dominant farming is a mixed crop-livestock farming system solely managed by family labor. The total cultivated area is 573,285 hectares (Gebrewahid et al., Citation2018).
Figure 1. Map of Western Zone of Tigray, Northern Ethiopia
2.2. Woody species inventory
In order to estimate the abundance of tree species in the parkland agroforestry system to identify in selected household farm plot then, Rectangular plot of 100m x 50m (0.5 ha) was randomly selected (Nikiema, Citation2005), for tree and shrubs inventory on agroforestry system owned by the selected households. According to FAO, (Citation2005), a tree is defined as a woody perennial plant, with a single main stem or in case of coppice several stems, and has a more or less definite crown. And a shrub is woody perennial plants, often without a definite crown, and generally with heights between 0.5 m and 5 m. However; the interest of the research to assess all trees and shrubs existing in parkland agroforestry, the species of the encountered trees and shrubs were identified, number of stems were counted and the diameter at breast height (>2 cm DBH) and height (>2 m height) of each of them were measured.
Plant identification was carried out both in the field and in the herbarium. Voucher specimens were collected for all plant species not identified in the field. The plant specimens were properly pressed, dried, transported and deposited at the National Herbarium, Addis Ababa University, Ethiopia for subsequent identification. Nomenclature of species was followed by the publications of the Flora of Ethiopia and Eritrea (Bein et al., Citation1996; Bekele-Tesemma & Tengnäs, Citation2007).
2.3. Soil sampling techniques
Soil samples were taken from four corners and center of the 0.5 ha rectangular plot using “X” pattern at a 60 cm soil depth (Gebrewahid et al., Citation2018; Negash & Starr, Citation2015) and composited to make one representative sample for each quadrant for analysis of soil organic carbon. In addition, from the same quadrant, soil samples for soil bulk density determination were collected using 10 cm length and 3.4 cm diameter core sampler carefully driven into the soil to avoid compaction (Roshetko et al., Citation2002). Totally 75 disturbed soil samples and 375 non-disturbed soil samples were taken using auger and core sampler.
3. Data analysis
3.1. Cluster analysis
Classification by means of cluster analysis is the most common multivariate technique used in ecological works. In this study, a hierarchical (agglomerative) cluster analysis was performed using the free statistical software R version 5.3.1 using package clusters to identify plant communities. The similarity ratio with Ward’s group linkage method was applied for cluster analysis i.e. to determine plots that can be classified into the same groups based on the species abundance data. Indicator species analysis was performed in R using package labdsv (Roberts & Roberts, Citation2016). Linear projection dendrogram was used to depict the outcome of cluster analysis. Based on the hierarchical cluster analysis three plant community types were identified. Therefore, within the plant community the amount of carbon stock, plant species diversity measures, and their relationship were analyzed.
3.2. Plant community types
Three plant community types were identified from the hierarchical cluster analysis (Figure ). The analysis was based on the abundance data of the species. The test statistic value from Multi Response Permutation Procedure technique for the three groups was −31.246 (P < 0.001) showing that the three groups are different (Figure ).
Figure 2. Dendrogram showing plant community types of Parkland agroforestry of Western Zone of Tigray, Northern Ethiopia
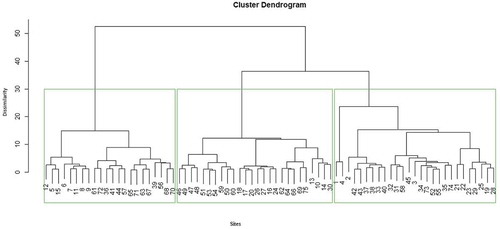
Community 1: Cordia africana—Diospyros mespiliformis Community type
This Community consists of 21 plots and the mean altitudinal gradient of this community was 2090 mean above sea level. Topographically this community was situated on a gentle slope (5% mean slope). Totally, 18 species were associated with this community, which were all from the parkland agroforestry system. Anogeissus leiocarpus were also dominant species.
Community 2: Balanites aegyptiaca—Pterocarpus leucens Community type
This Community occurred in the mean altitudinal gradient of 1585 m with a mean slope of 7%. It comprised of 27 plots and 22 species that had an association with this community, which were all from Millennium park area closures. Combretum fragrans (C. adenogonium, C. ghasalense) were also among the dominant species of the type.
Community 3: Carissa spinarum—Ziziphus spina-christi community type
This Community comprised 26 plots which were all from the parkland agroforestry system. There were 27 species that were associated with this community. It occurs in the mean altitudinal range of 1812 m on the gentle slope of topography (mean slope of 9 %). Ficus sycomorus were also among the dominant species.
3.3. Estimation of carbon stock
The AGB (Aboveground biomass) of each tree was calculated for each plot using the Eq. 1 for parkland agroforestry, and the lowest value of mean error according to (Kuyah et al., Citation2012a). This equation was selected as it was appropriate to estimate a wide range of parameters ranging from DBH or height to aboveground biomass with the lowest prediction error value. Moreover, this equation is developed for trees grown in agroforestry and DBH greater than 2.5 cm. Besides, this equation was developed in areas having similar environmental conditions (climate and soils) in the study area (Gebrewahid et al., Citation2018).
Where; AGB = Estimation of the aboveground biomass (kg dry matter/plant), DBH = Diameter (cm) at breast height (1.3 m)
Belowground biomass was estimated following Eq. 2 developed by (Kuyah et al., Citation2012b). It estimates belowground biomass carbon (BGC) through a relationship to aboveground biomass.
Where; BGB = Belowground biomass, AGB = Aboveground biomass
Soil organic carbon stock (SOC) was estimated following Eq. 3 developed by Pearson et al., (Citation2007). SOC was determined following the Walkley-Black oxidation method and bulk density was determined using the gravimetric method (Grossman & Reinsch, Citation2002).
Where; C = soil organic carbon concentration determined in laboratory (g kg−1), ρ = bulk density (g cm−3), d = soil depth of sampled soil layer (cm), frag = % volume of coarse fragments/100
Total carbon stock was calculated by summing up the individual carbon pools following EquationEquation 4(4)
(4) (Pearson et al., Citation2005). Carbon stock density of the study area:
Where; TC = Total carbon, AGC = Aboveground carbon, BGC = Belowground carbon, SOC = Soil organic carbon.
3.4. Diversity
Diversity measures such as shannon-weiner Diversity index(H’), simpson’s index of diversity (D), and evenness (E´) were calculated. The formulae for computing diversity indices and evenness were indicated below:
3.5. Shannon-weiner diversity index (H’)
Shannon-weiner diversity Index is measured through a combination of species richness (the number of species per sample) and species evenness (the relative abundance of each species) (Begon et al., Citation2006).
Shannon and weiner (Citation1963) index of diversity was calculated using the Eq. 5:
Where; H’ is Shannon diversity index, Pi is a proportion of individuals found in the ith species, S is the number of species and ln is the natural logarithm.
3.6. Simpson’s index of diversity (D)
Simpson’s index is a weighted arithmetic mean of proportional abundance and measures the probability that two individuals randomly selected from a sample will belong to the same species. The value of Simpson’s D ranges from 0 to 1, with 0 representing infinite diversity and 1 representing no diversity, so the larger the value of D, the lower the diversity. Simpson’s index of diversity is calculated using Eq. 6
Where; n = the number of individuals each species, and N = the total number of individuals of the species for the site
3.7. Species evenness (equitability index)
Evenness refers to the variability in the relative abundance of species. The evenness index describes the equality of species abundance in a community (Begon et al., Citation2006). Evenness (J) was calculated as:
Where; H’ is the Shannon diversity index, S is the number of species in a particular altitudinal gradient and Pi = is the proportion of total individuals in the ith species.
3.8. Statistical analysis
The relationships between the diversity indexes (D, H’ and J) and carbon stocks (AGC and TC) for the values obtained at the three communities of the agroforestry system were explored using Pearson’s correlation coefficient (R2). Both vegetation and soil carbon data, and biodiversity measures were treated using univariate analysis between the three community types of the parkland agroforestry system. Variables were compared using a one-way analysis of variance (ANOVA) following linear model (GLM) procedure at P < 0.05 with the help of R software (Version 3.5.1). If statistical significance differences were observed (P < 0.05), Tukey’s HSD test was used to separate means.
4. Result
4.1. Species diversity, richness, and evenness of the plant community
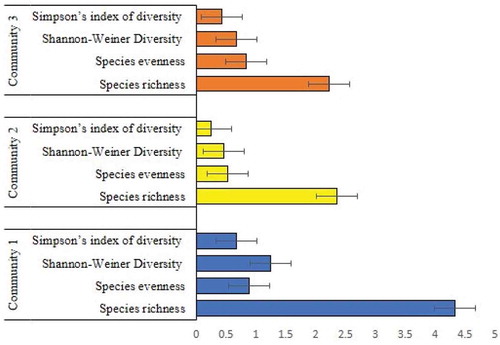
Tree species richness varied across communities (P = 3.281e-14) (Table ; Figure ). Among the communities, community 1, from the parkland agroforestry system had the highest number of species (4.33) accounting for 49 % of the total number. The average number of tree species richness per farm was lowest at the community 2 and 3. For the whole samples in the study, the number of tree species per farm varied from 2 to 6 with an overall average of 3. Shannon`s weiner and simpson`s diversity indices showed a significant difference, Community 1 had the significantly highest shannon-weiner diversity (P = 4.775e-10) and simpson’s index of diversity (P = 2.115e-06) followed by communities 3 and 2 (Table ). Community 1 followed by communities 3 had the highest species evenness value. While Community 2 had the least evenness value but not a significant difference (Table ).
Table 1. Mean (± standard error) Species richness, evenness, Shannon-Weiner Diversity and Simpson’s index of diversity for each of the three plant communities and results of one-way ANOVA (at α = 0.05, significant differences between)
Figure 3. Woody species diversity of parkland agroforestry system of Western Zone of Tigray
4.2. Carbon stock density of the plant community
4.2.1. Biomass carbon
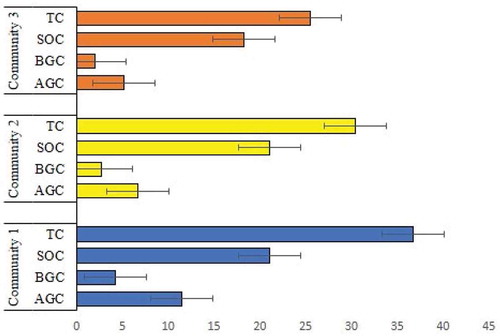
Differences in carbon density in the aboveground and belowground biomass along the plant community in the parkland agroforestry systems are shown in (Table ; Figure ). Aboveground biomass C stocks ranged between 0.25 and 56.56 Mg ha-1 (on average 7.9 Mg C ha-1), and belowground biomass C stocks ranged between 0.13 and 19.34 Mg ha-1 (on average 3.03 Mg C ha-1). We had hypothesized that aboveground and belowground C stocks would significantly differ between communities, and the differences were found to be significant between communities (Table ).
Table 2. Mean (± standard error) Aboveground (AGC) and belowground (BGC), soil organic (SOC) and total (TC) carbon stocks (Mg C ha-1) for each of the plant communities and results of one-way ANOVA (at α = 0.05, significant difference)
Figure 4. Carbon stock of parkland agroforestry system of Western Zone of Tigray
4.2.2. Soil organic carbon stocks
Parkland agroforestry SOC stocks for the 0–60 cm layer ranged between 2.28 and 40.5 Mg ha-1 (on average 20.07 Mg C ha-1). The agroforestry system mean SOC stocks by the community are given in Table ; Figure . In contrast to biomass C stocks, mean SOC stocks were the highest for the community 2 (21.05 Mg ha-1) and the lowest for the community 3 (18.27 Mg ha-1). However, contrary to our hypothesis, the differences between communities mean SOC stock values were not significantly different (Table ).
4.2.3. Ecosystem (biomass + soil) carbon stocks
Parkland agroforestry ecosystem C stocks (sum of total biomass C and SOC 0–60 cm) ranged from 2.67 to 89.62 Mg ha-1 (on average 31 Mg C ha-1). Mean C stocks did show significantly differ between the three community systems (Table ; Figure ), as we had hypothesized. SOC stocks were significantly greater than biomass C stocks at all communities, averaging 33 %, 125 % and 153 % for the community 1,2 and 3, respectively.
4.3. Relationship between diversity and carbon stock in parkland agroforestry
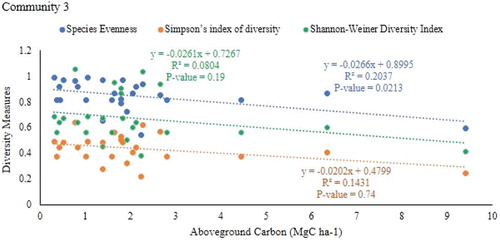
The result showed that there was a negative but weak and significant relationship between aboveground carbon stock and species evenness of community 2 (r = −0.558, P = 0.0071) and 3 (r = −0.451, P = 0.0213) of the parkland agroforestry (Table ; Figs , and ). However, there is no relationship aboveground carbon stock with simpson’s index of diversity and shannon-weiner`s diversity indices in all communities of parkland agroforestry.
Table 3. Relationship between plant species diversity and carbon stock in three plant communities of parkland agroforestry of western zone of Tigray Northern Ethiopia for each of plant communities and result of Pearson correlation (at α = 0.05, significant difference)
Figure 5. Relationship between plant species diversity and the aboveground carbon stock of plant community 1
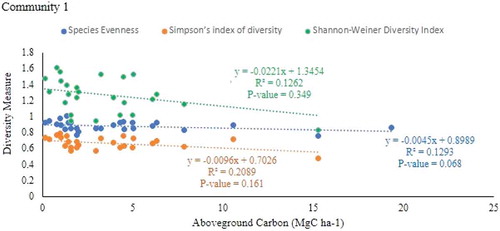
Figure 6. Relationship between plant species diversity and the aboveground carbon stock of plant community 2
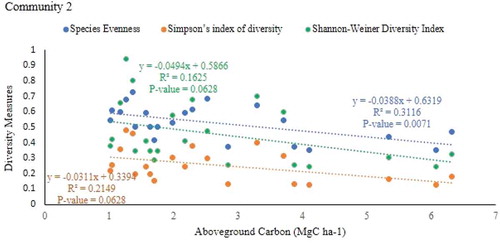
Figure 7. Relationship between plant species diversity and the aboveground carbon stock of plant community 3
There was a negative correlation between species evenness (r = −0.552, P = 0.00771), Simpson’s index of diversity (r = −0.646, P = 0.00116) and shannon`s diversity indices (r = −0.643, P = 0.0014) with total carbon stock in community 2 (Table ; Figures , and 1). However, there was no significant relationship between species evenness and simpson’s index of diversity and shannon-weiner`s diversity indices with total carbon stock in communities 1 and 3.
Figure 8. Relationship between plant species diversity and the total carbon stock of plant community 1
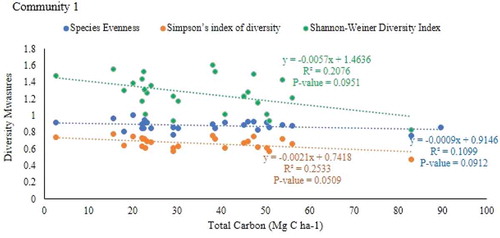
Figure 9. Relationship between plant species diversity and the total carbon stock of plant community 2
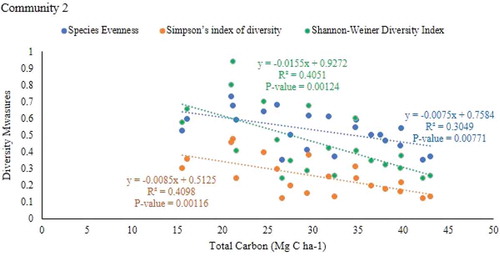
Figure 10. Relationship between plant species diversity and the total carbon stock of plant community 3
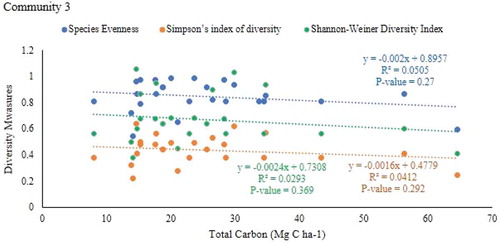
5. Discussions
5.1. Woody species diversity in parkland agroforestry
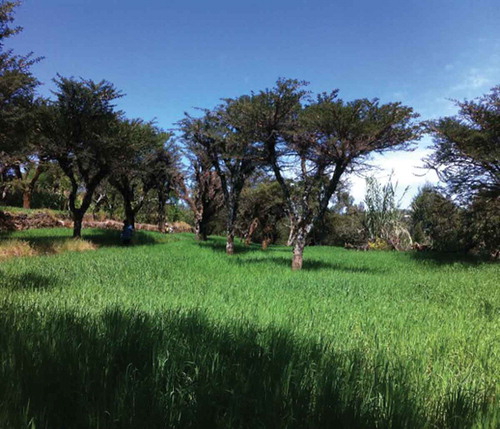
Retaining and planting of trees and/or shrubs in parkland agroforestry system was determined by the availability of the space, compatibility with agricultural crops and household objectives. Therefore, agroforestry parkland was found to be an important part of the land-use systems in terms of their species richness and diversity. The diversity measures varied from plant communities to plant communities of a parkland agroforestry system. It was found that plant community 1 (Cordia africana—Diospyros mespiliformis community type) shas the highest quantity of species richness, shannon-weiner diversity and simpson’s diversity index than the other plant communities in parkland agroforestry. Accordingly, the higher species richness and evenness at community 1 gave higher shannon-weiner and simpson’s diversity index when it is compared with that of community 2 and 3. This result is in line with Magurran (Citation2004) who reported, presence of greater evenness or greater richness or both in an area can result in increased shannon-weiner diversity. The variation in woody species richness, diversity and evenness along plant communities could be due to site characteristics, management strategy, socioeconomic factors (Abebe, Citation2005), and farmers’ preferences for tree species and functions in different localities (O’Neill et al., Citation2001). For example, farmers maintained many tree and/or shrub species for environmental services like soil and water conservation (O’Neill et al., Citation2001) and soil fertility amelioration and crop productivity (Verheij, Citation2003), through the support of microbial nitrogen fixation that can increase soil nitrogen availability (Rosenstock et al., Citation2014) and improve water quality (Schwab et al., Citation2015). The frequency of distribution of tree species on farms in the present study was variable. As one would expect, tree species with a greater economic or ecological value or both were found to be frequently distributed across the farms.
In the present study of the parkland agroforestry system, a mean woody species recorded was higher than reported Nikiema (Citation2005), by parkland agroforestry of semi-arid West Africa, Burkina Faso (1.05). Parkland agroforestry of the study area had a lower shannon diversity index as compared to the parklands in the region of semi-arid West Africa (H´ = 1.737) (Nikiema, Citation2005), Northern Togo (H´ = 4.53) (Folega et al., Citation2011). Consequently, these variations of species diversity among different areas could be associated with difference in species structure and composition of woody species i.e. due to variation in moisture availability, nutrient availability (Nuberg et al., Citation2009). In addition, species adaptability in different areas, farm characteristics (Kumar & Nair, Citation2004) and age of agroforestry practices can also determine the species diversity in this agroforestry practice. The parkland system is, therefore, contributing to the enrichment of woody species diversity in this area. Statements made by many authors that agricultural activities, especially the parkland system, can contribute to species diversity conservation are confirmed in this study (Atta-Krah et al., Citation2004; Boffa, Citation2000).
5.2. Carbon stock in parkland agroforestry
The C stock of vegetation biomass (AGC and BGC) was significantly different among the different plant communities of parkland agroforestry systems (p < 0.05) (Table ). The highest vegetation carbon (AGC and BGC) stock was recorded in plant community 1 (11.49 and 4.27 Mg C ha-1) followed by plant community 2 (6.71 and 2.66 Mg C ha-1). The least carbon stock was recorded in plant community 3 (5.17 and 2.06 Mg C ha-1). The results showed the positive effect of parkland agroforestry on carbon stores influenced by the size of trees. The highest vegetation (biomass) carbon stock was found in plant community 1 as compared to Plant communities 2 and 3. This highest biomass could be the result of higher tree density with relatively large sizes (Kuyah et al., Citation2014). In addition, the age of the trees, management practices, human and natural disturbances factors influence the aboveground and belowground carbon stored in an agroforestry system (Tilahun et al., Citation2015). However, the above-ground carbon stocks of the parkland agroforestry were found to be lower than those reported in southern Burkina Faso parkland agroforestry system (86.6 Mg C ha-1) by Dimobe et al. (Citation2018) and smallholder farming system of western Kenya (16 Mg C ha-1) by Henry et al. (Citation2009). Similarly, belowground carbon stock of the study was found lower than those reported in the West Africa Sahel parkland agroforestry system (Takimoto et al., Citation2008). The biomass (AGC + BGC) carbon stocks of the plant communities are within the range (4.5–19 Mg C ha-1) accounted for agroforestry systems in Sub-Saharan Africa (Unruh et al., Citation1993) and lower than the range (29–53 tons ha1) reported in humid tropics of Africa (Albrecht & Kandji, Citation2003). In general, the disproportionate distribution of biomass carbon stocks across the plant communities evaluated in this study is attributed to the heterogeneity of trees in terms of species diversity, stocking levels and more importantly, tree size.
The soil C stock potential of the plant communities in parkland agroforestry was not significantly different (p = 0.2278) (Table ). The highest soil C stock was recorded in plant community 2 (21.05 Mg C ha-1), while the least was recorded in plant community 3 (18.27 Mg C ha-1), indicating what proportion of organic matter resulting from the high dominant vegetation as observed from the vegetation C stock was similar. The soil carbon stock of the study sites was in line with the specified range for agroforestry soil C (13 to 300 Mg C ha-1) in Kumar and Nair (Citation2011) and Soil carbon (28.2 to 98.9 Mg C ha-1) traditional agroforestry land use of southern Ethiopia (Demessie et al., Citation2013). However, the soil carbon stocks of the study parkland agroforestry are lower than that reported SOC stocks for agroforestry systems in Central India to be 27 Mg ha-1 for the 0–60 cm soil layer (Swamy & Puri, Citation2005), The high SOC stocks in our agroforestry systems can be attributed to the high proportion of tree and shrubs in these systems.
The total carbon stock of the system (AGC + BGC + SOC) was significantly different across plant communities of parkland agroforestry (p = 2.115e-06). Overall, a higher density of the stand of the tree in the agroforestry system enhances the total (ecosystem) carbon stock. The trend of the total carbon stock shows that soil carbon stock contributed 65 percent than vegetation carbon stock (Figure ). This finding is in line with the result of Tesemma (Citation2013), where an average of about 66 percent of the soil carbon in traditional agroforestry systems of the southeastern Ethiopia.
5.3. Relationship between diversity and carbon stock
The diversity of trees is an important factor in regulating the forest ecosystem’s function and services. Our results show complex and highly variable relationship biomass (AGC) and total carbon (AGC + BGC + SOC) with species diversity measures within the plant community of parkland agroforestry of Northern Ethiopia. Some plots with high diversity had relatively low biomass, and some plots with low diversity had high biomass. The relationship between AGC and species evenness showed a significantly negative but weak relationship in plant communities 2 and 3 of the parkland agroforestry system. However, the relationship of shannon-weiner and simpson’s diversity index with AGC showed not significantly in all community types of a parkland agroforestry system. This finding was supported by the study done by Heather et al., (Citation2010) in subtropical Forest of Puerto Rico. The relationship between the diversity of trees with carbon stock might also be altered by a range of factors. One such factor could be due to land use management. In a natural forest, the climate, soil, and other factors could be more favorable to one species than others, resulting in higher productivity and biomass when one species is dominant. If the forest is planted and under active management, the results could be either. Moreover, management practices in land use also affect tree diversity.
Despite this variability, in our survey plots, there was a negative correlation evidence of aboveground C and total C with species diversity measures. The diversity of trees is important factor in regulating the ecosystem’s function and services. The relationship between TC and species evenness, shannon-weiner and simpson’s diversity index showed a significantly negative but weak relationship in plant community 2. The research was done by Karna (Citation2012) also stated that there is a weak relationship between carbon stock and biodiversity measures. The negative relationship of diversity measures with AGB obtained in this study was also reported by Szwagrzyk and Gazda (Citation2007), Suo et al., (Citation2008) and Zhang et al., (Citation2011). On the other hand, significant positive relationships between them were observed in dry tropical forests of Northern India (Sagar & Singh, Citation2006), deciduous forests of North America (Houle, Citation2007) and agro-ecosystems of in southwestern Uganda (Nakakaawa et al., Citation2010).
Thus, this difference may probably be explained by the confounding effects resulting from other variables such as tree height, density, size, age, and site production efficiency having a significant impact on carbon stock (Lei et al., Citation2009; Liang et al., Citation2007). A decline in diversity creates losses of species which in turn may have a number of undesirable consequences. Some of these consequences are changes in food webs with a negative effect on the ecosystem functions (Bengtsson, Citation1998). In addition to species biodiversity, carbon stocks are also affected by many other variables (factor), such as woody species composition, ages of trees, geographic location, climatic factors, management regimes and soil characteristics (Newaj et al., Citation2016). Plant species diversity has been observed to influence ecosystem carbon stock (Wang et al., Citation2011). Also, site quality in terms of productivity and stocking stand of the tree affects the growth and structural biodiversity (Lei et al., Citation2009; Liang et al., Citation2007). Hereafter, species biodiversity (i.e. Shannon and Simpson’s) is not only enough to describe the variations of carbon stock in parkland agroforestry because tree of diameter (DBH) and height distribution are a particular element for determining the structural diversity which has a significant effect on carbon stocks (Baishya et al., Citation2009; Lexerød & Eid, Citation2006).
6. Conclusions
The highest quantity of species richness, evenness, Shannon weiner and Simpson’s index of diversity was found in plant community 1 while they were lowest in species richness in plant community 3 and species evenness, Shannon Weiner and Simpson’s index of diversity in plant community 2. Plant community 1 had the highest vegetation and soil C, and plant community 3 had the least vegetation and soil C. There was a negative relationship between carbon stock (AGC and TC) and evenness, Shannon Weiner and Simpson’s index of diversity in a parkland agroforestry system. This study concludes that the parkland agroforestry systems have significantly improved the vegetation and soil C and forest carbon enhancement cannot assure biodiversity conservation and promotion in a parkland agroforestry system. The findings of this study suggest that the parkland agroforestry of Northern Ethiopia is important in storing carbon. However, it needs to be under-considered in optimizing both biodiversity and carbon stock in parkland agroforestry.
Declaration section
A. Ethics approval and consent to participate
● Not applicable
B. Consent for publication
● Not applicable
C. Availability of data and material
● Please contact the author for data requests
D. Funding
● The funders had no role in study design, data collection, and analysis, decision to publish, or preparation of the manuscript
E. Authors’ contributions
● YG designed the study. YG conducted the laboratory experiment. YG analyzed the data. YG and EM wrote the manuscript. All authors read and approved the final manuscript.
F. Acknowledgments
● The authors acknowledge the financial support from Tigray Agricultural Research Institute (Humera Agricultural Research Center).
G. Competing Interests
● The authors declare no competing financial interests.
Cover Image
Source:
Additional information
Funding
Notes on contributors
Yikunoamlak Gebrewahid
Yikunoamlak Gebrewahid working at Mekelle Agricultural Research Center, Tigray Agricultural Research Institute (TARI) since 2012 until know as Forestry and Agroforestry researcher, and Forestry and Agroforestry team leader under Natural Resources Research Core Process. I had Bsc in General Forestry from Wondogenet college of forestry and natural resources, Hawassa, Ethiopia and Msc in Dryland Agroforestry and land rehabilitation from Mekelle University, Mekelle, Ethiopia. I am in charge of providing research, training and consultancy for farmers, wood processors and exporters in Tigray for improving forest production and agroforestry quality. Moreover, I am conducting different researches in the area of Forest ecology, tree-crop-soil interaction, wood processing and suitable site selection for selected species.
References
- Abebe, T. (2005). Diversity in homegarden agroforestry systems of Southern Ethiopia (PhD dissertation). The Netherlands: Wageningen University.
- Albrecht, A., & Kandji, S. T. (2003). Carbon sequestration in tropical agroforestry systems. Agriculture, Ecosystems & Environment, 99, 15–19. doi:10.1016/S0167-8809(03)00138-5
- Atta-Krah, K., Kindt, R., Skilton, J., & Amaral, W. (2004). Managing biological and genetic diversity in tropical agroforestry. In New Vistas in Agroforestry (pp. 183–194). Springer. doi:10.1007/978-94-017-2424-1_13
- Baishya, R., Barik, S. K., & Upadhaya, K. (2009). Distribution pattern of aboveground biomass in natural and plantation forests of humid tropics in northeast India. Tropical Ecology, 50, 295.
- Begon, M., Townsend, C. R., & Harper, J. L. (2006). Ecology: From individuals to ecosystems. Hoboken Australia: Blackwell Publishers.
- Bein, E., Habte, B., Jaber, A., Birnie, A., & Tengnäs, B. (1996). Useful trees and shrubs in Eritrea: Identification, propagation and management for agricultural and pastoral communities. In Technical handbook (pp. 422). Nairobi, Kenya.
- Bekele-Tesemma, A., & Tengnäs, B. (2007). Useful trees and shrubs of Ethiopia: Identification, propagation, and management for 17 agroclimatic zones, RELMA in ICRAF Project. Eastern Africa Region: World Agroforestry Centre.
- Bengtsson, J. (1998). Which species? What kind of diversity? Which ecosystem function? Some problems in studies of relations between biodiversity and ecosystem function. Applied Soil Ecology, 10, 191–199. doi:10.1016/S0929-1393(98)00120-6
- Bishaw, B., & Abdelkadir, A. (2003). Agroforestry and community forestry for rehabilitation of degraded watersheds on the Ethiopian highlands. International Conference on African Development Archives(pp. 78). Addis Ababa, Ethiopia. Retrieved from https://scholarworks.wmich.edu/africancenter_icad_archive/78
- Boffa, J. M. 2000. West African agroforestry parklands: Keys to conservation and sustainable management. UNASYLVA-FAO. pp. 11–17.
- Bosworth, D., Birdsey, R., Joyce, L., & Millar, C. (2008). Climate change and the nation’s forests: Challenges and opportunities. Journal of Forestry, 106(4), 214–221.
- Bunker, D. E., Declerck, F., Bradford, J. C., Colwell, R. K., Perfecto, I., Phillips, O. L., … Naeem, S. (2005). Species loss and aboveground carbon storage in a tropical forest. Science, 310, 1029–1031. doi:10.1126/science.1117682
- Cavanaugh, K. C., Gosnell, J. S., Davis, S. L., Ahumada, J., Boundja, P., Clark, D. B., … Sheil, D. (2014). Carbon storage in tropical forests correlates with taxonomic diversity and functional dominance on a global scale. Global Ecology and Biogeography, 23(5), 563–573.
- Chisholm, R. A., Muller‐Landau, H. C., Abdul Rahman, K., Bebber, D. P., Bin, Y., Bohlman, S. A., … CAO, H. (2013). Scale‐dependent relationships between tree species richness and ecosystem function in forests. Journal of Ecology, 101(5), 1214–1224. doi:10.1111/1365-2745.12132
- Demessie, A., Singh, B. R., & Lal, R. (2013). Soil carbon and nitrogen stocks under chronosequence of farm and traditional agroforestry land uses in Gambo District, Southern Ethiopia. Nutrient Cycling in Agroecosystems, 95, 365–375.
- Dimobe, K., Tondoh, J. E., Weber, J. C., Bayala, J., Ouédraogo, K., & Greenough, K. (2018). Farmers’ preferred tree species and their potential carbon stocks in southern Burkina Faso: Implications for biocarbon initiatives. PloS One, 13, e0199488.
- FAO (Food for Agricultural Organization). (2005). Forests and Climate Change Working Paper 4 [Online]. Available from http://www.fao.org/forestry/11280-03f2112412b94f8ca5f9797c7558e9bc.pdf
- FAO (Food for Agricultural Organization). (2010). Global Forest Resource Assessment 2010. Rome: Food And Agriculture Organization Of The United Nations.
- FAO (Food for Agricultural Organization). (2015). Global Forest Resources Assessments. Food and Agriculture Organization of the United Nations. Rome, Italy.
- Folega, F., Gabriel, S., Zhang, C. Y., Hai, Z. X., Wala, K., Batawila, K., & Akpagana, K. (2011). Evaluation of agroforestry species in potential fallows of areas gazetted as protected areas in North-Togo. African Journal of Agricultural Research, 6, 2828–2834.
- Gebreegziabher, Z., Mekonnen, A., Kassie, M., & Köhlin, G. 2010. Household tree planting in Tigrai, northern Ethiopia: Tree species, purposes, and determinants.
- Gebrehiwot, K. (2004). Dryland agro-forestry strategy for Ethiopia. Paper presented at the dryland agroforestry workshope (pp.1–20). Mekelle, Tigray, Ethiopia, World Agroforestry Centre-ICRAF.
- Gebrewahid, Y., & Abrehe.(2019a). Biodiversity conservation through indigenous agricultural practices: Woody species composition, density and diversity along an altitudinal gradient of Northern Ethiopia. Cogent Food & Agriculture, 5(1), 1700744.
- Gebrewahid, Y., Gebre-Egziabhier, T. B., Teka, K., & Birhane, E. (2018). Carbon stock potential of scattered trees on farmland along an altitudinal gradient in Tigray, Northern Ethiopia. Ecological Processes, 7, 40.
- Gebrewahid, Y., Teka, K., Gebre-Egziabhier, T. B., Tewolde-Berhan, S., Birhane, E., Eyasu, G., & Meresa, E. J. E. P. (2019b). Dispersed trees on smallholder farms enhance soil fertility in semi-arid Ethiopia. Ecological Processes, 8(1). doi:10.1186/s13717-019-0190-8
- Grossman, R.B, & Reinsch, T.G. (2002). 2.1 bulk density and linear extensibility. Methods Of Soil Analysis: Part 4 Physical Methods, 5, 201-228.
- Hadgu, K. M., Kooistra, L., Rossing, W. A., & Van Bruggen, A. H. (2009). Assessing the effect of Faidherbia albida based land use systems on barley yield at field and regional scale in the highlands of Tigray, Northern Ethiopia. Food Security, 1, 337–350.
- Heather, D. V., Michael, R. W., Stephen, B. C., Ariel, E. L., & Frederick, N. S. (2010). Relationship between aboveground biomass and multiple measures of biodiversity in subtropical Forest of Puerto Rico. Biotropica, 42(3), 290–299.
- Henry, M., Tittonell, P., Manlay, R. J., Bernoux, M., Albrecht, A., & Vanlauwe, B. (2009). Biodiversity, carbon stocks and sequestration potential in aboveground biomass in smallholder farming systems of western Kenya. Agriculture, Ecosystems & Environment, 129, 238–252.
- Houle, G. (2007). Determinants of fine‐scale plant species richness in a deciduous forest of northeastern North America. Journal of Vegetation Science, 18, 345–354.
- Hunde, K. K. (2015). The role of Agroforestry system as strategy to adapt and mitigate climate change: A review with examples from Tropical and Temperate regions. Climatic Change, 1, 20–25.
- Jamnadass, R., Place, F., Torquebiau, E., Malézieux, E., Liyama, M., Sileshi, G., … Dawson, I. (2013). Agroforestry, food and nutritional security.
- Karna, Y. K. 2012. Mapping above ground carbon using world view satellite image and lidar data in relationship with tree diversity and forests [M.S. thesis]. University of Twente, Enschede, The Netherlands.
- Kassa, H., Gebrehiwet, K., & Yamoah, C. (2010). Balanites aegyptiaca, a potential tree for parkland agroforestry systems with sorghum in Northern Ethiopia. Journal of Soil Science and Environmental Management, 1, 107–114.
- Kiptot, E., Franzel, S., & Degrande, A. (2014). Gender, agroforestry and food security in Africa. Current Opinion in Environmental Sustainability, 6, 104–109.
- Kumar, B. M., & Nair, P. R. (2004). The enigma of tropical homegardens. Agroforestry Systems, 61, 135–152.
- Kumar, B. M., & Nair, P. R. (2011). Carbon sequestration potential of agroforestry systems: Opportunities and challenges. London/New York: Springer Dordrechat Heidelbery/Springer Science & Business Media.
- Kuyah, S., Dietz, J., Muthuri, C., Jamnadass, R., Mwangi, P., Coe, R., & Neufeldt, H. (2012a). Allometric equations for estimating biomass in agricultural landscapes: I. Aboveground biomass. Agriculture, Ecosystems & Environment, 158, 225–234.
- Kuyah, S., Dietz, J., Muthuri, C., Jamnadass, R., Mwangi, P., Coe, R., & Neufeldt, H. (2012b). Allometric equations for estimating biomass in agricultural landscapes: II. Belowground biomass. Agriculture, Ecosystems & Environment, 158, 225–234.
- Kuyah, S., Sileshi, G. W., Njoloma, J., Mng’omba, S., & Neufeldt, H. (2014). Estimating aboveground tree biomass in three different miombo woodlands and associated land use systems in Malawi. Biomass and Bioenergy, 66, 214–222.
- Lei, X., WANG, W., & PENG, C. (2009). Relationships between stand growth and structural diversity in spruce-dominated forests in New Brunswick, Canada. Canadian Journal of Forest Research, 39, 1835–1847.
- Lexerød, N. L., & Eid, T. (2006). An evaluation of different diameter diversity indices based on criteria related to forest management planning. Forest Ecology and Management, 222, 17–28.
- Liang, J., Buongiorno, J., Monserud, R. A., Kruger, E. L., & Zhou, M. (2007). Effects of diversity of tree species and size on forest basal area growth, recruitment, and mortality. Forest Ecology and Management, 243, 116–127.
- Loreau, M., Naeem, S., Inchausti, P., Bengtsson, J., Grime, J., Hector, A., … Schmid, B. (2001). Biodiversity and ecosystem functioning: Current knowledge and future challenges. science, 294, 804–808. doi:10.1126/science.1064088
- Magurran, A. (2004). Measuring Biological Diversity. England: Blackwell Pub.
- Matocha, J., Schroth, G., Hills, T., & HOLE, D. (2012). Integrating climate change adaptation and mitigation through agroforestry and ecosystem conservation. In Agroforestry-the future of global land use (pp. 105–126). Springer. doi:10.1007/978-94-007-4676-3_9
- Mbow, C., Smith, P., Skole, D., Duguma, L., & Bustamante, M. (2014). Achieving mitigation and adaptation to climate change through sustainable agroforestry practices in Africa. Current Opinion in Environmental Sustainability, 6, 8–14.
- Midgley, G. F., Bond, W. J., Kapos, V., Ravilious, C., Scharlemann, J. P., & Woodward, F. I. (2010). Terrestrial carbon stocks and biodiversity: Key knowledge gaps and some policy implications. Current Opinion in Environmental Sustainability, 2, 264–270.
- Nair, P. K. R, Nair, V, Gama-Rodrigues, E, Garcia, R, Haile, S, Howlett, D, & Tonucci, R. (2009). Soil Carbon in Agroforestry Systems: an Unexplored Treasure? Nature Precedings. doi: 10.1038/npre.2009.4061.1
- Nakakaawa, C., Aune, J., & Vedeld, P. (2010). Changes in carbon stocks and tree diversity in agro-ecosystems in south western Uganda: What role for carbon sequestration payments? New Forests, 40, 19–44.
- Negash, M., & Starr, M. (2015). Biomass and soil carbon stocks of indigenous agroforestry systems on the south-eastern Rift Valley escarpment, Ethiopia. Plant and Soil, 393(1–2), 95–107. doi:10.1007/s11104-015-2469-6
- Newaj, R., Chaturvedi, O., & Handa, A. (2016). Recent development in agroforestry research and its role in climate change adaptation and mitigation. Indian Journal of Agroforestry, 18, 1–9.
- Nikiema, A. (2005). Agroforestry parkland species diversity: Uses and management in semi-arid West-Africa (Burkina Faso). Agroforestry Systems, 60(1), 1–2. doi:10.1023/b:agfo.0000009399.14373.57
- Noble, I., Bolin, B., Ravindranath, N., Verardo, D., & Dokken, D. (2000). Land use, land use change, and forestry. Environmental Conservation, 28(3), 284–293. Cambridge, UK: Cambridge University Press, 200. doi:10.1017/s0376892901280308
- Nuberg, I., George, B., & Reid, R. (2009). Agroforestry for natural resource management. Australia: CSIRO publishing.
- O’Neill, G. A., Dawson, I., Sotelo-Montes, C., Guarino, L., Guariguata, M., Current, D., & Weber, J. C. (2001). Strategies for genetic conservation of trees in the Peruvian Amazon. Biodiversity & Conservation, 10, 837–850.
- Pearson, T., Walker, S., & BROWN, S. (2005). Sourcebook for land use, land-use change and forestry projects. p. 64. Washingiton, DC: Winrock International.
- Pearson, T. R., Brown, S. L., & Birdsey, R. A. (2007). Measurement guidelines for the sequestration of forest carbon. Gen. Tech. Rep. NRS-18. Newtown Square, PA: US Department of Agriculture, Forest Service, Northern Research Station. 42 p. 18. DOI:10.1094/PDIS-91-4-0467B
- Rahayu, S., Lusiana, B., & Van Noordwijk, M. (2005). Above ground carbon stock assessment for various land use systems in Nunukan, East Kalimantan. Carbon Stock Monitoring in Nunukan, East Kalimantan: A Spatial and Modelling Approach. PP. 21–34. SE Asia, Bogor, Indonesia: World Agroforestry Centre.
- Roberts, D. W., & ROBERTS, M. D. W. (2016). Package ‘labdsv’. Ordination and Multivariate.
- Rosenstock, T., Tully, K., arias-Navarro, C., Neufeldt, H., Butterbach-Bahl, K., & Verchot, L. (2014). Agroforestry with N2-fixing trees: Sustainable development’s friend or foe? Current Opinion in Environmental Sustainability, 6, 15–21. doi:10.1016/j.cosust.2013.09.001
- Roshetko, J. M., Delaney, M., Hairiah, K., & Purnomosidhi, P. (2002). Carbon stocks in Indonesian homegarden systems: Can smallholder systems be targeted for increased carbon storage?. American Journal of Alternative Agriculture, 17(3), 138–148. doi:10.1079/AJAA200116
- SAGAR, R., & Singh, J. (2006). Tree density, basal area and species diversity in a disturbed dry tropical forest of northern India: Implications for conservation. Environmental Conservation, 33, 256–262. doi:10.1017/S0376892906003237
- Sanchez, P. A., Buresh, R. J., & Leakey, R. R. (1997). Trees, soils, and food security. Philosophical Transactions of the Royal Society of London B: Biological Sciences, 352, 949–961. doi:10.1098/rstb.1997.0074
- Schwab, N., Schickhoff, U., & Fischer, E. (2015). Transition to agroforestry significantly improves soil quality: A case study in the central mid-hills of Nepal. Agriculture, Ecosystems & Environment, 205, 57–69. doi:10.1016/j.agee.2015.03.004
- Shannon, C., & Weaver, W. (1963). The measurement theory of communication. Urbana, IL: University of Illinois Press.
- Smith, J., Pearce, B. D., & Wolfe, M. S. (2013). Reconciling productivity with protection of the environment: Is temperate agroforestry the answer? Renewable Agriculture and Food Systems, 28, 80–92.
- Strassburg, B. B., Kelly, A., Balmford, A., Davies, R. G., Gibbs, H. K., Lovett, A., … Turner, R. K. (2010). Global congruence of carbon storage and biodiversity in terrestrial ecosystems. Conservation Letters, 3, 98–105. doi:10.1111/conl.2010.3.issue-2
- Suo, A.-N., Ju, T.-Z., & Ge, J.-P. (2008). Relationship between species richness and biomass on environmental gradient in natural forest communities on Mt. Xiaolongshan, northwest China. Forestry Studies in China, 10, 212–219. doi:10.1007/s11632-008-0041-7
- Swamy, S., & Puri, S. (2005). Biomass production and C-sequestration of Gmelina arborea in plantation and agroforestry system in India. Agroforestry Systems, 64, 181–195. doi:10.1007/s10457-004-1999-3
- Szwagrzyk, J., & Gazda, A. (2007). Above‐ground standing biomass and tree species diversity in natural stands of Central Europe. Journal of Vegetation Science, 18, 555–562.
- Takimoto, A., Nair, P. R., & Nair, V. D. (2008). Carbon stock and sequestration potential of traditional and improved agroforestry systems in the West African Sahel. Agriculture, Ecosystems & Environment, 125, 159–166.
- Talbot, J. 2010. Carbon and biodiversity relationships in tropical forests. Multiple Benefits Series, 4.
- Tesemma, M. N. 2013. The indigenous agroforestry systems of the south-eastern Rift Valley escarpment, Ethiopia: Their biodiversity, carbon stocks, and litterfall.
- Tilahun, G., Kebede, F., & HAFTU, S. (2015). Soil properties and carbon sequestration under desert date (Balanites aegyptiaca) in the lowlands of Northern Ethiopia. Journal of Soil Science and Environmental Management, 6, 215–224.
- Unruh, J., Houghton, R., & Lefebvre, P. (1993). Carbon storage in agroforestry: An estimate for sub-Saharan Africa. Climate Research, 3, 39–52. doi:10.3354/cr003039
- Vaast, P., & Somarriba, E. (2014). Trade-offs between crop intensification and ecosystem services: The role of agroforestry in cocoa cultivation. Agroforestry Systems, 88, 947–956.
- Van Con, T., Thang, N. T., Khiem, C. C., Quy, T. H., Lam, V. T., Van Do, T., & Sato, T. (2013). Relationship between aboveground biomass and measures of structure and species diversity in tropical forests of Vietnam. Forest Ecology and Management, 310, 213–218.
- Verheij, E. (2003). Agroforestry. p. 97. Wageningen, the Netherlands: Agromisa Foundation.
- WANG, W., LEI, X., MA, Z., KNEESHAW, D. D., & PENG, C. (2011). Positive relationship between aboveground carbon stocks and structural diversity in spruce-dominated forest stands in New Brunswick, Canada. Forest Science, 57, 506–515.
- Zhang, Y., Duan, B., Xian, J., Korpelainen, H., & LI, C. (2011). Links between plant diversity, carbon stocks and environmental factors along a successional gradient in a subalpine coniferous forest in Southwest China. Forest Ecology and Management, 262, 361–369.