
Abstract
A total of 241 mitochondrial genomes were assembled and annotated from the SRA database to reconstruct a mtDNA genome phylogeny for the genus Drosophila, the family Drosophilidae, and close relatives. The resulting mtDNA genome phylogeny is largely congruent with previous higher-level analyses of Drosophila species with the exception of the relationships between the melanogaster, montium, anannassae, saltans and obscura groups. Although relationships within these species groups are congruent between nuclear and mtDNA studies, the mtDNA genome phylogeny of the groups is different when compared to earlier studies. Monophyly of known species groups within the genus Drosophila are highly supported and, as in previous work, the genera Lordiphosa, Hirtodrosophila, Zaprionus and Scaptomya are all imbedded within the genus Drosophila. Incongruence and partitioned support analyses indicate that DNA sequences are better at resolving the phylogeny than their translated protein sequences. Such analyses also indicate that genes on the minus strand of the circular molecule (Lrrna, Srrna, ND4, ND4L and ND5) provide most of the support for the overall phylogenetic hypothesis.
Introduction
Few groups have had their phylogenetic relationships interrogated as extensively as the genus Drosophila and its relatives in the family Drosophilidae. A Flybase search with the keyword “phylogeny” in the title or abstract returns over 650 publications, some dating to the 1930s, and early phylogenetic hypotheses were proposed by Sturtevant (Citation1916, Citation1939; Sturtevant et al. Citation1942) and Throckmorton (Citation1966, Citation1975; Throckmorton et al. Citation1982). In spite of this continuing attention over the past 100+ years, there remains significant uncertainty about the relationships between Drosophila and other genera in the Drosophilidae, as well as among the major lineages (species groups, subgenera) within Drosophila.
Some genera are widely considered to be close relatives and have, at various times in the past, been to assigned to the Drosophilidae (either as subgenera or distinct genera), rendering Drosophila para- or polyphyletic (see Throckmorton Citation1975; Grimaldi Citation1990; O’Grady and DeSalle Citation2018, for reviews). For example, the consensus of systematics research over the past 60 years is that the Hawaiian members of the genus Drosophila and the genus Scaptomyza form a clade exclusive of the remainder of the genus Drosophila. This renders the genus and subgenus Drosophila paraphyletic with respect to Scaptomyza. This is not the only example of parts of Drosophila being closest relatives to taxa in another genus. Several genera, including Lordiphosa, Zaprionus, Samoaia, Scaptomyza, and Hirtodrosophila, are actually embedded within a largely polyphyletic Drosophila, rendering the genus Drosophila polyphyletic.
While the higher-level relationships within Drosophila and associated genera remain in flux, the monophyly and composition of the species groups in the genus Drosophila have been quite stable. These groups have been studied for decades using anatomy, polytene chromosomes, allozymes, immuno-distances and DNA sequences as sources of information. Most of the major species groups in Drosophila have been the focus of at least one phylogenetic study and several groups have had many distinct hypotheses of relationships from various types of character systems (Markow and O’Grady Citation2006; O’Grady and DeSalle Citation2018). Many species groups have become models for speciation, ecological adaptation, or other evolutionary phenomena, and phylogenetic studies have both facilitated these analyses and contributed to our understanding of evolution. The obscura species group, for instance, has been a model system for understanding the genetics of speciation and adaptive divergence since Dobzhansky began working on the group in the 1930s. The melanogaster species group, the clade containing the developmental genetic model system Drosophila melanogaster, has also been the target of detailed morphological and behavioral analyses.
A benefit to having a well-resolved and strongly supported phylogeny is that the “known” relationships can be used to test the efficiency and reliability of phylogenetic methods (Drosophila: Adams et al. Citation2000; Anopheles: Neafsey et al. Citation2015; Nematoda: Kumar et al. Citation2012). For a lineage to be considered a good phylogenetic paradigm that can be used to test models and patterns of evolution, several requirements must be met. First, the number of taxa in the group should be large and diverse to maximize the number of interesting evolutionary questions that can be addressed. Second, the backbone of relationships among taxa should also be known, and this information can only be derived from previous studies of morphology, cytology or behavior. Third, there must be a large number of characters that can be partitioned into different categories (i.e. morphological, DNA sequence, protein sequence, nuclear, mitochondrial, coding, noncoding, etc.). Finally, reliable dating for the evolution of the group is desirable in order to get some idea of the tempo of change in the group. Drosophila meets all of these requirements, and thanks to recent genome sequencing techniques that have expanded the reach of these studies the group continues to improve as a paradigm for phylogenetic analysis.
Here we use raw data from NCBI's SRA database to assemble more than 190 previously un-assembled mtDNA genomes. For this paper we generate a mtDNA genome phylogeny from these new assemblies. We also examined the utility of mtDNA sequence data in phylogenetic analysis by comparing our results with several other Drosophila studies. We report on the congruence of the phylogenetic hypotheses generated here using mtDNA genomes with those resulting from other approaches. We also comment on the robustness of mtDNA sequence characters across the Drosophila phylogeny. In doing so we point to some of the strengths and weaknesses of using mtDNA as a source of information about Drosophila phylogenetics.
Materials and methods
Sequences
All mtDNA genomes assembled in this study are listed in Supplementary Table S1. There were four basic ways we obtained the sequences for this study. First, about 40 of the genomes were present in the NIH Organelle Genome database (Supplementary Table S1). These were simply downloaded from the database. Second, the NCBI assembly database contains contigs that can be assembled into more contiguous sequences and then fully annotated. These contigs were mostly deposited by the authors of several recent large genome studies of drosophilid flies (Miller et al. Citation2018; Suvorov et al. Citation2022; Marcella et al. 2022; Kim et al. Citation2021; Mai et al. Citation2020; Mahajan et al. Citation2018; Bronski et al. Citation2020; Torosin et al. Citation2020; Rane et al. Citation2019; see Supplementary Table S2). Contigs containing mtDNA sequences were extracted and partially assembled using MitoZ (Meng et al. Citation2019) with final assembly in MitoS (Bernt et al. Citation2013). The initial assemblies relied on several methods of assembly and the quality of these draft mtDNA genomes was highly variable. Third, the assembly libraries were reassembled with a single assembly program (SPAdes v3.11.1; Bankevich et al. Citation2012). Assembly with this program appeared to be more consistent and complete than with other approaches (see Supplementary Tables S1 and S2). The fourth approach was to reassemble the SRA reads directly to the Drosophila melanogaster reference mtDNA genome (NC_024511.2) using Geneious software with the “map to reference” function; the genomes thus obtained were then annotated using MitoS (Bernt et al. Citation2013). The last approach ended up being the most efficient and accurate, so we repeated many of the previously assembled genome assemblies using the Geneious-MitoS approach. A few of the genomes assembled this final way were generated from RNA-Seq data, but the majority were from WGS SRA sequences (Supplementary Table S1). Assemblies and annotations in spread sheet format and annotated genes in NEXUS format can be found at http://purl.org/phylo/treebase/phylows/study/TB2:S30959, and full data files have been deposited in DRYAD (https://doi.org/10.5061/dryad.m0cfxpp9m).
Table 1. Taxonomic changes suggested from the results of the mtDNA genome phylogeny.
Phylogenetic methods
Tree building
We used IQTree to reconstruct ML phylogenies for the various data sets we analyze in this paper. MrBayes (Ronquist et al. Citation2012) was used to infer Bayesian phylogenies with posterior probabilities. PAUP was used for parsimony analyses. Model settings for ML and Bayes analysis were GTR + F + I + G4. Examination of best-fit models for each gene and the clusters of structural RNAs described below (Supplementary Table S1) indicated that F + I + G4 parameters were optimal. For the Bayes analysis, we ran one million generations with two chains at which point the chains converged at p < .05. We discarded 20% of the resulting trees as burn-in.
Incongruence measures
The incongruence length difference (ILD) was used to measure the incongruence between partitions for all pairwise comparisons of partitions. A cursory examination of the phylogenetic signal in single tRNA gene sequences demonstrated that the sequences were too short to adequately include as valid partitions. Instead, we grouped tRNA genes into “linkage” groups; grpPT (trnP, trnT), grpFES1NRA (trnF, trnE, trn S1, trnN, trnR, trnA). GrpWCY (trnW, trnC, trnY) and grp MQI (trnM, trnQ, trnI) based on their physical adjacency to each other. We also constructed a large “linkage” cluster partition of structural RNA genes consisting of trnL, trnV, srrna and lrrna (SrLrVL1). We were able to compare the incongruence of both nucleotide and amino acid partitions as we used parsimony as an optimality criterion. While we do not imply that parsimony is the preferred optimality criterion to infer molecular phylogenies, we use it here because it allows us to cross compare the relative signal of partitions with different character states. Comparison of the mtDNA genome results for internal topology of species groups to examine introgression was accomplished by creating subtrees for each of the species groups indicated to be involved in introgression by Suvorov et al. (Citation2022). Subtrees for the same species groups for the mtDNA genome dataset were also generated. The subtrees were compared using https://eti.pg.edu.pl/TreeCmp/WEB (Goluch et al. Citation2020) by generating unrooted metrics for Robinson-Foulds distance, PathDifference, matching split difference and UMAST (unrooted maximum agreement subtree distance). All of these metrics are relatively easy to interpret. To generate tanglegrams we constructed phylogenetic trees for the three previously published large datasets examined here – Suvorov et al. Citation2022 (S151), Van Der Linde et al. Citation2010 (KVL) and Finet et al. Citation2021 (DPG) – and for mtDNA genomes using only the species group level taxa - Hawaiian Drosophila (HD), Scaptomyza (Scz), virilis (vir), robusta (rob), repleta (rep), quinaria (qui), cardini (car), immigrans (imm), Zaprionus (Zap), montium (mont), melanogaster (mel) anannassae (ana), obscura (obs), saltans (salt), and Liodrosophila (Lio). The trees were then compared using TreeMap (Page Citation1995).
Congruence and nodal support measures
We used the partitioned Bremer (or branch) support (PBS) and partitioned likelihood support (PLS) to measure the support from the various partitions at nodes in the overall phylogenetic hypothesis. PBS and PLS were estimated using treeROT (Sorenson Citation1999). For this part of the study, we did two analyses; one on DNA sequence partitions and one on amino acid partitions.
Results
Incongruence length difference (ILD) and partitioned branch support (PBS)
We first compared the congruence of the different genes in the mtDNA genome with reference to phylogenetic signal. All of the DNA-based gene sequences were compared to one another, with subsequent comparisons among all amino acid-based sequences. Generation of ILDs for comparisons of DNA with protein partitions used parsimony. The results of the ILD tests are shown in Supplementary Figure. For the most part, the DNA-based genes are congruent with each other (sector I of Supplementary Figure S1), and the protein sequences of these genes (sector II of Supplementary Figure S1) are congruent with each other. The only sector with significant amounts of incongruence in the figure is when DNA gene sequences are compared to amino acid sequences of the genes (sector IV of Supplementary Figure S1). Concatenated groups of genes are in general congruent to individual genes DNA sequences, but generally incongruent to the individual gene amino acid sequences.
Another way to examine the congruence of the various partitions involves the use of partitioned branch support (PBS). We computed PBS for all nodes and all gene partitions for both the DNA-based and amino acid-based kinds of partitions. Supplementary Figure S2 shows profiles for PBS values for all of the nodes in the DNA (left) and protein trees. There is a startling amount of incongruence amongst the DNA-based partitions at nodes as evidenced by the large amount of red in the profiles regardless of whether the node in question is on the backbone of the tree or tip-ward (Supplementary Figure S2). In general, only four of the partitions consistently provide positive PBS – ND4, ND5, lrrna and srrna. It appears that whether the node is toward the root of the tree, or the tip it has little impact on this pattern. It is noteworthy to point out that the ATP genes (ATP6, ATP8) and the cytochrome oxidase genes (CO1, CO2, CO3 and COB) all show low or negative PBS support for the various nodes in the phylogeny. In fact, for those four partitions only 20% of the measures are positive. This result indicates fundamental disagreement of those genes (and the ATP genes) with the ND genes and the ribosomal and transfer RNAs and the overall phylogenetic hypothesis. It appears that the genes that provide positive PBS support at the DNA sequence level are on the negative strand of the molecule (ND4, ND4l, ND5, ND1, rrna’s). It will be of great interest to see if this pattern holds for other groups of organisms.
The discrepancy in these patterns of partitioned support is not based on models of evolution for the different partitions. In other words, the fact that we used a single model for the DNA sequence tree is not involved in the patterns of support we see in this analysis. Supplementary Table S2 shows the models that are best fit for each DNA sequenced-based partition and demonstrated that F + I + G4 is always a critical part of the overall model (model parameters we eventually used). The change model is what varies between TVM, TIM, TN and GTR, but these are fairly similar models for likelihood analysis.
mtDNA genome phylogeny
Results from ML and Bayes analyses were very similar, with only 15 nodes supported in the Bayesian analysis absent from the ML phylogeny. The majority of these are between closely related taxa with short branch lengths. We present the Bayesian topology and include support values for the ML phylogeny in . The full ML topology, as well as protein-based ML and Bayesian analyses, are presented in the Supplementary Figure S3. Support for most relationships inferred by mtDNA sequences in both ML and Bayesian analyses are strong. The lowest posterior probability (PP) in the Bayesian analyses was 0.90 and only 13 of the 237 nodes in the Bayesian phylogeny have PP less than 0.95 (). For the ML tree, only six out of 237 nodes had bootstrap metrics <0.7 and 25 out of 237 had bootstraps between 0.7 and 0.9 (Supplementary Figure S3). The protein-based Bayesian and ML trees had much lower general support with 60 nodes <0.7 for ML bootstrap and 50 nodes with posterior priors between 0.7 and 0.95 (Supplementary Figure S3).
Figure 1. (A) Phylogenetic relationships of Drosophilidae flies inferred from mtDNA genome information in Clade I. (B) Phylogenetic relationships of Drosophilidae flies from mtDNA sequences in Clade II. Posterior probabilities and ML bootstraps are given in the legend in the figures. See text for specific discussion of the relationships implied by these phylogenies.


Relationships among the earliest-branching drosophilid taxa were poorly resolved, possibly owing to poor taxon sampling and the constraints of using mtDNA sequences for divergences of 60–100 million years. While both the subfamily Steganinae and Drosophilindae are monophyletic, relationships among the early diverging lineages of Drosophilindae (Chymomyza, Scaptodrosophila, Colocasiomyia) are not well supported and in conflict between the ML and Bayesian analyses (). All analyses, regardless of whether they were DNA- or protein-based or inferred via ML or Bayesain methods, generated trees with two major clades of Drosophilinae (, Clade I and Clade II) with high support. Clade I () includes a number of taxa traditionally placed in the subgenus Sophophora (e.g. the willistoni, saltans, obscura, melanogaster, ananassae, and montium species groups), along with some members of the genus Lordiphosa that have previously been considered closely related to some members of Sophophora (Katoh et al. Citation2000; Gao et al. Citation2011). Interestingly, Clade I also included a single New World representative of the genus Hirtodrosophila, H. duncani. The inclusion of Lordiphosa and Hirtodrosophila as sister to the saltans-willistoni species groups renders the subgenus Sophophora, as well as the genus Drosophila, non-monophyletic ().
The melanogaster species group was last revised by Bock and Wheeler (Citation1972). Ashburner and Bergman (Citation2005) pointed out that this group has more than doubled in size since the early 1970s and a comprehensive revision was long overdue. Several authors (Schawaroch Citation2002) have examined relationships, either within Sophophora or specifically in the melanogaster species group, and some (e.g. Conner et al. Citation2021) have argued for dividing this group into at least three separate species groups (melanogaster, ananassae, montium). Taxodros, the authority on Drosophilidae taxonomy, lists the montium and melanogaster lineages as species groups, the ananassae lineage is a subgroup within the melanogaster species group. Our analyses place the melanogaster and montium species groups as sister to one another, with the ananassae lineage sister to a clade containing the melanogaster, montium, and setifemur species groups (). There is strong consensus, from our analyses and several others, for elevating the ananassae subgroup to species group status based on the monophyly, placement, and levels of support, as well as the impressive diversity this lineage represents (Conner et al. Citation2021).
Throckmorton (Citation1975) divided the genus Drosophila into a series of radiations (reviewed in O’Grady and DeSalle Citation2018). Clade II is a large, heterogeneous lineage containing elements of contains elements of the Hawaiian Drosophilidae, virilis-repleta, and immigrans-tripunctata radiations (). Drosophila busckii, a representative of the small subgenus Dorsilopha, is sister to all other taxa in Clade II (). A lineage including the genus Zaprionus and Drosophila quadrilineata, a member of the immigrans species group, are sister to the remainder of Clade II (). This placement of D. quadrilineata renders the immigrans species group paraphyletic, reinforcing evidence from previous studies that the immigrans species group is not form monophyletic (reviewed in O’Grady and DeSalle Citation2018). Three large lineages, each loosely representing the immigrans-tripunctata, virilis-repleta, and Hawaiian Drosophilidae radiations form the rest of Clade II (). The Hawaiian Drosophila and the genus Scaptomyza are sister taxa, as they have been in nearly all studies since the 1960s. This lineage is sister to a paraphyletic grade of 8 species groups placed in Throckmorton’s virilis-repleta species group (). Another 10 species groups, all but one of which were placed in Throckmorton’s immigrans-tripunctata radiation, form a monophyletic group that is sister to the virilis-repleta-Hawaiian Drosophilidae lineage ().
Discussion
Phylogenetic relationships in Drosophilidae
We compare our mtDNA genome study with three other large Drosophila phylogenies: Suvorov et al. (Citation2022) [S151], Van Der Linde et al. (Citation2010) [KVL], and Finet et al. (Citation2021) [DPG]. The mtDNA analysis and all three previous studies (Van Der Linde et al. Citation2010; Finet et al. Citation2021; Suvorov et al. Citation2022) are largely in agreement with the major relationships within Drosophilinae, with all recovering clades I and II (). Likewise, relationships between subgenera, species group and other major lineages were also similar between studies (). While relationships closer to the tips of the phylogeny were more difficult to assess because of different taxon sampling strategies, most of the major lineages were monophyletic. We selected 15 major groups (species groups and genera) for a more in-depth analysis and used a combination of posterior probability, bootstrap, and Robinson-Foulds distance measures to assess congruence between the studies.
compares our phylogeny with these other three studies, highlighting the fifteen major lineages (species groups or genera) that are common to all data sets. Supplementary Figures 4 and 5 explore the congruence of these lineages in more detail as is a summary of the information in these figures. The monophyly of 12/15 of these lineages is strongly supported (bootstrap = 100% bootstrap proportion, posterior probability = 1.0). The remaining 3 nodes are also well-supported (bootstrap proportion >90%, posterior probability >0.95). In contrast, the backbone of the mtDNA genome tree has only ∼1/2 of the nodes showing strong support (>90% bootstrap), suggesting that inference at this point in the phylogeny is difficult, as it has been in previous studies.
Figure 2. Support within the major species groups. The three major phylogenetic studies that we compared our results to are listed as S151 (Suvorov et al. Citation2022), KVL (Van Der Linde et al. Citation2010) and DRP (Finet et al. Citation2021). Several other phylogenetic studies listed in the text were examined (A = Russo et al. Citation1995; B = Roman et al. Citation2022; C = Mai et al. Citation2020; D = Izumitani et al. Citation2016; E = Conner et al. Citation2021). The columns in each profile represent from left to right the number of nodes within the group; Robinson-Foulds distance; path distance (PathD); match distance; and UMAST. Green = zero distance or value; light red/light green = medium distance or value (1.0 or 2.0); red = large distance greater than 3.0). See text for discussion of groups of flies in the boxes.
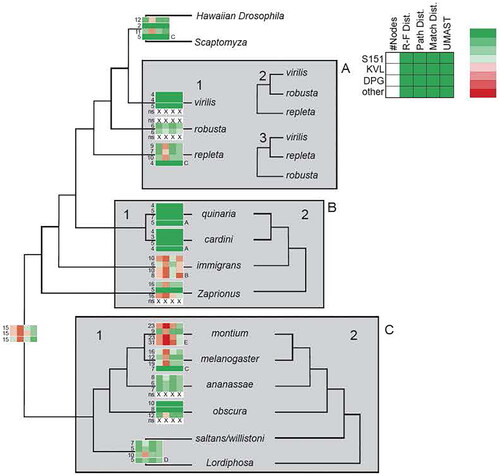
Three areas with significant differences between the studies are indicated in boxes A, B, and C. Box A refers to the virilis-repleta radiation of the subgenus Drosophila. There are three hypotheses of relationships for the virilis, robusta, and repleta species groups. Topology 1 (, Box A), supported by the current mtDNA genome analysis infers the virilis-repleta radiation as a paraphyletic grade, with the virilis, robusta, and repleta species groups as being successive sister taxa to the Hawaiian Drosophilidae lineage. Topologies 2 and 3 (Figure x) infer a monophyletic virilis-repleta radiation that is sister to the Hawaiian Drosophila plus Scaptomyza lineage. Topology 2 is supported in the KVL study (Van Der Linde et al. Citation2010) and shows the virilis and robusta species group as a clade, with the repleta group sister to them. Topology 3, supported by both the S151 and DRP studies (Finet et al. Citation2021; Suvorov et al. Citation2022), indicates that the virilis and repleta species groups form a clade, with the robusta group as their sister taxon.
Box B refers to the immigrans-tripunctata radiation, a lineage that also includes the genus Zaprionus. There are only two supported topologies here, one indicating the the immigrans-tripunctata radiation is monophyletic and another suggesting that it is a paraphyletic grade sister to the Hawaiian Drosophilidae plus virilis-repleta radiations. The latter topology is supported in the current mtDNA genome analysis, all the other studies support a monophyletic immigrans-tripunctata radiation.
Box C highlights differences in relationships within the subgenus Sophophora. Again, there is only a single difference between these four studies. The mtDNA genome analysis, S151 and DPG studies support some members of the genus Lordiphosa as being sister taxa to the saltans and willistoni species groups, rendering the traditional version of the subgenus Sophophora as paraphyletic with respect to Lordiphosa. The KVL study, in contrast, shows support for a monophyletic Sophophora, with Lordiphosa as the sister taxon to this subgenus.
In addition to the S151, KVL and DPG studies there are also several other Drosophila phylogenies at the level of the various species groups and the comparison of their topology with the current study is also shown in Supplementary Figure S4 (listed as A through E). This analysis suggests that of the 15 groups we examined the immigrans, montium and part of the melanogaster groups show more discrepancy than the other 12 groups. Some of the group topologies in the current study are also identical (solid green in the profiles in ) to the topologies in these other smaller studies (A through E; Russo et al. Citation1995; Roman et al. Citation2022; Mai et al. Citation2020; Izumitani et al. Citation2016; Conner et al. Citation2021). The internal topology for the montium and immigrans groups is the most discordant with the mtDNA genome topology as evidenced by the lack of dark green and large amount of light green and red in the profile for that group in .
Proposed Taxonomic changes
Based on our analyses and the consensus from a number of phylogenetic studies conducted over the years, we are proposing a number of taxonomic changes, summarized in . We have been conservative and only proposed alterations that strongly supported and reflect a near-unanimous consensus among studies examining relationships of Drosophila and allied genera. More aggressive changes have been proposed in the past (Van Der Linde et al. Citation2010 and Yassin, Citation2021), but we feel that further analyses with more extensive taxon sampling, coupled with thorough taxonomic revisions, will be required for a generic reclassification of Drosophilidae.
We are proposing that the concept of the subgenus Sophophora be revised to include some taxa initially described in the genus Lordiphosa. We are not suggesting synonymizing the entire genus Lordiphosa, however, since taxon sampling within this genus has not been extensive. Instead, we suggest that the monotypic clarofinis species group be synonymozed with the acuminata species group and this entire lineage be transferred to Sophophora as a species group. Three additional Lordiphosa species (magnipectinata, mommai, stackelbergi) not currently placed in any species group, yet showing clear affinity to the acuminata species group, will also be transferred to Sophophora as members of this species group ().
Summary
The phylogenetic analysis of mtDNA genome sequences results in a well-supported phylogeny that has broad congruence with the nuclear genome phylogeny and with other higher-level analyses of data for the genus Drosophila. Two major well-supported clades are found as in previous studies of the Drosophilidae (S155, KVL and DPG). As in previous analyses, the monophyletic genera Lordiphosa, Scaptomyza, Zaptionus and Hirtodrosophila are imbedded in the larger genus Drosophila. Other drosophilid genera like Scaptodrosophila, Chymomyza, Leucophenga, Phortica and Colocasiomyia branch off before the genus Drosophila group. In general species, group relationships are congruent in the present study with those in other Drosophila phylogenetic studies, except that Clade I has some topological differences amongst species groups. The within-species group relationships are in general also congruent with nuclear DNA phylogenies. A close examination of 30 instances of purported introgression (Suvorov et al. Citation2022) indicates that the majority of these cases (86%) do not show incongruence with a nuclear phylogeny for the same species. It also appears that specific regions of the mtDNA genome contribute large amounts of support for the overall topology relative to other gene regions. Partitioned analysis of the gene regions in the mtDNA genome indicates that genes on the minus strand of the circular genome (both L and S rRNA genes, ND4, ND4L and ND5) contribute much more support than other gene regions to the overall topology. This result also stands for comparison to COX1, the gene used in most DNA barcoding studies.
Drosophila_phylogeny_supplemental_file.docx
Download MS Word (5.2 MB)Disclosure statement
No potential conflict of interest was reported by the author(s).
Additional information
Funding
References
- Adams MD, Celniker SE, Holt RA, Evans CA, Gocayne JD, Amanatides PG, Scherer SE, Li PW, Hoskins RA, Galle RF, et al. 2000. The genome sequence of Drosophila melanogaster. Science. 287(5461): 2185–2195. doi: 10.1126/science.287.5461.2185.
- Ashburner M, Bergman CM. 2005. Drosophila melanogaster: a case study of a model genomic sequence and its consequences. Genome Res. 15(12):1661–1667. doi: 10.1101/gr.3726705.
- Bankevich A, Nurk S, Antipov D, Gurevich AA, Dvorkin M, Kulikov AS, Lesin VM, Nikolenko SI, Pham S, Prjibelski AD, et al. 2012. Spades: a new genome assembly algorithm and its applications to single-cell sequencing. J Comput Biol. 19(5):455–477. doi: 10.1089/cmb.2012.0021.
- Bernt M, Donath A, Jühling F, Externbrink F, Florentz C, Fritzsch G, Pütz J, Middendorf M, Stadler PF. 2013. MITOS: improved de novo metazoan mitochondrial genome annotation. Mol Phylogenet Evol. 69(2):313–319. doi: 10.1016/j.ympev.2012.08.023.
- Bock IR, Wheeler MR. 1972. The Drosophila melanogaster species group. Univ Texas Publ. 7213:1–102.
- Bronski MJ, Martinez CC, Weld HA, Eisen MB. 2020. Whole genome sequences of 23 species from the Drosophila montium species group (Diptera: drosophilidae): a resource for testing evolutionary hypotheses. G3 (Bethesda). 10(5):1443–1455. doi: 10.1534/g3.119.400959.
- Conner WR, Delaney EK, Bronski MJ, Ginsberg PS, Wheeler TB, Richardson KM, Peckenpaugh B, Kim KJ, Watada M, Hoffmann AA, et al. 2021. A phylogeny for the Drosophila montium species group: a model clade for comparative analyses. Mol Phylogenet Evol. 158:107061. doi: 10.1016/j.ympev.2020.107061.
- Finet C, Kassner VA, Carvalho AB, Chung H, Day JP, Day S, Delaney EK, De Ré FC, Dufour HD, Dupim E, et al. 2021. DrosoPhyla: resources for drosophilid phylogeny and systematics. Genome Biol Evol. 13(8):evab179. doi: 10.1093/gbe/evab179.
- Gao J-j, Hu Y-g, Toda MJ, Katoh T, Tamura K. 2011. Phylogenetic relationships between Sophophora and Lordiphosa, with proposition of a hypothesis on the vicariant divergences of tropical lineages between the Old and New Worlds in the family Drosophilidae. Mol Phylogenet Evol. 60(1):98–107. doi: 10.1016/j.ympev.2011.04.012.
- Goluch T, Bogdanowicz D, Giaro K. 2020. Visual TreeCmp: comprehensive comparison of phylogenetic trees on the web. Methods Ecol Evol. 11(4):494–499. doi: 10.1111/2041-210X.13358.
- Grimaldi DA. 1990. A phylogenetic, revised classification of genera in the Drosophilidae (Diptera). Bull Am Museum Natural Hist. 197:1–139.
- Izumitani HF, Kusaka Y, Koshikawa S, Toda MJ, Katoh T. 2016. Phylogeography of the subgenus Drosophila (Diptera: drosophilidae): evolutionary history of faunal divergence between the old and the new worlds. PLoS One. 11(7):e0160051. doi: 10.1371/journal.pone.0160051.
- Katoh T, Tamura K, Aotsuka T. 2000. Phylogenetic position of the subgenus Lordiphosa of the genus Drosophila (Diptera: drosophilidae) inferred from alcohol dehydrogenase (Adh) gene sequences. J Mol Evol. 51(2):122–130. doi: 10.1007/s002390010072.
- Kim BY, Wang JR, Miller DE, Barmina O, Delaney E, Thompson A, Comeault AA, Peede D, D'Agostino ERR, Pelaez J, et al. 2021. Highly contiguous assemblies of 101 drosophilid genomes. Elife. 10:e66405. doi: 10.7554/eLife.66405.
- Kumar S, Koutsovoulos G, Kaur G, Blaxter M. 2012. Toward 959 nematode genomes. Worm. 1(1):42–50. doi: 10.4161/worm.19046.
- Mahajan S, Wei KH-C, Nalley MJ, Gibilisco L, Bachtrog D. 2018. De novo assembly of a young Drosophila Y chromosome using single-molecule sequencing and chromatin conformation capture. PLoS Biol. 16(7):e2006348. doi: 10.1371/journal.pbio.2006348.
- Mai D, Nalley MJ, Bachtrog D. 2020. Patterns of genomic differentiation in the Drosophila nasuta species complex. Mol Biol Evol. 37(1):208–220. doi: 10.1093/molbev/msz215.
- Marchetti M, Piacentini L, Berloco MF, Casale AM, Cappucci U, Pimpinelli S, Fanti L. 2022. Cytological heterogeneity of heterochromatin among 10 sequenced Drosophila species. Genetics. 222(2):1–14. doi: 10.1093/genetics/iyac119.
- Markow TA, O’Grady PM. 2006. Phylogenetic relationships of Drosophilidae. In: Markow TA, O’Grady PM, editors. Drosophila: a guide to species identification and use. London: Academic Press, p. 3–64.
- Meng G, Li Y, Yang C, Liu S. 2019. MitoZ: a toolkit for animal mitochondrial genome assembly, annotation and visualization. Nucleic Acids Res. 47(11):e63–e63. doi: 10.1093/nar/gkz173.
- Miller DE, Staber C, Zeitlinger J, Hawley RS. 2018. Highly contiguous genome assemblies of 15 Drosophila species generated using nanopore sequencing. G3 (Bethesda). 8(10):3131–3141. doi: 10.1534/g3.118.200160.
- Neafsey DE, Waterhouse RM, Abai MR, Aganezov SS, Alekseyev MA, Allen JE, Amon J, Arcà B, Arensburger P, Artemov G, et al. 2015. Highly evolvable malaria vectors: the genomes of 16 Anopheles mosquitoes. Science. 347(6217):1258522. doi: 10.1126/science.1258522.
- O’Grady PM, DeSalle R. 2018. Phylogeny of the genus Drosophila. Genetics 209(1):1–25.
- Page RD. 1995. TreeMap 1.0. Program and User’s Manual. Division of Environmental and Evolutionary Biology, Institute of Biomedical and Life Sciences. Glasgow, UK: University of Glasgow.
- Rane RV, Pearce SL, Li F, Coppin C, Schiffer M, Shirriffs J, Sgrò CM, Griffin PC, Zhang G, Lee SF, et al. 2019. Genomic changes associated with adaptation to arid environments in cactophilic Drosophila species. BMC Genomics. 20(1):52. doi: 10.1186/s12864-018-5413-3.
- Roman BE, Santana DJ, Prediger C, Madi-Ravazzi L. 2022. Phylogeny of Drosophila saltans group (Diptera: drosophilidae) based on morphological and molecular evidence. PLoS One. 17(4):e0266710. doi: 10.1371/journal.pone.0266710.
- Ronquist F, Teslenko M, Van Der Mark P, Ayres DL, Darling A, Höhna S, Larget B, Liu L, Suchard MA, Huelsenbeck JP. 2012. MrBayes 3.2: efficient Bayesian phylogenetic inference and model choice across a large model space. Syst Biol. 61(3):539–542. doi: 10.1093/sysbio/sys029.
- Russo CA, Takezaki N, Nei M. 1995. Molecular phylogeny and divergence times of drosophilid species. Mol Biol Evol. 12(3):391–404.
- Schawaroch V. 2002. Phylogeny of a paradigm lineage: the Drosophila melanogaster species group (Diptera: drosophilidae). Biol J Linnean Soc. 76(1):21–37. doi: 10.1111/j.1095-8312.2002.tb01711.x.
- Sorenson MD. 1999. TreeRot, version 2. Boston, MA: Boston University.
- Sturtevant AH. 1916. Notes on North American Drosophilidae with descriptions of twenty-three new species. Ann Entomol Soc Am. 9(4):323–343. doi: 10.1093/aesa/9.4.323.
- Sturtevant AH. 1939. On the subdivision of the genus Drosophila. Proc Natl Acad Sci U S A. 25(3):137–141. doi: 10.1073/pnas.25.3.137.
- Sturtevant AH, Spencer WP, Patterson JT, Wheeler MR. 1942. Classification of the genus Drosophila. Austin: University of Texas Press. p. 1–101.
- Suvorov A, Kim BY, Wang J, Armstrong EE, Peede D, D'Agostino ERR, Price DK, Waddell P, Lang M, Courtier-Orgogozo V, et al. 2022. Widespread introgression across a phylogeny of 155 Drosophila genomes. Curr Biol. 32(1):111–123.e5. doi: 10.1016/j.cub.2021.10.052.
- Throckmorton LH. 1966. The relationships of the endemic Hawaiian Drosophilidae. Univ Texas Publ. 6615:335–396.
- Throckmorton LH. 1975. The phylogeny, ecology and geography of Drosophila. Handb Genetics. 3(17):422–469.
- Throckmorton LH, Ashburner M, Carson HL, Thompson JN. 1982. The genetics and biology of Drosophila. Vol. 3b New York: Academic Press.[Google Scholar]
- Torosin NS, Anand A, Rao Golla T, Cao W, Ellison CE. 2020. 3D genome evolution and reorganization in the Drosophila melanogaster species group. PLoS Genet. 16(12):e1009229. doi: 10.1371/journal.pgen.1009229.
- Van Der Linde KIM, Houle D, Spicer GS, Steppan SJ. 2010. A supermatrix-based molecular phylogeny of the family Drosophilidae. Genet Res (Camb). 92(1):25–38. doi: 10.1017/S001667231000008X.
- Yassin A. 2021. Systematics in the (Post) genomic era: a look at the drosophila model. System Explor Life. 61–78.