
ABSTRACT
Football teams usually adopt different offensive playing styles to increase the probability of success. However, the strategy adopted can influence match-running performance. This study aimed to verify the relationship between the key indicators of offensive performance and match running performance in FIFA Women´s World Cup 2023 (2023-WC). Thirteen key offensive performance indicators were collected from 64 matches (from 32 national teams) with a multi-camera optical tracking system (TRACAB Gen5, ChyronHego). Possession, line breaks completed, receptions in the final third and ball progressions were negatively related to distance covered. On the other hand, goals, total passes, and defensive line breaks were positively associated. K-means cluster analysis indicates that the team that outperformed the above variables was the one that was successful in the 2023-WC. Therefore, the superior performance of some variables, such as ball possession and progression, may prevent athletes from covering greater distances. Teams that make larger pass exchanges and make more breaks in defensive lines may be asked to run more. There are specific key offensive indicators that are related to match running performance. This information can be useful for coaches in choosing the strategy adopted.
1. Introduction
Football prevails as the most popular sport on the planet, and although it is mostly dominated by men, over the last few years, several economic and political changes have led to the emergence of women’s football (Culvin, Citation2021). Even so, research remains scarce, contrary to what happens in men’s football, which has been widely studied in different areas.
In women’s football, technical performance (Kubayi & Larkin, Citation2020; Maneiro et al., Citation2020, Citation2021) and running performance (Teixeira et al., Citation2021, Citation2022) indicators are usually investigated separately, and to the best of our knowledge, no study has investigated the relationship between running and technical performance in women’s football and national team competitions (e.g. FIFA Women’s World Cup). For instance, in male soccer players, there seems to be a positive relationship between physical performance indicators (i.e. total distance covered, running at different intensities) and offensive playing style (Modric et al., Citation2019, Citation2021; Plakias, Moustakidis et al., Citation2023a). Knowing which offensive technical variables influence positively or negatively running performance is important because men’s football position-specific performance (Modric et al., Citation2019) and team success (Aquino et al., Citation2021) also correlate positively with total running and high-intensity running. More importantly, by knowing which technical or tactical variable influences running performance, the coach can make the right choice according to their team’s fitness. Also, the physical training can be tailored to meet the technical and tactical demands. For instance, in men’s football adopting high ball possession demands more running distance (Wang et al., Citation2022). Regarding technical performance indicators, such as the tactical variable percentage of ball possession can characterise the team playing style during the phase of play with ball possession (Hewitt et al., Citation2016; Plakias, Moustakidis et al., Citation2023a). There are no studies regarding the playing style of Women’s football. In men’s football, the most consistent team throughout the season (team success) adopted the playing style with a high percentage of ball possession (Gollan et al., Citation2018; Plakias, Kokkotis, et al., Citation2023; Plakias, Moustakidis, et al., Citation2023a). Also, the successful behaviour in playing style with a high percentage of ball possession was associated with other technical and tactical variables such as movement (team expansion) to dominate field areas, to receive passes to breaking defensive lines, has already been identified (Marcelino et al., Citation2020; Merlin et al., Citation2020; Passos et al., Citation2020; Zani et al., Citation2021). On the other hand, the play style with a lower percentage of ball possession, such as direct play (i.e. behaviour that prioritises corner and free kicks (Hewitt et al., Citation2016)) or set pieces (i.e. behaviour that prioritises set pieces (Hewitt et al., Citation2016)) is associated with unsuccessful teams in national leagues (Gollan et al., Citation2018). The literature reported that the highest frequency in goal scoring opportunities is led by established offensive play (which requires a high degree of ball possession and passes volume, density, and accuracy (Hewitt et al., Citation2016)) (44%), followed by set pieces (35.6%) and counterattacks (20.3%) (Yiannakos & Armatas, Citation2006). Therefore, studies investigating the association of technical and physical performance could provide insightful information for coaches and trainers to build competitive teams for WC.
As mentioned above, previous evidence emphasises the importance of playing style in measuring physical (i.e. match-running performance) and technical (i.e. ball possession) performance indicators. In this regard, there is a clear absence of literature investigating how strategies and tactics influence the outcome of the game and classification in competitions in Women’s World Cup Soccer. Football teams usually adopt different defensive and offensive playing styles to increase the probability of success. To verify the success or failure of the playing style adopted, performance indicators are analysed (i.e. a selection of variables that attempt to define technical aspects of performance) and can be associated with offensive and defensive tactics (Herold et al., Citation2021; Modric et al., Citation2019; Plakias, Moustakidis et al., Citation2023a).
Furthermore, although the literature on men’s football indicates a relationship between the indicators, it is unknown whether the pattern is maintained in women’s football. Understanding the impact that the playing style adopted offensively has on physical, technical performance and the team’s own success in the competition can provide useful information for coaches when planning short-term competitions that have specific requests due to their specificity (Branquinho et al., Citation2023).
Therefore, the main objective of this study was to investigate the relationship between the determining variables of the offensive process and the match-running performance indicators in the national teams that participated in the FIFA Women’s World Cup 2022 (2023-WC).
2. Methods
2.1. Experimental approach to the problem
This is an observational and exploratory study of the 9th edition of Women 2023-WC. Data related to the 64 matches were collected and provided by FIFA (<https://www.fifatrainingcentre.com/en/game/tournaments/fifa-womens-world-cup/2023/match-report-hub/post-match-summary-reports.php>). Data was collected by FIFA using a multi-camera optical tracking system (TRACAB Gen5, ChyronHego). The validity and accuracy of data collection by TRACAB Gen5 were provided by FIFA (FIFA, Citation2022) and Linke et al (Linke et al., Citation2020).
2.2. Subjects
The sample consisted of the 32 national teams that competed in the 2023-WC. The 2023-WC resulted in 64 games and produced a total of 128 distinct datasets (1 per team in each game played). Of these 128 data, eight data were excluded because they were from games with extra time. Also, 10 data were excluded from matches with red cards. Thus, we used 110 data from 55 games). The teams played from 3 to 7 games, depending on the team’s performance in the competition. In each game, a total of 12 variables related to the game were extracted ().
Table 1. Variable descriptions.
2.3. Procedures
2.3.1. Independent variables
presents 12 variables (except total distance and high-speed distance covered) which were extracted as offensive variables. also describes the concepts and the theoretical foundation of all respective variables.
2.3.2. Dependent and contextual variables
Total distance and high-speed distance covered during matches were extracted as dependent variables. Also, as a contextual variable, the team success in the 2023-WC was classified in quartile according to their respective 2023-WC final classification (eight teams with their respective performance cases).
3. Statistical analysis
Data are presented as mean and standard deviation (SD) (or when indicated confidence interval (CI) 95%). To identify if the offensive variables affect running distance, we used the mixed linear model fit for total running distance and high-intensity running distance as dependent variables. As covariable, we inserted variables related to offensive actions. As data from the same team was used several times, the team identification was used as random effects (intercept model). The significant variable which affects running performance identified in the mixed linear model was used to create decision tree regression (DTR). The DTR model was created to establish the amount of action that could explain the match running performance. The DTR model was done (using CHAID method spontaneous growth). The nodes (leaves) of the DTR were pruned to compare at least 20 samples in each node. The 12 FIFA variables from offensive variables (described in ) and match running performance were standardised to z-scores, and K-means cluster analysis was employed to identify possible patterns. We explore K-means clustering to identify the most meaningful cluster solution (between two and five clusters). After data visualisation in the hierarchical Cluster, three clusters were identified as the best solution. Differences between Clusters were verified with ANOVA one-way, followed by Ducan post-hoc test. After cluster creation, we use chi-square analysis to identify the association between clusters with 2023-WC final ranking. All analyses were performed using the statistical package IBM SPSS Statistics v.26.0. Significance was set at ≤0.05.
4. Results
describes the offensive variables and running match distance. The minimum and maximum values from the offensive variables indicate a substantial variation between performances. For instance, some teams have zero attempts, while others have 46 attempts – also, possession ranges from 18.80% to 68.20%, indicating a marked difference between teams’ performance.
Table 2. Offensive variables and running match distance from 110 cases of performance of the 2023 FIFA Women’s World Cup.
In , we investigate the relationship between offensive variables and the distance covered by the teams. Possession, Completed Line Breaks, Receptions in the Final Third, and Ball Progressions were correlated negatively correlated to running distance. In contrast, Goals, Total passes, and Defensive Line Breaks were correlated positively.
Table 3. Mixed linear model from offensive variables and team total distance covered (km).
In , we investigate the most important variables in the team’s total distance covered (Km). In node 2, it is demonstrated that teams that executed >413 passes covered a greater distance when compared to performance cases that executed ≤413 passes (nodule 1). However, in teams that executed ≤413 passes and had ≤37,8% of ball possession (node 3), the distance covered is significantly greater than in teams that had >37,8% of ball possession (node 4). These results indicate that the total passes associated with ball possession play a significant role in the team’s total running distance. The decision tree can explain 20% of the variation in the Total Distance covered.
Figure 1. Decision tree from running distance covered (km) and offensive variables. Risk estimates = 25.28 ± 3.34 (SE).
In , Completed Line Breaks were related negatively to high-speed distance. At the same time, Defensive Line Breaks, Receptions in the Final Third, and Second Balls were associated positively.
Table 4. Mixed linear model from offensive variables and team high-speed distance covered.
In , it is shown that teams that executed >4 defensive line breaks ran a greater distance at high speed when compared to performance cases that executed ≤4 defensive line breaks. The decision tree can explain 11% of the variation in High-Speed Distance covered.
Figure 2. Decision tree from high-speed running distance covered (km) and offensive variables. Risk estimates = 0.32 ± 0.04 (SE).
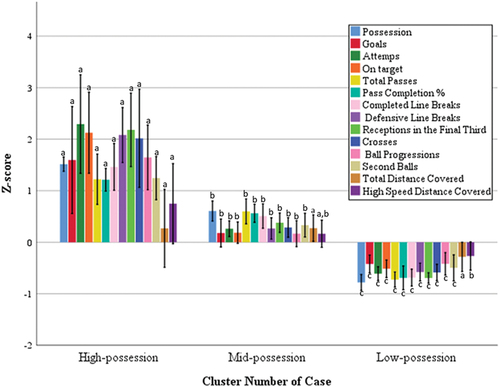
uses the k-means clusters approach to identify performance patterns from offensive variables and running distance. The best solution was the creation of three clusters. Cluster of high-possession has nine performance cases, while Cluster of mid-possession and low-possession has 47 and 54 performance cases, respectively. Total distance was not different between Cluster. The High-Speed Distance covered was different between Clusters of high-possession and low-possession.
Figure 3. Clusters of offensive variables and running distance different letters represent statistical differences between clusters.
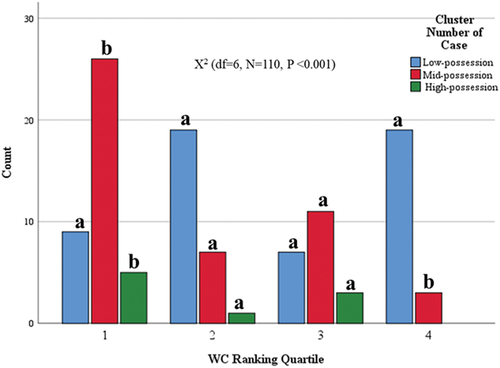
After creating the clusters, we sought to identify whether there is a significant association between the three clusters and the team’s success in the 2023-WC. Thus, in , it is identified that teams among the top eight placed in the 2023-WC perform most Cluster of mid or high-possession when compared to quartiles two, three, and four. The last eight teams were classified in the 2023-WC performer Cluster of low possession, and the Cluster of high possession is absent.
Figure 4. Clusters association with 2023-WC final classification. Different letters for the same cluster represent statistical differences for the z-test with Bonferroni correction.
5. Discussion
The aim of this study was to investigate the relationship between the determining variables of the offensive process and the match-running performance indicators in the national teams that participated in the FIFA Women’s World Cup. Our main finding was identifying that Possession, Completed Line Breaks, Receptions in the Final Third, and Ball Progressions were related negatively to running distance. In contrast, Goals, Total passes, and Defensive Line Breaks were associated positively. Most importantly, our k-means cluster analysis indicates that the team that outperformed the above variables was those who had success in the 2023-WC. Therefore, the outperformance of some variables, such as ball possession and progression, completed line breaks, and receptions in the final third can prevent athletes from running greater distances. However, performance with large passes exchange, breaks defensive lines might demand more running from athletes. This study is a pioneer in analysing the association between technical and physical variables in women’s football players, specifically in the FIFA Women’s WC final phase.
More specifically, when we tried to establish the most important variables in the team’s total distance covered, total passes and ball possession entered into the model. Thus, the national teams with more than 413 passes covered a greater distance when compared to performance cases with ≤413 passes and performance with ≤413 passes associated with >37,8% of ball possession. This data suggests that in women’s football, making ball possession >37,8% when the team has a lower rate of pass exchange will save athletes from running greater distances.
Our data from the mixed linear model indicate that possession may significantly impact in team running distance (decreasing it); however, high-possession and greater running intensity and volume were associated with success in the 2023-WC (see ). Previous research has also investigated ball possession variables in the final stages of the women’s WC (Kubayi & Larkin, Citation2020; Maneiro et al., Citation2020, Citation2021). Maneiro et al. (Citation2021) examined 52 matches in the Women’s 2015-WC, analysing 3,740 ball possessions. It found a notable link between possession success and failure, particularly when possessions were offensive, aimed at advancing towards the opponent’s goal, had a reduced number of passes, and took place in the second half of games. As well, the study of Kubayi and Larkin (Citation2020) compared technical performance metrics between winning and losing teams in Women’s 2015-WC matches, demonstrating that the results revealed that winning teams outperformed losing teams in various technical aspects such as total passes, passing accuracy, ball possession, shots, shots on target, aerial challenges, ball recovery patterns, and set piece indicators. Losing teams had higher numbers of tackles, more instances of ball loss, and received more yellow cards compared to winning teams. Otherwise, unsuccessful teams have fewer ball possessions when they are winning and mainly possess the ball when they are losing (Maneiro et al., Citation2020).
The mixed linear model demonstrated that Completed Line Breaks were related negatively to high-speed distance. At the same time, Attempts on Target, Defensive Line Breaks, Receptions in the Final Third, and Second Balls were associated positively. Our decision tree regression showed that Defensive Line Breaks were the most important variable, explaining 11% of the high-speed distance variation. Thus, the teams that executed more than 4 Defensive Line Breaks will run more at high-speed when compared to performance cases that executed ≤ 4 actions. Maneiro et al. (Citation2020) also applied the logistic regression and decision tree and affirmed the model’s significance and effectiveness in explaining team successes in the women’s WC. In this study, it was found that successful teams spend more time keeping the ball in their offensive zone and completing a greater number of passes in it, which might significantly impact the number of defensive line breaks. Recent studies from men’s 2022-WC show that Defensive Line Breaks are higher in winning teams (when compared to losing teams) and are positively correlated with goals (Praça et al., Citation2023; Wei et al., Citation2023). In our cluster analysis model, outperforming Defensive Line Breaks is linked to team success in the 2023-WC. Therefore, successful teams in the cup executed significantly more Defensive Line Breaks and ran longer distances at high speeds.
The High-Speed Distance covered was significantly higher in the high-possession cluster when compared to the lower-possession cluster. The high-possession cluster outperforms all offensive variables when compared to the other two clusters. Thus, indicating that the High-Speed Distance covered might significantly impact the performance of offensive variables (or vice versa). A previous study (Redwood‐Brown et al., Citation2018), with a large sample of the premier league, identified several factors that significantly impact the High-Speed Distance covered. For instance, High-Speed Distance covered was negatively correlated with opposition ability; High-Speed Distance covered is higher when the goals difference is closed (e.g.-1 ± 1) and lower when the team is losing or gaining with a large goal difference (e.g. goal difference −3 ± 3), indicating that psychological factor that might favour winning teams run more high-speed; the time spent in the final third was also associate with greater distance at high speed (Redwood‐Brown et al., Citation2018). On the other hand, other contextual factors influence the High-Speed Distance covered, such as tactical formation (e.g. running speed is higher in three defenders’ formation when compared to four defenders) (Modric et al., Citation2020), match avenue (Redwood‐Brown et al., Citation2018), player performance (Modric et al., Citation2019) and time spent in the attack phase for mostly of player position (Modric et al., Citation2021). Our cluster analysis is in accordance with the literature, whereas the High-Speed Distance covered was associated with the outperformance of several offensive variables analysed in this study. We speculate that teams in the low-possession cluster spent their time defended, thus significantly decreasing the actions of High-Speed.
Our research also demonstrated that the minimum and maximum values from the offensive variables indicate a substantial variation between performances. This indicates that the total passes associated with ball progression play a significant role in the team’s total running distance. For instance, some performances have zero attempts, while others have 46 attempts – also, possession ranges from 18.80% to 68.20%, indicating a marked difference between teams’ performance. In this context, match-related contextual factors should be considered that can influence technical and physical performance (Teixeira et al., Citation2021, Citation2022). Future analyses should analyse the mediating effect of these variables, considering the average value of offensive and defensive actions: (1) average goals scored per match, around 2.5 to 3 goals per match; (2) approximately 50% to 55% for each team with round 5 to 6 shots on target per team per match; (3) typically 80% to 85% average passing accuracy; (4) about 15 to 20 successful dribbles per match; (5) around 30 to 40 combined tackles and interceptions per team per match; (6) approximately 10 to 15 fouls per team per match; (7) about 3 to 5 offside per team per match; (8) around 5 to 6 corners per team per match; (9) approximately 3 to 4 saves per match by the goalkeeper.
The three clusters identified in this study are markedly different in performance from each other and are according to the performance profiles of successful and unsuccessful teams. For instance, the literature shows that successful teams possess the ball more when they are winning, maintain longer periods of possession in their offensive zone and complete a higher number of passes in that zone (Kubayi & Larkin, Citation2020). Clustering analysis can identify different patterns of ball possession, such as prolonged possession, quick transitions, defensive-minded possession, and more (Okholm Kryger et al., Citation2022). These patterns can help understand how teams control and utilise possession during matches to categorise players or teams based on their efficiency in utilising possession. This could include identifying clusters of players or teams that convert possession into shots on goal effectively or those who maintain possession without creating significant scoring opportunities (Casal et al., Citation2017; Pedersen et al., Citation2019).
A direct analysis between Men’s and Women’s football WC has not yet been carried out, but there is data in the literature comparing other competitions (Clemente et al., Citation2013; Kubayi, Citation2020; Silva et al., Citation2017). In contrast to their female counterparts, male central midfielders and players in certain positions, such as fullbacks and wide midfielders, covered more distances at various speed thresholds (Bradley et al., Citation2014). For Mujika et al. (Citation2009), sex differences were more evident in endurance than in anaerobic performance in female players. These results show major fitness differences by gender for a given competitive level in football players. Over the most intensive 5 minutes of the game, male players likewise covered farther, but there was no discernible difference in the distance covered over the next 5 minutes. However, in technical areas like ball touches, possession time, and the overall number of duels won, both genders had comparable performance (Bradley et al., Citation2014; Mujika et al., Citation2009). Integrating physical, technical, and tactical factors in football is essential for a comprehensive and effective approach to player development, team strategy, and overall success. Players need to make split-second decisions during a match to make better decisions based on their physical capabilities and technical skills while considering the tactical context of the game (Ferraz et al., Citation2022). Considering physical factors like fitness, strength, and conditioning alongside technical and tactical aspects can help in injury prevention and long-term player health (Becker et al., Citation2006; Taberner et al., Citation2020). Teams that effectively integrate physical, technical, and tactical elements gain a competitive advantage and relate it to training (Branquinho et al., Citation2021; Fernandes et al., Citation2022). They can exploit their strengths and mitigate weaknesses, making them formidable opponents and increasing their chances of success in matches and competitions. However, there is a lack of understanding of the role of tactical behaviour, the coach’s model, and the strategy of each game when physical and technical factors are integrated (E. Ferraz et al., Citation2022; Teixeira, Forte, Ferraz, Branquinho, Silva, Barbosa, et al., Citation2022).
6. Conclusion
Current mixed linear modelling and cluster classification can be a good predictive model for the attacking performance of women’s football World Cup teams.
Practical applications can be drawn from this study. Teams who want to adopt a tactical decision of a higher rate of pass exchange and breaking the defensive lines will demand significant running total distance. On the other hand, outperforming ball progression, ball possession, receiving the ball in the final third, and breaking the opponent lines will save running distance. Our model suggests that high-speed distance is associated with team success. Our model suggests that broken defensive lines and receptions in the final third (all associated with successful teams in men’s football) are correlated positively with High-speed distance covered. Thus, our data suggest that increasing the capacity of the team to cover distance at high speed might be beneficial to achieving success in the women’s football elite level.
Furthermore, the training process can adjust the need for distance covered to the attacking performance of women’s football teams. Future research should integrate contextual factors related to the game, tactical behaviour and game strategies as mediating variables for future predictive models. The study’s conclusions offer guidance to football coaches on how to improve team tactics, training approaches and strategic models for success in international events for women’s soccer.
Disclosure statement
No potential conflict of interest was reported by the author(s).
Additional information
Funding
References
- Aquino, R., Gonçalves, L. G., Galgaro, M., Maria, T. S., Rostaiser, E., Pastor, A., Nobari, H., Garcia, G. R., Moraes-Neto, M. V., & Nakamura, F. Y. (2021). Match running performance in Brazilian professional soccer players: Comparisons between successful and unsuccessful teams. BMC Sports Science, Medicine and Rehabilitation, 13(1), 93. https://doi.org/10.1186/s13102-021-00324-x
- Becker, A., Gaulrapp, H., & Hess, H. (2006). Injuries in women soccer - results of a prospective study - in cooperation with the German Football Association (DFB). Sportverletzung-Sportschaden, 20(4), 196–200. https://doi.org/10.1055/s-2006-927193
- Bradley, P. S., Dellal, A., Mohr, M., Castellano, J., & Wilkie, A. (2014). Gender differences in match performance characteristics of soccer players competing in the UEFA Champions League. Human Movement Science, 33(1), 159–171. https://doi.org/10.1016/j.humov.2013.07.024
- Branquinho, L., Ferraz, R., & Marques, M. C. (2021). 5-a-side game as a tool for the Coach In Soccer Training. Strength & Conditioning Journal, 43(5), 96–108. https://doi.org/10.1519/ssc.0000000000000629
- Branquinho, L., Forte, P., Thomatieli-Santos, R. V., de França, E., Marinho, D. A., Teixeira, J. E., & Ferraz, R. (2023). Perspectives on player performance during FIFA world cup Qatar 2022: A brief report. Sports, 11(9), 174. https://doi.org/10.3390/sports11090174
- Casal, C. A., Maneiro, R., Ardá, T., Marí, F. J., & Losada, J. L. (2017). Possession zone as a performance indicator in football. The game of the best teams. Frontiers in Psychology, 8(JUL), 1176. https://doi.org/10.3389/fpsyg.2017.01176
- Clemente, F. M., Couceiro, M. S., Martins, F. M. L., Ivanova, M. O., & Mendes, R. (2013). Activity profiles of soccer players during the 2010 World Cup. Journal of Human Kinetics, 38(1), 201–211. https://doi.org/10.2478/hukin-2013-0060
- Culvin, A. (2021). Football as work: The lived realities of professional women footballers in England. In Managing sport and leisure. University of Central Lancashire. https://doi.org/10.1080/23750472.2021.1959384
- Fernandes, R., Ceylan, H. İ., Clemente, F. M., Brito, J. P., Martins, A. D., Nobari, H., Reis, V. M., & Oliveira, R. (2022). In-season microcycle quantification of professional women soccer players—external, internal and wellness measures. Healthcare, 10(4), 695. https://doi.org/10.3390/healthcare10040695
- Ferraz, R., Forte, P., Branquinho, L., Teixeira, J. E., Neiva, H., Marinho, D. A., & Marques, M. C. (2022). The performance during the exercise: Legitimizing the psychophysiological approach. Exercise Physiology. https://doi.org/10.5772/intechopen.102578
- FIFA. (2022). Electronic Performance and Tracking Systems - Certified Systems. https://www.fifa.com/technical/football-technology/resource-hub?id=25e4108cc8984f4fa3e10a582abed1c3
- Gollan, S., Ferrar, K., & Norton, K. (2018). Characterising game styles in the English Premier League using the “moments of play” framework. International Journal of Performance Analysis in Sport, 18(6), 998–1009. https://doi.org/10.1080/24748668.2018.1539383
- Herold, M., Kempe, M., Bauer, P., & Meyer, T. (2021). Attacking key performance indicators in soccer: Current practice and perceptions from the elite to youth academy level. Journal of Sports Science and Medicine, 20(1), 158–169. https://doi.org/10.52082/jssm.2021.158
- Hewitt, A., Greenham, G., & Norton, K. (2016). Game style in soccer: What is it and can we quantify it? International Journal of Performance Analysis in Sport, 16(1), 355–372. https://doi.org/10.1080/24748668.2016.11868892
- Kubayi, A. (2020). Analysis of goal scoring patterns in the 2018 FIFA World Cup. Journal of Human Kinetics, 71(1), 205–210. https://doi.org/10.2478/hukin-2019-0084
- Kubayi, A., & Larkin, P. (2020). Technical performance of soccer teams according to match outcome at the 2019 FIFA Women’s World Cup. International Journal of Performance Analysis in Sport, 20(5), 908–916. https://doi.org/10.1080/24748668.2020.1809320
- Linke, D., Link, D., Lames, M., & Kerhervé, H. A. (2020). Football-specific validity of TRACAB’s optical video tracking systems. Public Library of Science ONE, 15(3), e0230179. https://doi.org/10.1371/journal.pone.0230179
- Maneiro, R., Losada, J. L., Casal, C. A., & Ardá, A. (2020). The influence of match status on ball possession in high performance Women’s football. Frontiers in Psychology, 11, 487. https://doi.org/10.3389/fpsyg.2020.00487
- Maneiro, R., Losada, J. L., Casal, C. A., & Ardá, A. (2021). Identification of explanatory variables in possession of the ball in high-performance women’s football. International Journal of Environmental Research and Public Health, 18(11), 5922. https://doi.org/10.3390/ijerph18115922
- Marcelino, R., Sampaio, J., Amichay, G., Gonçalves, B., Couzin, I. D., & Nagy, M. (2020). Collective movement analysis reveals coordination tactics of team players in football matches. Chaos, Solitons & Fractals, 138, 109831. https://doi.org/10.1016/j.chaos.2020.109831
- Merlin, M., Cunha, S. A., Moura, F. A., Torres, R. D. S., Gonçalves, B., & Sampaio, J. (2020). Exploring the determinants of success in different clusters of ball possession sequences in soccer. Research in Sports Medicine, 28(3), 339–350. https://doi.org/10.1080/15438627.2020.1716228
- Modric, T., Versic, S., Drid, P., Stojanovic, M., Radzimiński, Ł., Bossard, C., Aftański, T., & Sekulic, D. (2021). Analysis of running performance in the offensive and defensive phases of the game: Is it associated with the team achievement in the UEFA Champions League? Applied Sciences, 11(18), 8765. https://doi.org/10.3390/app11188765
- Modric, T., Versic, S., & Sekulic, D. (2020). Position specific running performances in professional football (soccer): Influence of different tactical formations. Sports, 8(12), 161. https://doi.org/10.3390/sports8120161
- Modric, T., Versic, S., Sekulic, D., & Liposek, S. (2019). Analysis of the association between running performance and game performance indicators in professional soccer players. International Journal of Environmental Research and Public Health, 16(20), 4032. https://doi.org/10.3390/ijerph16204032
- Mujika, I., Santisteban, J., Impellizzeri, F. M., & Castagna, C. (2009). Fitness determinants of success in men’s and women’s football. Journal of Sports Sciences, 27(2), 107–114. https://doi.org/10.1080/02640410802428071
- Okholm Kryger, K., Wang, A., Mehta, R., Impellizzeri, F. M., Massey, A., & McCall, A. (2022). Research on women’s football: A scoping review. Science and Medicine in Football, 6(5), 549–558. https://doi.org/10.1080/24733938.2020.1868560
- Passos, P., Amaro E Silva, R., Gomez-Jordana, L., & Davids, K. (2020). Developing a two-dimensional landscape model of opportunities for penetrative passing in association football–stage I. Journal of Sports Sciences, 38(21), 2407–2414. https://doi.org/10.1080/02640414.2020.1786991
- Pedersen, S., Heitmann, K. A., Sagelv, E. H., Johansen, D., & Pettersen, S. A. (2019). Improved maximal strength is not associated with improvements in sprint time or jump height in high-level female football players: A cluster-randomized controlled trial. BMC Sports Science, Medicine and Rehabilitation, 11(1), 1–8. https://doi.org/10.1186/s13102-019-0133-9
- Plakias, S., Kokkotis, C., Moustakidis, S., Tsatalas, T., Papalexi, M., Kasioura, C., Giakas, G., & Tsaopoulos, D. (2023). Identifying playing styles of european soccer teams during the key moments of the game. Journal of Physical Education and Sport, 23(4), 878–890. https://doi.org/10.7752/jpes.2023.04111
- Plakias, S., Moustakidis, S., Kokkotis, C., Tsatalas, T., Papalexi, M., Plakias, D., Giakas, G., & Tsaopoulos, D. (2023a). Identifying soccer teams’ styles of play: A scoping and critical review. Journal of Functional Morphology and Kinesiology, 8(2), 39. https://doi.org/10.3390/jfmk8020039
- Praça, G. M., Brandão, L. H. A., de Oliveira Abreu, C., Oliveira, P. H. D. A., & de Andrade, A. G. P. (2023). Novel tactical insights from Men’s 2022 FIFA World Cup: Which performance indicators explain the teams’ goal difference? Proceedings of the Institution of Mechanical Engineers, Part P: Journal of Sports Engineering & Technology, 17543371231194292. https://doi.org/10.1177/17543371231194291
- Redwood‐Brown, A. J., O’Donoghue, P. G., Nevill, A. M., Saward, C., Dyer, N., & Sunderland, C. (2018). Effects of situational variables on the physical activity profiles of elite soccer players in different score line states. Scandinavian Journal of Medicine & Science in Sports, 28(12), 2515–2526. https://doi.org/10.1111/sms.13271
- Silva, J. R., Rumpf, M., Hertzog, M., & Nassis, G. (2017). Does the FIFA world cup’s congested fixture program affect players’ performance? Asian Journal of Sports Medicine, 8(4). https://doi.org/10.5812/asjsm.13805
- Taberner, M., Van Dyk, N., Allen, T., Jain, N., Richter, C., Drust, B., Betancur, E., & Cohen, D. D. (2020). Physical preparation and return to performance of an elite female football player following ACL reconstruction: A journey to the FIFA Women’s World Cup. BMJ Open Sport and Exercise Medicine, 6(1), e000843. https://doi.org/10.1136/bmjsem-2020-000843
- Teixeira, J. E., Forte, P., Ferraz, R., Branquinho, L., Silva, A. J., Barbosa, T. M., & Monteiro, A. M. (2022). Methodological procedures for non-linear analyses of physiological and behavioural data in football. In Exercise physiology. IntechOpen. https://doi.org/10.5772/intechopen.102577
- Teixeira, J. E., Forte, P., Ferraz, R., Branquinho, L., Silva, A. J., Monteiro, A. M., & Barbosa, T. M. (2022). Integrating physical and tactical factors in football using positional data: A systematic review. PeerJ, 10, e14381. https://doi.org/10.7717/peerj.14381
- Teixeira, J. E., Leal, M., Ferraz, R., Ribeiro, J., Cachada, J. M., Barbosa, T. M., Monteiro, A. M., & Forte, P. (2021). Effects of match location, quality of opposition and match outcome on match running performance in a portuguese professional football team. Entropy, 23(8), 1–16. https://doi.org/10.3390/e23080973
- Wang, S. H., Qin, Y., Jia, Y., Igor, K. E., & Constantinou, A. C. (2022). A systematic review about the performance indicators related to ball possession. Public Library of Science ONE, 17(3), e0265540. https://doi.org/10.1371/journal.pone.0265540
- Wei, X., Zhao, Y., Chen, H., Krustrup, P., Randers, M. B., & Chen, C. (2023). Are EFI data valuable? Evidence from the 2022 FIFA World Cup group stage. Biology of Sport, 41(1), 77–85. https://doi.org/10.5114/biolsport.2024.127382
- Yiannakos, A., & Armatas, V. (2006). Evaluation of the goal scoring patterns in European Championship in Portugal 2004. International Journal of Performance Analysis in Sport, 6(1), 178–188. https://doi.org/10.1080/24748668.2006.11868366
- Zani, J., Fernandes, T., Santos, R., & Barreira, D. (2021). Patrones de pases en profundidad: análisis observacional de los torneos sénior de la UEFA y la FIFA. Apunts Educación Física y Deportes, 37(146), 42–51. https://doi.org/10.5672/APUNTS.2014-0983.ES.(2021/4).146.05