
 ?Mathematical formulae have been encoded as MathML and are displayed in this HTML version using MathJax in order to improve their display. Uncheck the box to turn MathJax off. This feature requires Javascript. Click on a formula to zoom.
ABSTRACT
Many studies have analyzed causation factors for piracy, but failed to quantitatively examine how piracy trends in regions have changed. The research aimed to establish the changing patterns of maritime piracy in Africa. The study utilized world piracy data from the National Geospatial Intelligence Agency, which was analyzed using spatial auto-correlation tools. Getis-Ord Gi* statistic identified piracy clusters and hot spot comparison tool compared the hot spot layers in East and West Africa. Autocorrelation analysis results suggest changing frequency of piracy incidents in the study areas before and after 2012. The mean Getis-Ord Gi* values for East Africa were 0.35946 and 0.07839 before and after 2012, illustrating agreater change. However, West Africa mean values were 0.60917 and 0.43408 pre and post 2012, suggesting minimal change. The comparison analysis results generated a smaller similarity value for East Africa (0.43350) and a larger index for West Africa (0.9867). West Africa recorded many incidents in the study period; hence, piracy intensity was almost similar. The study revealed high similarities in piracy events in West Africa, and low similarities in East Africa pre and post 2012. These have implications for understanding the changing dynamics of maritime piracy in Africa, and asserting spatial analysis.
Introduction
The importance of oceans and seas in promoting economic development in the world has grown through the years. According to United Nations Conference on Trade and Development (UNCTAD), approximately 90% of global trade is transported through the seas particularly in the narrow and risky waterways like Suez Canal, Singapore Strait, Gulf of Aden, and the Strait of Bab el-Mandeb (Ece & Kurt, Citation2021). Maritime pirates attack these zones risking choking the main trade routes (Ece & Kurt, Citation2021). Maritime piracy has significant impacts on global trade, economic development, the shipping industry and manufacturing sector (Tepp, Citation2012). Shipping companies suffer substantial economy losses, face high operating costs and higher insurance premium costs as pirates kidnap crews and demand for ransom (Nincic, Citation2009). Despite the declining numbers, maritime piracy remains a threat in certain regions; thus the need to study how piracy clusters in space.
Researchers have used crime mapping to determine spatial distribution of crime for many years with some of the earliest uses being traced back to the 19th century in France (Lisowska-Kierepka, Citation2022). The rapid growth of computer-based techniques has largely contributed to the development of crime mapping systems used to detect hot spots, thus aiding in targeted real-time resource allocation. One influential tool that has been used in exploring, visualizing, and explaining spatial distribution of criminal activities is Geographical Information System (GIS) (Ratcliffe & McCullagh, Citation1999). Hot spot detection and cluster analysis are important techniques in analyzing spatial distribution and patterns of crimes and helping in monitoring and preventing them (Braga, Citation2006). A few studies have looked at the application of these techniques to map maritime piracy clusters. A study investigated the space-time patterns of maritime piracy off the coast of Horn of Africa using rational choice theory and optimal foraging theory (Townsley & Oliveira, Citation2015). Their results confirmed that piratical activities cluster in space and time; therefore, forecasting future high-risk areas could be more effective and help inform maritime piracy prevention and suppression efforts.
Getis-Ord Gi* analysis has also been used to obtain a suitable indicator of spatial autocorrelation between piracy attacks and illegal and destructive fishing using data from period 2005–2014 (Desai et al., Citation2021). Citation2015In one study, researchers examined patterns in timing and locations of maritime piracy, which has implications for predicting future location of attacks and discovered that piracy incidents are concentrated in five sub-regions each having a varying time series (Marchione & Johnson, Citation2013). Moreover, they established that piracy attacks cluster in space and time, suggesting that an attack in one zone temporarily elevates risks of attacks at the same or nearby locations. Similarly, a study utilized GIS-based hazard map to investigate spatial pattern of maritime piracy (Watagawa et al., Citation2013). Another study summarized the findings that emerged from a Transcribe research using a comparative approach, concluding that geographical area of attacks influence the likelihood and characteristics of the incidents (Dugato & Berlusconi, Citation2015). Thus, it is necessary to determine how well the spatial analysis techniques can explain the variable nature of piracy in Africa.
This study analyzed the spatial distribution of piracy events in East and West Africa before and after 2012 using quantitative methods. Getis-Ord Gi* tool identified clusters, signifying hot or cold spots while the hotspot analysis tool provided detailed comparisons of piracy incidents in the study areas before and after 2012. The quantitative results from the analysis included mean, standard deviation and similarity values that pointed out the intensity and association of piracy events in the study zones. The current research was necessary to explain the changing trends of piracy incidents in East and West Africa. Further, it established the effectiveness of using spatial auto-correlation analysis tools to show spatial patterns of maritime piracy.
Global maritime piracy
Maritime piracy has long been an issue to global shipping, some experts describing it as a major threat to the international transport networks (Tepp, Citation2012). Piracy has been a major problem in the Gulf of Guinea, Gulf of Aden, and the Southeast Asia region (Hassan & Hasan, Citation2017). shows the number of piracy incidences in the world from 1991 to 2022. From the visualization, piracy attacks were less in the twentieth century; however, the world experienced the highest number of piracy incidents totaling to 469 in the year 2000 (Ploch et al., Citation2009).
Figure 1. Piracy attacks in the world.
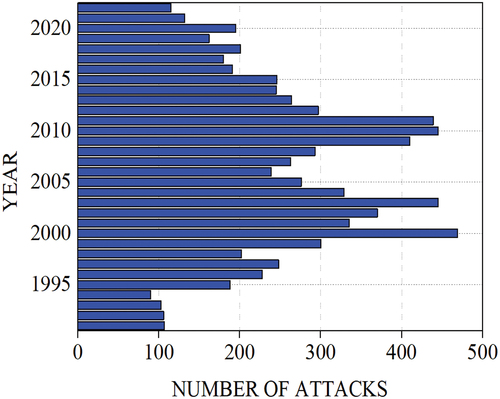
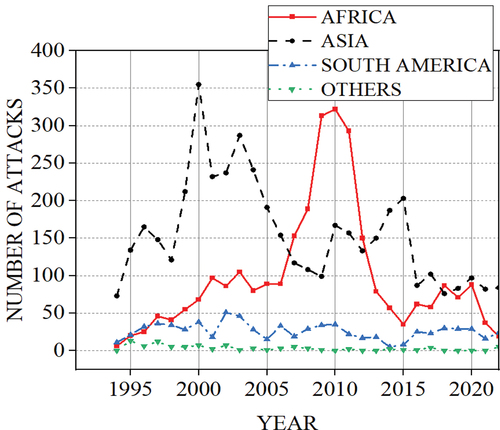
A study has attributed the rise of piracy incidents to massive growth of the shipping industry leading to increased vessel traffic and global trade, economic and political instability and poverty (Ece & Kurt, Citation2021). The IMB PRC reports that in 2020, there were 195 piracy and armed robbery incidents against ships worldwide, but the cases declined in 2022 (Q1 Citation2022, IMB Piracy Report.pdf. Citation2023). The number increased in 2020 during the COVID-19 pandemic particularly in Nigeria and Benin, since the pandemic had negative implications on the global economy, growth rates, international trade, and employment (Gold et al., Citation2023). is a line graph comparing yearly piracy cases in different world regions from 1993 to 2022. The graph does not compare piracy events of 1991 and 1992 because of the huge discrepancies the data have. At the time, maritime organizations had not established an effective means to obtain reports of piracy on vessels. Africa, Asia, and South America are the three geographic zones mostly affected by piracy. From the diagram, piracy in Africa is rampant with the peak period in 2010, where 322 piracy incidents occurred (Mukundan, Citation2003), while Asia reported high numbers of piracy attacks, the highest being in 2003 with 287 cases and South America reported a high of 51 attacks in 2002.
Figure 2. Yearly comparison of piracy cases in different world regions.
Maritime piracy in Africa
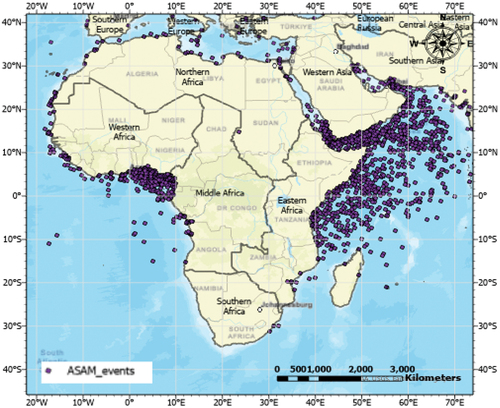
TIncidences of piracy in Africa occur in the Gulf of Aden, along the Coast of the Horn of Africa and in the Gulf of Guinea. illustrates distribution of piracy events in Africa for the period 1991–2022. Somali piratical activities around Gulf of Aden and Horn of Africa became rampant from 2006 to 2011 and gained a lot of attention from the international media (Ploch et al., Citation2009). The number of piracy incidents that took place off the coast of Horn Africa significantly increased in 2008 threatening the international trade, and in 2009, Somali pirates accounted for nearly half of the worldwide piracy incidents (Potgieter & Schofield, Citation2010). The region is a key maritime route linking Europe and Asia from the Mediterranean Sea to the Indian Ocean. Thus, the surge in piracy attacks in the area prompted a response from the international community, as it was a threat to navigation (Nincic, Citation2009).
Figure 3. Piracy events distribution in Africa.
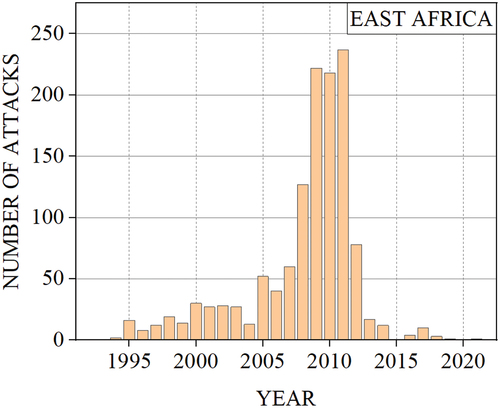
Piracy off Somalia declined due to the increased presence of international naval forces and the efforts of Somali’s central government to stabilize their systems (Fiorelli, Citation2014). is a bar graph of incidents distribution in East Africa, illustrating the peak years of Somali piracy from 2009 to 2011 where the region recorded 222, 218, and 237 events, respectively. From 2012, piracy cases in East Africa have significantly reduced with some years, such as 2015 and 2020 reporting zero incidents according to the graph.
Figure 4. Piracy distribution in East Africa.
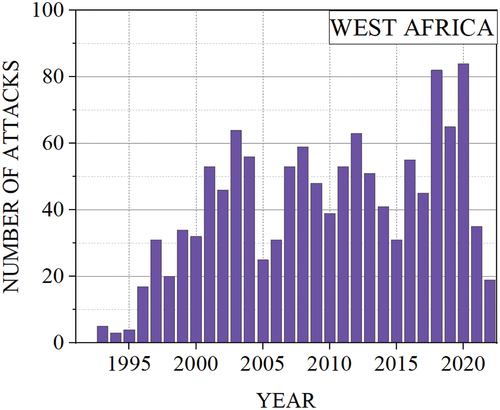
The Gulf of Guinea stretches over 6000 km coastline from Cape Verde and Senegal in West Africa to Angola. There has been a growing interest in the oil and gas production in sub-Saharan African, particularly Gulf of Guinea by the United States (Fiorelli, Citation2014). Piracy poses a major security threat in the Gulf of Guinea and ultimately to the economic development of the region (Fiorelli, Citation2014). From 2006 to 2016, piracy majorly occurred in territorial waters, making it hard for international forces to intervene (Nincic, Citation2009). As a result, many pirates linked to criminal enterprises in possession of heavy arms with adequate financial support networks continued to attack ships. Factors supporting piracy in Gulf of Guinea are a permissive political environment, socioeconomic factors, weaknesses in the region’s judicial and legal systems, and an ideal geographical location (Fiorelli, Citation2014). shows the distribution of pirates in West Africa from 1991 to 2022. The attacks in the West African coast have declined due to the increased presence of naval vessels and effective coordination between coastal authorities in the region (Tsioufis et al., Citation2023). The region experienced an overall decrease in piratical activities in 2022, recording 19 incidents, down from 35 cases in 2021 (IMB piracy report January-December 2022 Citation2023). Despite the declining incidents, piracy continues to be a threat in the Gulf of Guinea. In 2022, pirates hijacked two vessels and took hostage of 29 crewmembers illustrating the great threat seafarers and vessels face when sailing in this region (IMB piracy report January-December 2022 Citation2023). Additionally, recent attacks on product tankers illustrate the need to maintain effective countermeasures against piracy in this zone (IMB piracy report January-December 2022. 2023a).
Figure 5. Piracy distribution in West Africa.
describes the number of piracy attacks in Africa and the rest of the world from 1991 to 2022. Total reported piracy events in the world was 8,113, while in Africa was 2,829 (34.9%). In 2009, Africa recorded the highest percentage (76.3 %) of all piracy incidents reported in the world compared to other years. According to the table, in the period from 2001 to 2010, Africa experienced almost half of the incidents occurring in the world, accounting for 44.7%. This number was also the highest number compared to the other decades. Between 2008 and 2011, piracy attacks in Africa surpassed the number of incidents recorded in other world regions. During this period, piracy incidents off Somali coast and in the Gulf of Aden were at its peak (Nincic, Citation2009). This illustrated the magnitude of the piracy problem in East Africa and the rest of the African continent. is a three-dimensional bar graph comparing yearly piracy attacks of Africa versus the World from 1991 to 2003. It also includes the piracy rate in Africa expressed as a percentage of world incidents, with the highest rate being 76% in 2009 when Africa reported 313 events while total world incidents was 410.
Figure 6. Piracy events comparison in Africa versus the world.
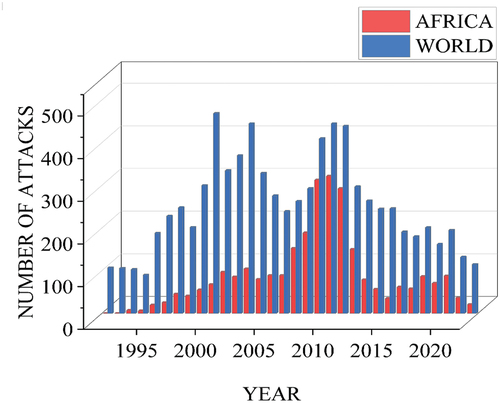
Table 1. Comparison for piracy attacks in Africa versus the world (1991–2022).
Materials and methods
Study area
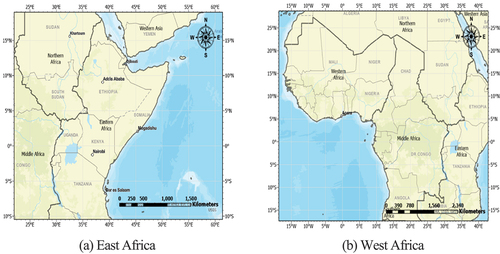
The study analyzed maritime piracy in two specific regions. The first location is East Africa, including the Indian Ocean, off Somali coast, and the Gulf of Aden. The area was chosen because it recorded the highest number of piratical activities in 2008–2011 and due to its association with United States and the international interest (Gold et al., Citation2023). The second region is Gulf of Guinea, which includes the West African coast and associated countries. Gulf of Guinea region is an appropriate study area because currently it is the most dangerous zone for vessels to sail. The zone has vast oil reserves; therefore, piracy in the area has potential long-term implications for economic and security concerns of the US and its international allies (Nincic, Citation2009). The study compared hot spot results of East Africa and West Africa before and after 2012. Study period is the year 2012 because it was when global attention on piracy moved from off Somali Coast due to decreased numbers of incidents to Gulf of Guinea region, which was increasingly recording high number of piracy attacks. Analyzing these two locations before and after 2012 is critical to understanding the changing trends of maritime piracy in Africa. This has implications for determining piracy dynamics in East and West Africa and for fighting off piracy issue in the Gulf of Guinea. An analysis of the hot spot areas in East Africa and West Africa was conducted using the spatial autocorrelation techniques on ArcGIS, specifically the Getis-Ord Gi* and hot spot analysis comparison tool. These tools are effective in identifying clusters and hot spots of crime point incidents. Prior to computing spatial autocorrelation statistics, it was necessary to divide both study areas into areal units. The NGIA has divided the world into 97 sub-regions but these were too large for analysis (Marchione & Johnson, Citation2013); therefore, equal-sized grid cells of 65 km by 65 km were created over the two study areas and used to compute spatial statistics. The grid was set to 65km by 65km because they were sufficient to cover piracy incidents that occurred over vast oceanic areas. The African continent is the target area for the study and it occupies a fairly larger area. Therefore, larger grid cells were ideal to provide a generalized overview of the distribution of piratical activities. Considering the navigable zone of the area of interest and a 65km by 65km cell size, 4,554 grid cells were set in East Africa and 1,919 in West Africa to broadly review the overall piracy spatial patterns in the target regions. Study area 1 in Africa is East Africa as illustrated in . The map in illustrates the study area 2 for this research covering the West African and Central African, which form part of the Gulf of Guinea region.
Figure 7. Maps of study areas.
Data acquisition and pre-processing
The United States (U.S) National Geospatial Intelligence Agency (NGIA) is the primary source of maritime piracy data and has maintained piracy records for decades. The NGIA collects and collates the piracy data, which come from different sources including the IMB and IMO and issues warnings to vessels in real time. The IMO maintains the Global Integrated Shipping Information System (GISIS), which also reports piracy and armed robbery incidents on vessels. Founded in 1981 and concerned with the alarming rate of piracy attacks around the world, IMB formed a Piracy Reporting Center (PRC), which is a point of contact for reporting maritime piracy incidents 24/7 (Twyman-Ghoshal & Pierce, Citation2014). The organization is efficient in its operations; prompt forwarding of reports, effective coordination with response agencies, sending email alerts and broadcasts through the Global Maritime Distress and Safety System (GMDSS) Safety Net Services have helped in the response against maritime crimes worldwide (Twyman-Ghoshal & Pierce, Citation2014). To combat maritime piracy, stakeholders must be aware of the situation hence, IMB encourages vessel owners and masters to report all successful, attempted, or suspected piracy and armed robbery incidents to PRC, and it in turns issue warnings about piracy hot spots (Huang et al., Citation2015).
NGIA’s Anti-Shipping Activity Messages (ASAM) database contains approximately 8,900 piracy data entries showing incidents of maritime piracy. The data highlight successful and attempted attacks as well as suspicious activities. It also includes the data of occurrence of incidents, an ASAM reference number, geographical sub-region number, and the longitudinal and latitudinal position of the attacks (Twyman-Ghoshal & Pierce, Citation2014). Other details recorded are the aggressor if known, the type of vessel victimized, its name and flag, the navArea and a detailed description of the piracy incident. With the transparent statistics and a time span like this, researchers can identify underlying patterns and trends that provide meaningful insights into the problem of maritime piracy. The data used in the study are from 1991 to 2022 and primarily focus on piracy incidents in East Africa and West Africa. is a summary of the data characteristics used for spatial analysis. Preprocessing included deleting repeated entries and outliers, particularly piracy incident points with wrong coordinates. Filtering was done based on the geographical sub-region number to retain incidents in Africa between 1991 and 2022 is an illustration of the methodology utilized in the study.
Figure 8. Flow diagram of the methodology used in the study.
Table 2. Summary of data used for spatial analysis.
Spatial autocorrelation analysis
Spatial autocorrelation is fundamental in analyzing spatial distribution of phenomenon (Getis, Citation2008). It pinpoints locations with similar and dissimilar values and determines whether the spatial distribution of the phenomena is random, clustered, or dispersed. Spatial analysis reveals patterns and underlying processes of features in terms of space using a set of statistics such as Global Moran’s I, Anselin Local Moran’s I, and Getis-Ord Gi* statistic. Positive spatial autocorrelation occurs when geographically nearby variables have similar values, thus cluster together. Conversely when nearby variables have dissimilar values, for instance, high values surrounded by low values, it is referred to as negative spatial autocorrelation. Incidents, mostly crimes frequently cluster together in hot spots and the non-random arrangement allows authorities to target specific regions with crime concentrations or prioritize areas with intensity of incidents. Measuring spatial autocorrelation analysis helps avoid violation of fundamental statistical assumptions and supports spatial prediction (Lichstein et al., Citation2002).
Global Moran’s I statistic
Moran’s I statistic is one of the oldest measures of spatial autocorrelation applied to points with attribute values associated with them. It compares variable values at one location with values at other locations. The statistic measured correlation among neighboring piracy incidents to find patterns and level of clustering. The formula for the statistic is as in Equationequation (1)(1)
(1) :
where
is the deviation of a value for feature
from its mean
is Spatial weight between feature
and
-total number of features
is Aggregate of all the spatial weights, and its formula is in Equationequation (2)
(2)
(2) :
Calculation for the score for the statistic as in Equationequation (3)(3)
(3) :
The weighted Moran’s I compares the sum of the cross products of attribute values at multiple locations, weighted by the inverse of the distance between locations and variable variance. It varies between −1.0 and + 1.0. When points closer to each have similar values, their cross product is high and when they have dissimilar values, their cross product is low. Values of I above the theoretical mean E (I) indicates positive spatial autocorrelation while those below indicates negative spatial autocorrelation. After computing the index value, the Moran’s tool computes the expected Index value and compares it with the observed index values. It also calculates z- score and p-value while considering the dataset features and variance of the maritime piracy data to determine whether the difference is statistically significant. The index values computed were interpreted within the context of null hypothesis.
Anselin local Moran’s I
Local Moran’s I identifies the relationships within the spatially distributed areal data by finding clusters and outliers within data. It uses a spatial autocorrelation index for hot spot identification and is defined as in Equationequation (4)(4)
(4) :
where
- An attribute for feature,
- Mean of corresponding attribute,
-Spatial weight between feature
and
,
- total number of features.
can be computed as in Equationequation (5)
(5)
(5) below:
The score for the statistic is Equationequation (6)
(6)
(6) :
where
, the expected value and
, the variance are described in Equationequations (7)
(7)
(7) and (Equation8
(8)
(8) ):
Local Moran’s I values can be positive or negative and helps in the identification of hot spots. A positive local Moran’s I value indicates neighboring areas with similar high or low values forming a cluster of either hot or cold spots while negative indicates neighboring areas with dissimilar values, meaning the area is an outlier. The output obtained included z-scores and COType (Cluster/Outlier Type) values that revealed hot spot and cold spot areas. Areas with positive z-scores had similar values, either high or low in the surrounding areas. “HH” (High-High) represents clusters of high values, in this study high piracy incidents and “LL” (Low-Low) indicates clusters of low values (low piracy counts). Regions with negative z-scores had different high or low values than the neighbors. The associated COType “HL” (High-Low) means the area has high values but is surrounded with areas with low values while “LH” (Low-High) means a zone with low values and surrounded with an area of high values. In this study, Anselin Moran’s I was run on the counts of maritime piracy incidents using the default settings of the tool with a weight matrix of value one if the zones border each other and zero if otherwise.
Getis-ord Gi* statistic
Hot spot clusters of maritime piracy incidents were mapped through Getis-Ord Gi* statistic originally developed by Getis and Ord. The Getis-Ord Gi* is a z score that considers an area in the context of its surrounding regions. It calculates the sum of the values for all the areas and the surrounding neighbors and the proportion the local sum (i) of the total sum of all areas (Songchitruksa & Zeng, Citation2010). When the local sum value is much different from the expected local sum value, it results in statistically significant z-scores. An area can only be identified as a hot spot if it has high values and is surrounded by other high values. The mathematical expression of Getis-Ord Gi* statistic is expressed as Equationequation (9)(9)
(9) :
where
- Spatial autocorrelation of an event
over
event
-Spatial weight matrix,
– value (piracy incident count) at the location,
-Mean, S-standard deviation.
Determining whether the local pattern of crime is similar or different to what is observed across the whole data helps to identify hot spots and cold spots. Zones with high positive z-scores and low p-values indicate clusters of high values with higher z-score values suggesting intense clusters (Songchitruksa & Zeng, Citation2010). Conversely, areas with low negative z-scores and low p-value indicate clusters of low values with lower z-scores implying more intense clusters. Therefore, for this study, hot spot areas mapped will have high positive z-scores and low p-values. The threshold distance, which describes the proximity of one piracy incident to another in this study, was set as 660,000 m for East Africa and 255,866 m for West Africa (fixed distance). Before running the Getis-Ord Gi* statistic tool, first process was generating equal-sized grids of 65km by 65km using the create fishnet function to cover individual study areas. Then, the summary within function was run and it yielded a new input weighted point feature class with a new field, called sum of counts that indicated the sum of piracy incidents that occurred at each grid cell in the specific locations. Getis-Ord Gi* function was then used to look at each feature within the context of its neighboring features and calculate z-scores and p-values to explain where clusters of high or values occurred. The Getis-Ord Gi* statistic identified statistically significant hot spots in East Africa and West Africa before and after 2012.
Hot spot analysis comparison
The hot spot analysis comparison tool quantifies similarities between two layers. The input features are two hot spot layers, while the output is a single layer comparing the association of the two hot spot layers. For this study, the hot spot analysis for East Africa and West Africa before and after 2012 was conducted using the Getis Ord Gi* statistic tool. Then, the hot spot analysis tool compared the significance level categories (99% hot, 95% hot, not significant, 90% cold, 95% cold and 99% cold) between the corresponding features and the neighboring features for both input layers. The number of neighborhood features defines the number of surrounding features taken when calculating the statistic, and for this case was taken as eight. The number of permutations was 499 and the similarity weighting method utilized was fuzzy. The comparison tool calculated similarity and kappa values to measure the overall similarity and associations between the input feature layers.
Results
The study identified maritime piracy hot spots in East Africa and West Africa before and after 2012 using Getis-Ord Gi* statistic. Afterward, the hot spot comparison tool compared the hot spot results and and how they have changed in the study period. The distance band threshold for East Arica was 660, 000 m while for West Africa was 255,866 m. The values were ideal to determine the appropriate number of neighboring incidents to do the analysis.
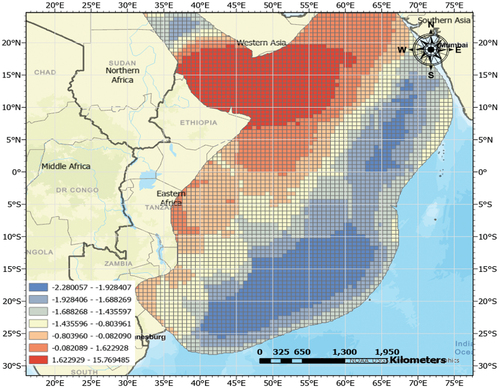
shows a visualization of the Getis-Ord Gi* hot spot analysis result for East Africa before 2012. Areas with many clusters were identified along the East African coastline, extending to Gulf of Aden and further into the sea. shows a hot spot zone map for East Africa after 2012, with the main hot spot zone with 99% significance level at the Gulf of Aden. The East African coastline was a hot spot with 90% significance level. Cold spot zones had also increased, meaning pirates were no longer targeting vessels passing through the area.
Figure 9. Getis-ord Gi* hot spot analysis result for East Africa before 2012.
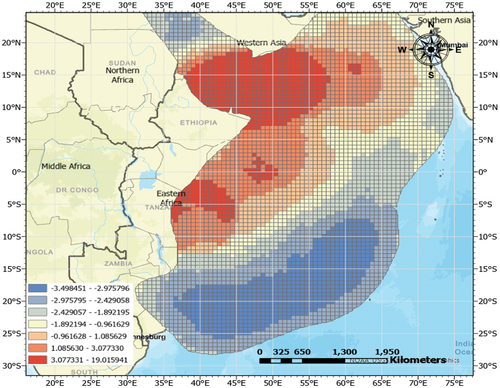
Figure 10. Getis-ord Gi* hot spot analysis result for East Africa after 2012.
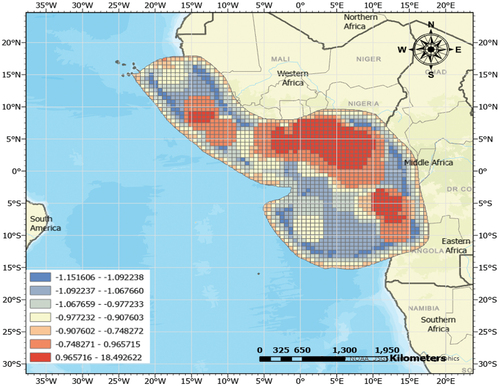
Similarly, the tool computed results for West Africa by integrating piracy incident from 1991 to 2022. shows a hot spot result for West Africa before 2012. Nigeria’s and part of Benin’s territorial waters were hot spots with 99% confidence level before 2012. Guinea also had hot spot zones with 99% confidence level located a little further from its coastline, while Ghana, Democratic Republic of Congo (DRC) and Senegal had fewer clusters. In , illustrating hot spot result for West Africa after 2012, Nigeria and Guinea had a slight increase of clusters with Nigeria’s territorial and high seas being hot spots with 99% confidence level. Additionally, Ghana, Benin, and Democratic Republic of Congo had clusters of piracy events near their shores while piracy attacks in Cameroon occurred some distance from the shore.
Figure 11. Getis-ord Gi* hot spot analysis result for West Africa before 2012.
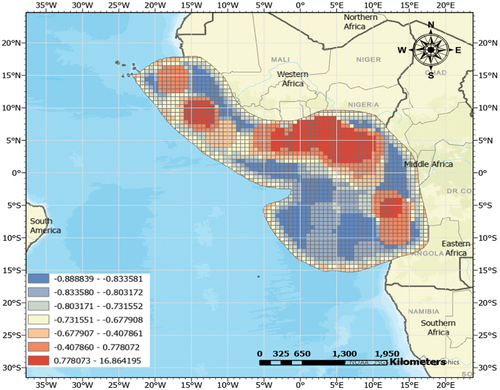
Figure 12. Getis-ord Gi* hot spot analysis result for West Africa after 2012.
highlights descriptive statistics of the Getis Ord Gi* hot spot result for East Africa and West Africa. The statistics (mean and standard deviation) explained the spatial distribution and intensity of maritime piracy events. The mean Getis-Ord Gi* value for piracy in East Africa was 0.35946 before and 0.07839 after 2012, while standard deviation was 1.93097 pre and 0.65695 post 2012. The mean Getis-Ord Gi* value for piracy in West Africa was 0.60917 before 2012 and 0.43408 after 2012, while standard deviation 4.96079 before 2012 and 2.72835 after 2012.
Table 3. Descriptive statistics of getis-ord Gi* hot spot result.
The output features of the hot spot comparison tool were intersections of the input hot spot result layers for before and after 2012 for the two study areas. The output layer contained fields summarizing the local similarity for corresponding features in the two hot spot layers. shows the comparative results of the detected hot spots in West Africa before and after 2012, depicting a change in hot spot and non-significant areas. According to the map, some zones further from the shore of the West African countries such as Nigeria, Ghana, and Benin moved from non-significant to hot spot areas. Most areas, which were hot spots before 2012, remained risky areas after 2012 as visualized in the map.
Figure 13. Hot spot analysis comparison result for West Africa.
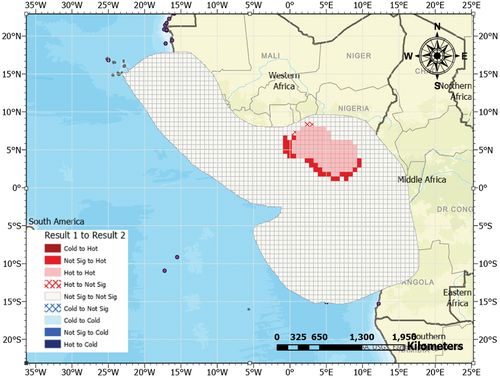
In , the hot spot comparison results for West Africa indicating the similarity value, expected similarity index and spatial fuzzy kappa is given. The global similarity value for West Africa was 0.9867, expected similarity was 0.8802 and spatial fuzzy kappa value of 0.8892. A layer was generated that displayed the significance level alongside a custom symbology that compared the Getis-Ord Gi* hot spot results for before and after 2012 in the study area. The higher similarity value illustrates that incidents in West Africa were mostly similar before and after 2012.
Table 4. Global hot spot analysis comparison results for West Africa.
below is a summary of the hot spot significance level pair counts in percentages for the hot spot comparison result after analyzing the hot spot maps for West Africa. A larger percentage (98.5%) of areas remained non-significant before and after 2012, while 96.9% of zones that were hot spots at 90% confidence level became hot spots at 99%.
Table 5. Hot spot significance level pair counts (percentages) for West Africa.
shows comparison of change in hot spot areas in East Africa before and after 2012. In the map, most areas especially in the Gulf of Aden and some parts off the Horn of Africa remained hot spot locations before and after 2012. Most areas along the East African coastline and further away from the coastline which were hot spots in 2012 became non-significant after 2012. Other areas in the Red Sea moved from cold to non-significant, while other zones in the Indian Ocean moved from cold spots to non-significant zones. The similarity value for East Africa was lower (0.4335), indicating dissimilarity in most regions in East Africa, apart from the Gulf of Aden. The spatial fuzzy kappa value for East Africa (0.1799) was comparatively lower to that of West Africa (0.8892). summarizes the results for East Africa obtained from running the hot spot comparison tool.
Figure 14. Hot spot analysis comparison result for East Africa.
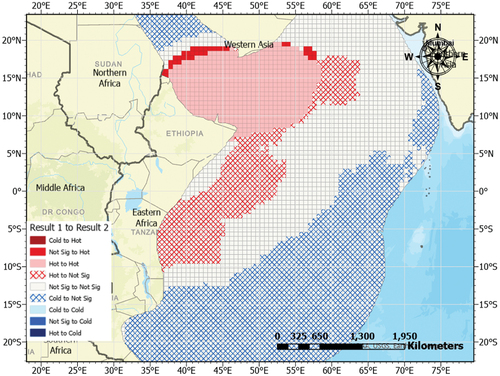
Table 6. Global hot spot analysis comparison results for East Africa.
In addition, the hot spot analysis comparison tool generated hot spot significance level pair counts as percentages table to explain the relationship between significant level combinations. displays the percentages of similarity between the input features. A higher percent (97.5 %) of areas remained non-significant before and after 2012. Many areas (94.7%) which were 99% hot spots before 2012 became non-significant after 2012. Only 2.3% of the studied zones remained hot spots at 99% confidence level before and after 2012. shows a diagram illustrating the result of the study, showing the similarity and kappa values obtained from the comparison result.
Figure 15. Spatial dynamics of maritime piracy in east and West Africa (before and after 2012).
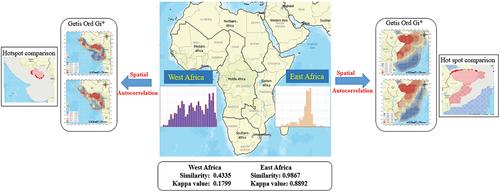
Table 7. Hot spot significance level pair counts (percentages) for East Africa.
Discussion
The objective of the research was to assess changes in spatial pattern of maritime piracy in East Africa and West Africa before and after 2012 using Getis-Ord Gi* and hot spot analysis comparison tool. Getis-Ord Gi* function assessed statistically significant hot spot areas in the study areas based on the high values of surrounding features. Positive values in Gi* statistic indicated spatial clustering of high values (hot spots) while negative value showed spatial clustering of low values (cold spots). The Getis-Ord Gi* hot spot results showed a greater change of piracy events in East Africa before 2012 and after 2012. Many piratical activities reported in East Africa before 2012 were concentrated off Somali Coast, the Gulf of Aden and attacks also occurred in international waters, with the region reporting 219 incidents in 2010 and gaining worldwide attention (Ploch et al., Citation2009). Hence, the Getis-Ord Gi* hot spot result layer shows many piracy clusters in the above-mentioned zones to indicate many piracy attacks. The IMB reported that pirates operating off the Somali coast used fast-moving skiffs and mother ships that enabled small pirate boats to conduct piratical activities on the high seas (Marchione & Johnson, Citation2013). However, after 2012, piracy cases off Somali coast had significantly reduced, with most attacks only being reported in Gulf of Aden. The mean Getis-Ord Gi* value for piracy in East Africa was 0.35946 pre 2012, indicating a higher frequency of piracy attacks, while a value of 0.07839 post 2012, illustrated a significant decrease in piratical activities. The standard deviation decreased from 1.93097 in 2012 to 0.65695 after 2012. Before 2012, East Africa had diverse clustering of hot and cold spots, but after 2012, the piracy patterns became homogenous and there was also less clustering of events.
For West Africa, Getis-Ord Gi* results show lower clusters of incidents, meaning few piracy cases compared to East Africa cases, and most attacks were reported in the territorial waters before 2012. The hot spot results for before and after 2012 showed clusters of piracy events on portions of the West African coastline for Nigeria, Benin, Ghana, and Togo. These countries have offshore petroleum extraction systems and urban ports that make them attractive to pirates. The mean Getis-Ord Gi* value for piracy in West Africa was 0.60917 before 2012 and 0.43408 after 2012, indicating a slight change in maritime intensity within the studied timeframe. Piracy in West Africa rampant as shown by a higher mean value; however, it happened in territorial waters; thus, it was not recognized internationally like in East Africa. However, after 2012, the number of piracy cases in West Africa remained high (mean value of 0.43408) while in East Africa they dropped (mean value of 0.07839). Post 2012, maritime piracy in West Africa became more spatially concentrated, with areas consistently showing high or low clusters compared to pre 2012. Hence, Getis standard deviation results indicate a value drop from 4.96079 to 2.72835.
Furthermore, the hot spot analysis comparison tool was run with input features as Getis-Ord Gi* hot spot layers of the two study areas. The confidence level of all the corresponding features in each layer was analyzed to determine the associations among the features. Maps of the output layers visually comparing the hot spot results and tables summarizing the confidence level for all the pairs of corresponding features were generated. In the comparison result, similarity values, measured between zero and one indicated the degree of spatial alignment between to which the hot spots, cold spots and non-significant areas of hot spot results before and after 2012 spatially aligned. If two hot spot layers displayed features with the same significance level, the tool assigned a similarity close to one, and if many features haddissimilar significance levels, the value assigned was close to zero. The hot spot trend before and after 2012 was highly dissimilar in East Africa; hence, a lower similarity value of 0.4335. From the hot spot significance level pair counts (percentage), 94.7% of areas in East Africa that were hot spots at 99% level and 89.8% of zones that were hot spots at 95% level before 2012 became non-significant after 2012. However, 0.0% of zones in East Africa moved from cold spots to hot spots. On the other hand, West Africa had a higher global similarity value of 0.9867 signifying a higher similarity of the hot spot layers before and after 2012. In West Africa, a larger percentage (98.5%) of areas remained non-significant before and after 2012, while 96.9% of zones were hot spots before and after 2012.
Association value illustrated the degree of statistical dependence between the two hot spot analysis variables. Association was measured by the kappa value, with values close to one illustrating strong dependence between two hot spot layers while values close to zero depicting unassociated results. The kappa value for East Africa before and after 2012 is very low (0.1799), close to zero meaning that the hot spot result for before and after 2012 for the region had unassociated results. The result explains that maritime piracy in East Africa transitioned significantly in time. On the other hand, the higher kappa value (0.8892) for West Africa explained stronger associations of events, highlighting minimal changing trends in piratical activities over the study period.
Conclusion
The study reports changing nature of piracy in East Africa and West Africa pre and post 2012. The year 2012 marks the period when piracy attacks dramatically decreased in East African coastline and piracy in West African coastline gained more attention. The hot spot algorithm assessed the pixels at each location and the neighboring pixels for a distance of 660,000 m in East Africa and 255, 866 m in West Africa to cluster piracy incidents as hot spots, cold spots, or non-significant. Getis-Ord Gi* statistic pinpointed piracy clusters in the study regions before and after 2012, and generated mean and standard deviation values to explain average intensity and dispersion of piracy events, respectively. East Africa had a higher mean value of 0.35946, which reduced to 0.07839 after 2012 highlighting a significant reduction in frequency of piracy cases. West Africa’s mean value for before and after 2012 was 0.60917 and 0.43408, showing a slight change in average intensity of incidents. After 2012, West Africa had a higher piracy frequency than East Africa as illustrated by the mean values. Similarity values for East and West Africa were 0.4335 and 0.9867, and spatial fuzzy values were 0.1799 and 0.8892, respectively. The results show huge dissimilarities in piracy in East Africa pre and post 2012 revealing the changing trend of piracy. However, in West Africa, there is a higher similarity in incidents prior to and after 2012. According to the results, spatial techniques can be applied to describe variability of maritime piracy over time. Additionally, it emerged that exploring piracy from a region-specific view can provide valuable insights into the dynamics of maritime piracy in different geographical areas.
However, there were some limitations to this study, resulting in inconsistencies of the results presented. For instance, the hot spot analysis comparison result did not yield visualization of regions, which had transitioned from hot spots to cold spots and vice versa in both East and West Africa. One limitation was inaccurate data since different maritime organizations collect and collate the data. This causes variations in the accuracy and piracy events reported, resulting in incorrect visualization (McCabe, Citation2017). For example in the study, the ASAM database for piracy incidents in Africa differs from the number provided in IMB records for the same period. Secondly, different types of piracy cases (hijackings, kidnappings, theft) would probably show varying spatial patterns in the study regions. The current study did not consider these features when explaining the changing dynamics of piracy. In future studies, researchers could analyze different piracy attacks and vessel types to determine if more precise spatial patterns can be established for specific geographical zones.
Disclosure statement
No potential conflict of interest was reported by the author(s).
References
- Braga, A. A. (2006). The crime prevention value of hot spots policing. Psicothema, 18(3), 1–14.
- Desai, R. M., Shambaugh, G. E., & Belgrano, A. (2021). Measuring the global impact of destructive and illegal fishing on maritime piracy: A spatial analysis. Public Library of Science ONE, 16(2), 17. https://doi.org/10.1371/journal.pone.0246835
- Dugato, M., & Berlusconi, G. (2015). Maritime piracy worldwide. Transcrime Research in Brief, 1–15. https://www.researchgate.net/publication/273321698_Maritime_piracy_worldwide
- Ece, N. J., & Kurt, H. (2021). Analysis of maritime piracy by using qualitative methods. Mersin University Journal of Maritime Faculty, 3(2), 37–50. https://doi.org/10.47512/meujmaf.1018026
- Fiorelli, M. (2014). Piracy in Africa: The case of the Gulf of Guinea. Maritime Security, Transnational Organized Crime, (37), 1–16. https://africaportal.org/publication/piracy-in-africa-the-case-of-the-gulf-of-guinea/
- Getis, A. (2008). A history of the concept of spatial autocorrelation: A geographer’s perspective. Geographical Analysis, 40(3), 297–309. https://doi.org/10.1111/j.1538-4632.2008.00727.x
- Gold, A., Phayal, A., & Prins, B. (2023). The unexpected consequences of the COVID-19 pandemic on maritime crime: Evidence from Indonesia and Nigeria. International Area Studies Review, 26(1), 7–23. https://doi.org/10.1177/22338659221151130
- Hassan, D., & Hasan, S. M. (2017). Origion, development and evolution of maritime piracy: A historical analysis. International Journal of Law, Crime and Justice, 49, 1–9. https://doi.org/10.1016/j.ijlcj.2017.01.001
- Huang, D., Li, Y., and Hu, H. (2015). Application of geographic information system to calculate the probability of piracy occurrence. 2015 International Conference on Transportation Information and Safety (ICTIS) () , (pp. 754–759).
- IMB piracy report January-December 2022. (2023). https://www.iims.org.uk/imb-piracy-report-january-december-2022/
- Lichstein, J. W., Simons, T. R., Shriner, S. A., & Franzreb, K. E. (2002). Spatial autocorrelation and autoregressive models in ecology. Ecological Monographs, 72(3), 445–463. https://doi.org/10.1890/0012-9615(2002)072[0445:SAAAMI]2.0.CO;2
- Lisowska-Kierepka, A. (2022). How to analyse spatial distribution of crime? Crime risk indicator in an attempt to design an original method of spatial crime analysis. Cities, 120, 1–5. https://doi.org/10.1016/j.cities.2021.103403
- Marchione, E., & Johnson, S. D. (2013). Spatial, temporal and spatio-temporal patterns of maritime piracy. The Journal of Research in Crime and Delinquency, 50(4), 504–524. https://doi.org/10.1177/0022427812469113
- McCabe, R. C. (2017). Modern maritime piracy: Genesis, evolution and responses. Routledge.
- Mukundan, P. (2003). Piracy and armed robbery against ships today. WMU Journal of Maritime Affairs, 2(2), 167–180. https://doi.org/10.1007/BF03195042
- Nincic, D. (2009). Maritime piracy in Africa: The humanitarian dimension. African Security Review, 18(3), 1–16. https://doi.org/10.1080/10246029.2009.9627538
- Ploch, L., Blanchard, C. M., O’Rourke, R., Mason, R. C., & King, R. O. (2009). Piracy off the Horn of Africa.Washington, DC: Congressional Research Service, Library of Congress. https://apps.dtic.mil/sti/tr/pdf/ADA506650.pdf
- Potgieter, T., & Schofield, C. (2010). Poverty, poaching and pirates: Geopolitical instability and maritime insecurity off the Horn of Africa. Journal of the Indian Ocean Region, 6(1), 86–112. https://doi.org/10.1080/19480881.2010.489673
- Q1 2022 IMB Piracy Report.pdf. (2023). https://www.icc-ccs.org/reports/Q1%202022%20IMB%20Piracy%20Report.pdf
- Ratcliffe, J. H., & McCullagh, M. J. (1999). Hotbeds of crime and the search for spatial accuracy. Journal of Geographical Systems, 1(4), 385–398. https://doi.org/10.1007/s101090050020
- Songchitruksa, P., & Zeng, X. (2010). Getis–ord spatial statistics to identify hot spots by using incident management data. Transportation Research Record, 2165(1), 42–51. https://doi.org/10.3141/2165-05
- Tepp, E. (2012). The Gulf of Guinea: Military and non-military ways of combating piracy. Baltic Security and Defence, 14(1), 181–214.
- Townsley, M., & Oliveira, A. (2015). Space-time dynamics of maritime piracy. Security Journal, 28(3), 217–229. https://doi.org/10.1057/sj.2012.45
- Tsioufis, M., Fytopoulos, A., Kalaitzi, D., & Alexopoulos, T. A. (2023). Discovering maritime-piracy hot spots: A study based on AHP and spatio-temporal analysis. Annals of Operations Research, 1–23. https://doi.org/10.1007/s10479-023-05352-z
- Twyman-Ghoshal, A. A., & Pierce, G. (2014). The changing nature of contemporary maritime piracy: Results from the contemporary maritime piracy database 2001–10. The British Journal of Criminology, 54(4), 652–672. https://doi.org/10.1093/bjc/azu019
- Watagawa, M., Furusho, M., Wakabayashi, N., & KOBAYASHI, E. (2013). Analysis of piracy acts using geospatial information system. The Journal of Japan Institute of Navigation, 128, 55–63. https://doi.org/10.9749/jin.128.55