
 ?Mathematical formulae have been encoded as MathML and are displayed in this HTML version using MathJax in order to improve their display. Uncheck the box to turn MathJax off. This feature requires Javascript. Click on a formula to zoom.
ABSTRACT
This study investigates potential risks associated with ammonia releases from a case ship to be constructed in a Korean Shipyard and operated in Korean coastal areas. The focus is on understanding how ammonia disperses from the onboard storage tank’s Vent Master and the associated toxic zones. Numerical simulations using CFD tools were employed to model ammonia gas dispersion scenarios. The study revealed that if the safety valve opens, the high internal pressure of the ammonia tank could release a significant amount of ammonia through the vent mast. Thus, determining the position and height of the vent mast is crucial for safety design. Simulations showed that even if ammonia is released at sea through the vent mast, it poses minimal risk to nearby residential areas. The vent mast, positioned at least 4 m above the ship’s deck, ensured rapid gas dispersion, reducing the chance of human exposure. The findings aim to enhance the safety design and operation of ships, providing valuable reference material for policymakers, regulators, engine manufacturers, and ammonia suppliers, ultimately contributing to the establishment of safe ship design and construction practices in the future.
Introduction
As regulations on emissions and climate change continue to strengthen, many industries, including the shipping and shipbuilding industries, are facing a variety of practical challenges. A wide range of technologies and fuel solutions are being introduced into the maritime market. Among them, ammonia (NH3) is gaining attention as a low-carbon or carbon-free fuel, achieving relatively rapid commercial growth, and potentially becoming a ship fuel in the near future (DNV, Citation2021).
Although engine technology for ships that use ammonia is currently under development, there are hardly any cases of ammonia being used as ship fuel.
Jeong et al. (Citation2022) conducted a comparative analysis of different energy sources, namely, hydrogen, ammonia, methane, and propane, considering various hazardous aspects. Ammonia was concerned with the highest level of toxicity, compared to other fuels. Its flammability was neither negligible. Toxicity, impacts, and its mitigation methods were well discussed by Padappayil and Borger (Citation2022).
In this regard, safety regulations for using ammonia as a ship fuel are being developed based on the extensive experience in the petrochemical and fertilizer industries, which have broad experience in ammonia production and handling (Techniclsafetybc, Citation2021). Currently, safety regulations for natural gas have been completed, but regulations for methyl/ethyl alcohol, fuel cells, LPG, and other low-flashpoint fuels are still being developed. Meanwhile, safety regulations for ammonia have just begun to be discussed by the International Maritime Organization, and it is predicted to take several years to develop provisional guidelines (LR, Citation2020).
The current handling of ammonia as land and maritime cargo is well established, but there is no previous experience with using ammonia as a ship fuel. Ammonia is toxic and corrosive, and therefore presents various safety issues related to its use as ship and engine fuel. As current safety regulations are insufficient, it is necessary to identify potential risks and perform risk assessments to ensure safe ship designs for ammonia propulsion. Safety regulatory gaps of using ammonia as marine fuel are thoroughly investigated and discussed by Jang et al. (Citation2023) which insists that the development of a common international regulation is an urgent task. At the same time, the risk of ammonia still needs to be further quantified through a series of studies which could be key inputs for the future regulatory frameworks.
Ammonia is a colorless toxic gas that emits a strong pungent odor at concentrations of 5–30 ppm. Ammonia gas is lighter than air (with a vapor density of 0.6 compared to air) and can be liquefied under pressure or cooling. Liquid ammonia can cause severe burns and skin damage upon contact with the skin. Exposure to anhydrous ammonia can lead to dehydration by absorbing moisture from skin tissue and forming ammonium hydroxide. When liquid ammonia evaporates, it can withdraw heat from body tissues and cause frostbite. Inhaling ammonia gas can cause fatal or life-threatening lung damage (pulmonary edema) leading to death. Large-scale ammonia leaks can generate toxic gas clouds that can spread over long distances, potentially causing catastrophic accidents due to the diffusion of toxic gas.
There have been voluminous studies addressing the potential risks of accidental ammonia release in multi-disciplinary sectors.
Yarandi et al. (Citation2021) have evaluated toxic effects of ammonia gas dispersion from industrial slaughterhouses. The impact of fatal levels was formed up to 920 m from the source of the leak. It clearly insisted that the ammonia release could lead to significant impacts on crews and ships when used as marine fuel. A similar research can be found in the work of Z. Tan et al. (Citation2014) that investigated the consequences of ammonia dispersion in ammonia production facilities. This research dealt with the relatively small ammonia leakage and resulted in about 50 m of lethal area. W. Tan et al. (Citation2017) conducted experimental works for simulating ammonia leakage and gas dispersion in a food factory. The validation/scale-up works were done with numerical calculations. These works were focused on laboratory-based works and could be further enhanced at larger scales. Another interesting research can be found in the study by Gerdroodbary et al. (Citation2016) where ammonia gas dispersion and its behaviors were investigated in consideration of the effects of the mesh barrier on the free dispersion of ammonia using numerical methods. Through the validation process, it clearly showed that the toxicity of ammonia release would reach more than 200 m long with a leak rate of 4.2 kg/s. It would ring an alarm bell of using ammonia as marine fuel.
In this context, this project is to investigate the potential risks pertinent to ammonia releases onboard with a case ship which is scheduled to be built in a Korean Shipyard and will be operated in a Korean coastal area. The study focused on evaluating the general behaviour of ammonia dispersion from the Vent Master of ammonia storage tank onboard and the toxic zones associated.
Key results of the study would be to contribute to the safety design and operation of the target vessel by identifying potential risk factors related to ammonia’s toxicity. Moreover, this study is expected to provide valuable reference materials for policy-makers, regulators, and industry stakeholders, including engine manufacturers and ammonia suppliers, to establish the institutional foundation for safe ship design and construction in the future.
Methodology
Ammonia (NH3) is attracting attention from the market as an eco-friendly alternative fuel for ships because of its price competitiveness and ease of storage and distribution compared to other alternative fuels. Accordingly, this study conducted a safety assessment of an ammonia-propelled ship by means of reliable software (Pyrosim/Star-ccm+). presents the methodology adopted for gas dispersion analysis in this study.
Figure 1. Methodology adopted in this study.
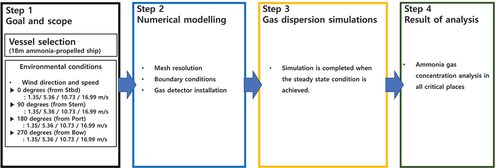
As shown in , the methodology used in this study consists of four main steps to evaluate the safety of the ship in the event of ammonia leakage: 1) Goal and scope, 2) Numerical modelling, 3) Gas dispersion simulations, and 4) Result of analysis.
In the first step, the specific research goal and scope of this study are defined. The research scope was established to sufficiently capture the general relationship between the environmental conditions to which the ship is exposed and the tendency for ammonia leakage. The following items should be taken into consideration when defining the research scope:
A CFD solver for gas dispersion simulations
Ship types and geometries to be studied
Environmental conditions
Assumptions to be applied
Given the defined research scope, the numerical modelling of the Computational Fluid Dynamics (CFD) model for the ammonia leak was carried out in the second step. The numerical modelling task has a great influence on the accuracy of the analysis results, so special care is required when performing the modelling task, and the following points should be considered:
Mesh resolution
Boundary conditions
Gas detector installation
In the third step, a series of gas dispersion simulations were performed based on the numerical model developed in the second step, and the simulation was terminated when the analysis result reached the steady-state condition. In the last step, the results obtained from the gas dispersion simulation, the ammonia gas concentration at the critical locations of the ship, were analyzed to examine the safety of the ammonia-propelled ship in case of gas leakage.
Step 1: goal and scope
Throughout all simulations, it is examined that an ammonia gas concentration of 30 ppm (0.003%) or less is achieved under the given environmental conditions in the outer area of the ship (“18 m ammonia reformed hydrogen cell cleaning ship” developed by KOSTEC Co., Ltd.) in case of ammonia leakage. The specifications of the ship are reported in .
Table 1. The principal characteristics of the ship model used in this study.
In order to perform the gas dispersion simulation, the 3D geometry of the ship is required first. Thus, a CAD (Computer-Aided Design) modelling task was carried out for generating the 3D shape of the ship based on the proposed general ship layout. depicts the 3D geometry of the ammonia-propelled ship generated by means of SolidWorks software developed by Dassault Systèmes SolidWorks Corp.
Figure 2. Ship geometry used in this study.
It should be highlighted that the direction and speed of the wind are critical factors affecting the gas dispersion tendency in the event of gas leakage. In this regard, the direction and speed of the wind to be applied to the gas dispersion simulation were determined by taking into account the annual climate characteristics of Busan Port located in the southeast of the Korean peninsula. The wind rose diagram showing Busan Port’s annual climate features is presented in , and the wind conditions applied to this study are shown in .
Figure 3. Annual climate characteristics of Busan port (Windfinder, Citation2018).
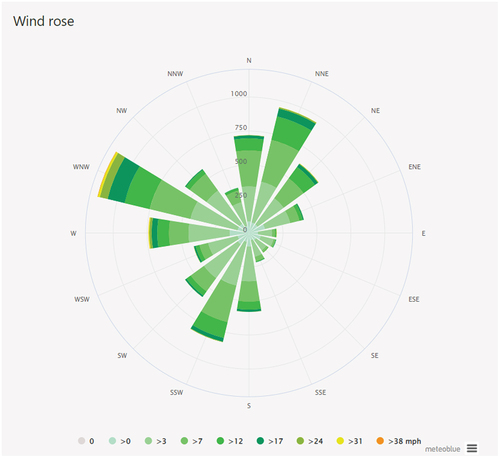
Table 2. Wind conditions applied in this study.
As can be seen in , the operating pressure of the ammonia tank installed on the ship is designed to be 8 bar and the diameter of the vent mast is 50 A. In this study, the gas leakage situation was considered as a worst-case scenario, and a continuous leakage of ammonia at a pressure of 8 bar from the vent mast was assumed throughout all the simulations. In addition, the leak rate at the top outlet of the vent mast is determined to be 0.028. Considering the aforementioned wind condition measured in Busan Port, the gas dispersion simulations were carried out at 16 different conditions, as presented in (each indicated by their case numbers).
Figure 4. The operating pressure of the ammonia storage tank and the vent mast diameter.
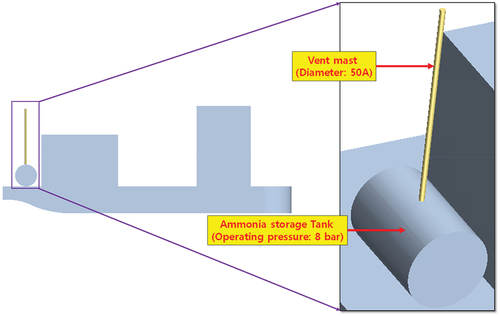
Table 3. Sixteen simulation cases carried out in this study.
Step 2: numerical modelling
In this study, the ammonia dispersion simulations reported in were performed using PyroSim developed by Thunderhead Engineering, a commercial Computational Fluid Dynamics (CFD) based simulation software. In addition, all the simulations performed in PyroSim were also carried out for cross-validation purposes by means of Star-ccm+ software developed by Siemens Digital Industries Software.
Pyrosim model
Mesh resolution
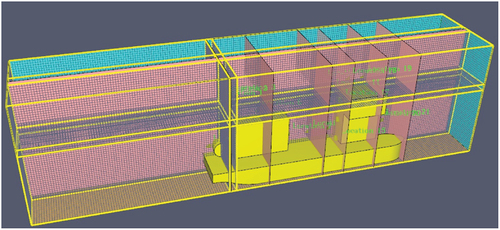
According to the PyroSim user manual, the computation of the gas dispersion simulation is performed within computational meshes. It should be borne in mind that objects created within the simulation such as obstructions and vents should match the grid size of the computational domain. The accuracy of the CFD simulation solution depends on the number of cells constituting the grid. In general, the greater the number of cells, the higher the accuracy of the solution. Depending on the size of the grid, the accuracy of the solution and the computational cost required for analysis (in terms of computer hardware or computation time required for analysis) vary. A refined grid is generated in a region where the variables (such as velocity, pressure, temperature, etc.) change greatly, and a coarse one is created in a region where the change of variables is not remarkable. In the simulations performed in this work, 642,356 grids were generated by taking into account the accuracy of the solution and the cost required for analysis, and a non-uniform grid was used by dividing 27 compartments as presented in .
Figure 5. The computation mesh generated in this work.
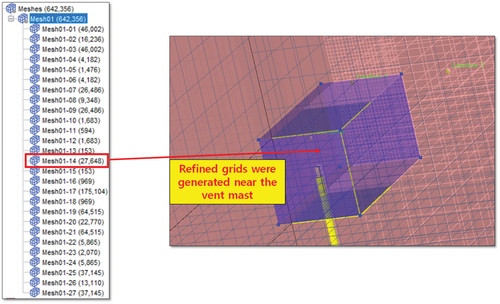
Among the 27 divided compartments, a refined grid was generated near the vent mast near which critical variables are expected to change greatly during the simulation. The number of grids generated in each compartment and the zoomed view of the vent mast are depicted in .
Figure 6. The number of grids generated in each compartment and the zoomed view of the vent mast.
Boundary conditions
For simulations with high accuracy using computational fluid dynamics, it is important to apply appropriate initial and boundary conditions. These specific boundary conditions applied to the gas dispersion simulation using PyroSim are presented below. According to the PyroSim user manual, the meaning of each boundary condition is as follows:
Open: refers to an opening on the boundary of the computational domain
Inert: refers to a smooth wall
Supply: refers to the part where defined gas is injected
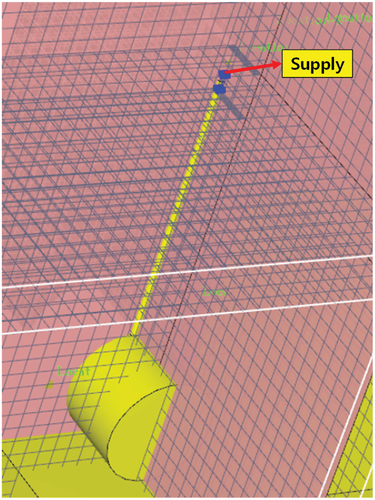
For the background domain, since the ship is assumed to be located in an infinite open sea rather than a restricted area, the surfaces located on the bow, stern, starboard, port, and upper part of the ship were set as “Open” boundary conditions. The wind direction/speed is set in the boundary conditions located on the surfaces of the bow, stern, starboard, and port, which are located on a horizontal plane to implement the desired environmental conditions. In the case of gas dispersion simulation, since it is not necessary to consider the interaction between the ship and the free water surface, the surface located on the upper part of the ship was set as an “Inert” boundary condition (). In addition, the hull of the ship, except for the vent mast, was also set as an “Inert” boundary condition (). To implement the leakage phenomenon on the vent mast, which is a crucial boundary condition for the gas dispersion simulation, a “Supply” boundary condition was set (). In the “Supply” boundary condition, the volume flow rate of the leaked fluid was set to 0.028 m3/s and ammonia was selected as the leaked gas according to the scenario.
Figure 7. The boundary conditions applied to the background domain.
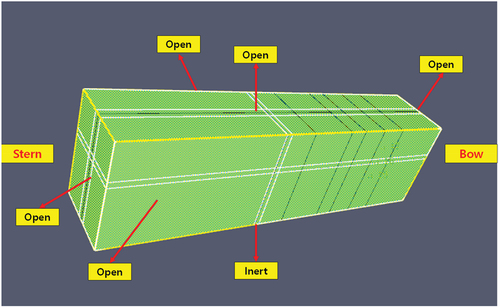
Figure 8. The boundary condition applied to the ship.
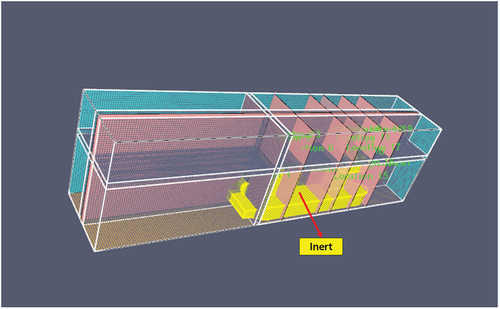
Figure 9. The boundary condition applied to the upper part of the vent mast.
Gas detector installation
To measure the concentration of leaked ammonia gas, 21 gas detectors were installed in the external areas of the ship as shown in , and a series of ammonia dispersion simulations were performed. Among the installed detectors, detectors 1 to 3 were installed near the vent mast, where a high concentration of ammonia can be measured in the event of a gas leak. However, considering the height of the vent mast, it is believed that the measurement locations of detectors 1 to 3 have little correlation with the safety of the ship in the event of a gas leak. The external areas of the ship, which were carefully considered and investigated in this study, are the locations of detectors 4 to 21, which are areas closely related to the crew’s work locations and major equipment/areas of the ship. Based on the ship coordinate system shown in , the detailed locations of the installed detectors are presented in .
Figure 10. The locations of the gas detectors installed.
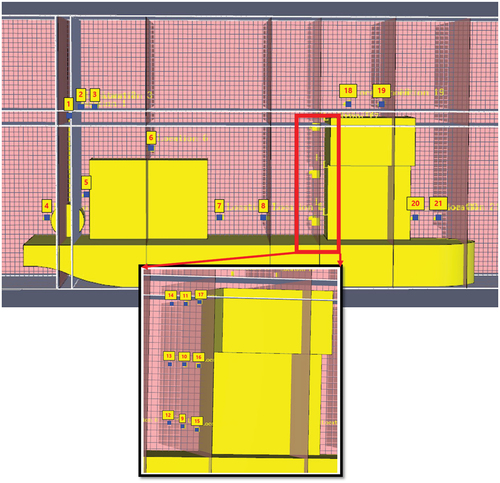
Figure 11. Ship coordinate system.
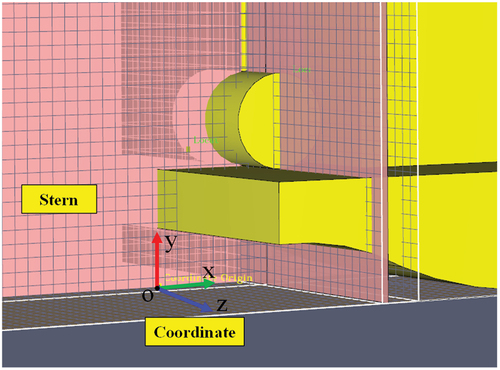
Table 4. The coordinates of the detectors.
Star-ccm+ model
Mesh resolution
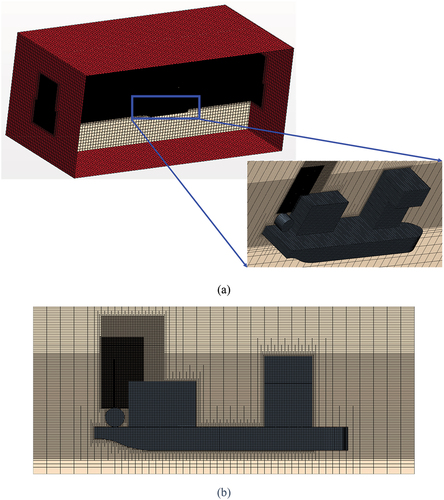
The automatic mesh generation capability of STAR-CCM+ was utilized to create the mesh for the computational domain suitable for the finite volume method (FVM). The mesh was generated using the Surface Remesher tool to create the mesh for the ship surface and the Trimmed Cell Mesher tool to create the mesh for the space excluding the surface. The generated mesh consisted of hexahedral cells, and as in the mesh generation performed in PyroSim, refined meshes were constructed in areas where variables such as velocity, pressure, and temperature vary significantly with location, such as near the vent mast where ammonia leakage occurs, while coarse meshes were used in areas where variable changes are not significant. In consideration of the precision of the solution and the cost of the analysis, 928,826 cells were generated within STAR-CCM+. depicts the non-uniform grid generated.
Figure 12. Computational grids generated in Star-ccm+.
Boundary conditions
In the gas dispersion simulation performed in STAR-CCM+, it is also important to apply appropriate initial and boundary conditions. The detailed boundary conditions of the gas dispersion model modelled in STAR-CCM+ are shown in . The meaning of each boundary condition, according to the STAR-CCM+ user manual, is as follows:
Figure 13. The boundary conditions applied to the gas dispersion CFD model.
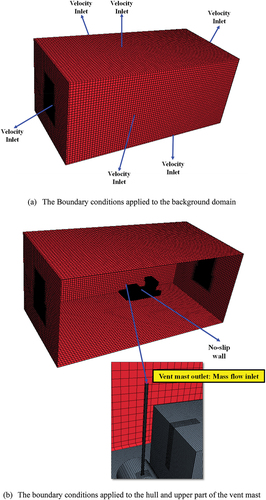
Velocity inlet: refers to the opening at the boundary of the computational domain
No-slip wall: Refers to a smooth wall
Mass flow inlet: Refers to the area where a defined gas is injected
For the background domain, which assumes that the ship is in an infinite open sea rather than a restricted area, the surfaces located on the bow, stern, starboard, port, upper, and lower parts of the ship were set as “Velocity inlet.” The environmental conditions were implemented by setting the wind direction/speed for the surfaces located on the horizontal plane, i.e., the bow, stern, starboard, and port of the ship. The velocity of the fluid adjacent to the ship’s wall was set to 0 by applying the boundary condition of “No-slip wall” which is necessary for modeling the ship’s hull. To implement the leakage phenomenon in the upper part of the vent mast, which is an important boundary condition for gas dispersion simulations, the boundary condition of “Mass flow inlet” was applied. In the “Mass flow inlet” boundary condition, the mass flow rate of the leaked substance should be set. In this study, the leaked gas was set as ammonia with a mass flow rate of 0.02041 kg/s (= volume flow: 0.028 m3/s) depending on the scenario.
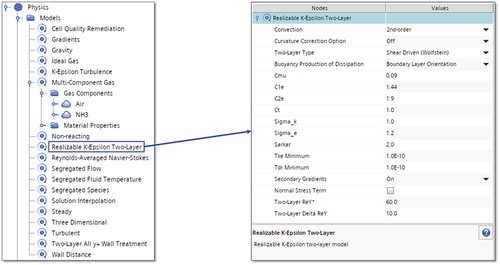
In order to effectively consider the turbulence that occurs during gas leakage, the turbulence model adopted in this study is Realizable K-Epsilon Two-Layer which is widely used in the field of gas dispersion simulations. In addition, the SIMPLE (Semi-Implicit Method for Pressure-Linked Equations) algorithm was used for the pressure-velocity coupling during computations. The detailed physical characteristics applied in STAR-CCM+ including the turbulence model are shown in .
Figure 14. The physics adopted in Star-ccm+.
Gas detector installation
Similar to the gas dispersion CFD model developed in PyroSim, 21 gas detectors were installed, and ammonia dispersion simulations were performed in Star-ccm+.
Step 3: gas dispersion simulations
Based on the procedure reported in Step 2 (Numerical modelling), the CFD model for ammonia gas dispersion was developed using PyroSim and Star-ccm+ software. During the simulations, the gas leakage and external environmental conditions were chosen according to . Each case of the simulation was terminated when the analysis results reached a steady-state condition, and approximately 72 wall clock hours using 8 CPU processors were required to achieve a steady-state for each simulation case.
Step 4: results
Grid sensitivity study
In this study, the gas dispersion simulation was performed using PyroSim software with approximately 640,000 grids, taking into account the accuracy of the solution and the computational cost. The appropriate number of grids for the simulation was determined through the grid sensitivity analysis. Three different grid generations were performed for the sensitivity study, resulting in a computation mesh of about 400,000/640,000/930,000 cells in total, respectively. It has to be stated that gas concentration measurements were taken near the vent mast at three locations: (1.5, 0, 6.9), (2.3, 0, 7.3), and (2.6, 0, 7.3). The simulation for each case was terminated when the analysis results reached steady-state, and it took approximately 72 wall clock hours using eight CPU processors to reach steady-state. The grid sensitivity analysis results are presented in .
Figure 15. The results of the grid sensitivity study.
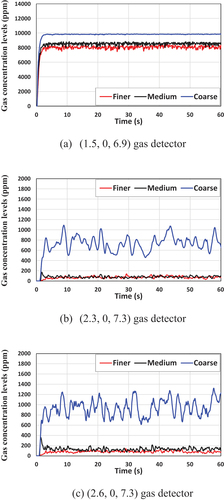
As presented in the figure, the simulation results for the medium and refined grids at three detector locations, measured in the grid sensitivity study, exhibited similar trends when they reached a steady state condition. In contrast, it can be seen that the results obtained from the coarse grid were significantly different from the ones for the medium and refined grids. Given this, in this study, a simulation using approximately 640,000 cells for the medium grid was performed as it is expected to yield results similar to those obtained using the refined grid, while also considering computational cost and solution accuracy.
Simulation results
The simulation results for the gas dispersion, which are carried out by means of PyroSim and Star-ccm+ software, are presented in . A series of views of the ammonia dispersion tendencies for all cases are included in the Appendix.
Table 5. Results for the gas dispersion simulation, obtained from PyroSim.
Table 6. Results for the gas dispersion simulation, obtained from Star-ccm+.
The results reported in the tables show that the gas dispersion simulations conducted using ProSim and Star-ccm+ produced similar trends in gas concentrations based on the applied external condition. Specifically, the gas concentrations measured at the critical external areas of 4 to 21 (gas detectors) were consistently revealed to be below 30 ppm (0.003% vol/vol) in all scenarios, indicating that even in the event of ammonia leakage during ship operation, the target vessel can ensure safe operation.
It can be seen that gas detectors 1 to 3 measured higher gas concentrations than detectors 4 to 21 due to their proximity to the vent mast where the gas leakage originates. Although the measured gas concentration is remarkably high in these locations (detectors 1 to 3), taking into account the height of the vent mast, it is not considered a significant risk factor for the safe operation of the target vessel.
Overall, it is found from the results that ProSim and Star-ccm+ software are reliable for predicting gas concentrations under various external conditions, providing similar and promising results; in addition to this, the target vessel can safely operate under the subjected conditions.
To account for the realistic geographic characteristics, this study also performed a simulation of a vessel departing from the South Port Management Office and entering Gamman Wharf along the designated route. The present study also considered the annual climate characteristics of Busan Port, applying the environmental conditions of north winds in winter and south winds in summer. The simulation results are presented in .
Figure 16. Gas dispersion simulation during ship operation (condition: winter, south wind 20 kts).
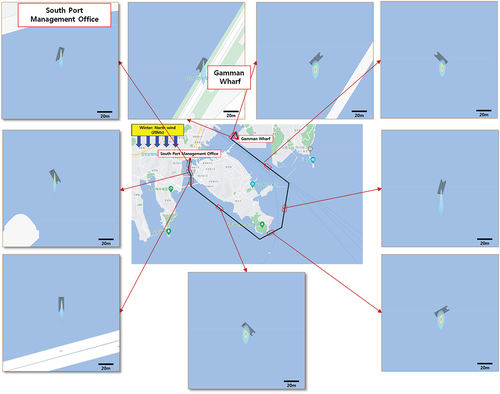
Figure 17. Gas dispersion simulation during ship operation (condition: summer, south wind 20 kts).
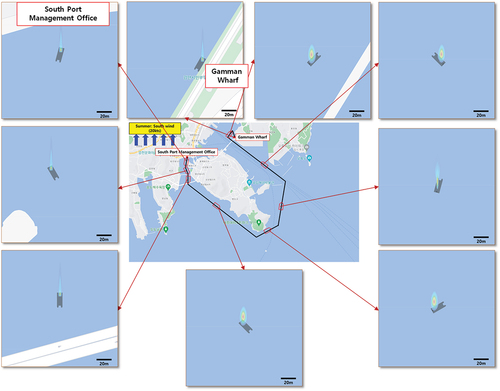
Based on the simulation results, it can be concluded that most of the route is safe for vessel operation, except for specific areas that require caution. During winter, gas dispersion occurs towards the coast during vessel operation near the South Port Management Office, which poses no significant safety issues. However, during operation/entry near Gamman Wharf, caution is necessary for gas diffusion towards the port. Conversely, during the summer, gas dispersion towards the coast occurs during operations or entries near Gamman Wharf, with no safety concerns. However, caution is necessary for gas dispersion toward the port during operations near the South Port Management Office.
Therefore, it is crucial to take appropriate safety measures for gas dispersion towards the port in specific areas during vessel operation/entry, depending on the season and geographic location. The simulation results in this study are expected to provide valuable insights for enhancing safety protocols and optimizing vessel operations in the region.
Conclusions
It is expected that if the safety valve is opened, a large amount of ammonia (100%) can be released into the atmosphere through the vent mast due to the high internal pressure of the ammonia tank. Therefore, it is considered that determining the position and height of the vent mast is one of the most critical parts of safety design.
In this study, a series of ammonia gas dispersion simulations were carried out by means of CFD numerical simulation. It was revealed that even if ammonia is released through the vent mast on the ship operating at sea, it would not pose a significant risk to the residential and nearby areas on the ship. In particular, the height of the vent mast is at least 4 m above the exposed deck of the ship, and leakage occurred at a pressure of over 8 bar, so it was observed that the gas dispersion rate is predicted to be fast. Moreover, since ammonia gas has a lower density than air, it is expected to diffuse upward when released into the atmosphere, reducing the likelihood of exposure to humans. However, it is thought that the size of the ammonia tank and the amount of release through the vent mast on large ships will be significantly larger than those on the subjected vessel, and, therefore, additional safety analyses should be conducted.
Disclosure statement
No potential conflict of interest was reported by the author(s).
References
- DNV. (2021). AMMONIA BUNKERING OF PASSENGER VESSEL - CONCEPT QUANTITATIVE RISK ASSESSMENT Green Coastal Shipping Programme (Grønt Skipfartsprogram).
- Gerdroodbary, M. B., Mokhtari, M., Bishehsari, S., & Fallah, K. (2016). Mitigation of ammonia dispersion with mesh barrier under various atmospheric stability conditions. Asian Journal of Atmospheric Environment, 10(3), 1–15. https://doi.org/10.5572/ajae.2016.10.3.125
- Hrenov, G., Reinhold, K., Järvis, M., Tint, P., & Prause, G. (2022). Managing the Hazards of Ammonia in Seaports as a Potential Alternative Fuel for Green Shipping. In M. P. Brito, T. Aven, P. Baraldi, M. Čepin, E. Zio, & ESREL2023 Organizers (Eds.), Proceedings of the 33rd European Safety and Reliability Conference (ESREL 2023). Research Publishing, Singapore. https://doi.org/10.3850/978-981-18-8071-1_P399-cd
- Jang, H., Mujeeb-Ahmed, M. P., Wang, H., Park, C., Hwang, I., Jeong, B., Zhou, P., & Mickeviciene, R. (2023). Regulatory gap analysis for risk assessment of ammonia-fuelled ships. Ocean Engineering, 287, 115751. https://doi.org/10.1016/j.oceaneng.2023.115751
- Jeong, S. Y., Jang, D., & Lee, M. C. (2022). Property-based quantitative risk assessment of hydrogen, ammonia, methane, and propane considering explosion, combustion, toxicity, and environmental impacts. Journal of Energy Storage, 54, 105344. https://doi.org/10.1016/j.est.2022.105344
- LR. (2020). Hydrogen and Ammonia infrastructure, safety and risk information and guidance (Report No. PRJ11100256122r1, rev. 00).
- Tan, W., Du, H., Liu, L., Su, T., & Liu, X. (2017). Experimental and numerical study of ammonia leakage and dispersion in a food factory. Journal of Loss Prevention in the Process Industries, 47, 129–139. https://doi.org/10.1016/j.jlp.2017.03.005
- Tan, Z., Li, J., & Hu, G. (2014). Risk assessment and countermeasures of gas accidents in the sensitive areas under control during the Olympic Games in Beijing. Journal of Safety Science, 62, 187–204. https://doi.org/10.1016/j.ssci.2013.08.008
- Techniclsafetybc. (2021). Case Study: Ammonia Release Incidents (2007 – 2017). https://www.technicalsafetybc.ca/case-study-ammonia-release-incidents-2007-2017.
- Windfinder. (2018). Wind, Waves & Weather Forecast [ cited 2019]. https://www.windfinder.com/forecast/donghae.
- Yarandi, M. S., Mahdinia, M., Barazandeh, J., & Soltanzadeh, A. (2021). Evaluation of the toxic effects of ammonia dispersion: Consequence analysis of ammonia leakage in an industrial slaughterhouse. Medical Gas Research, 11(1), 24. https://doi.org/10.4103/2045-9912.310056