
ABSTRACT
Macrocystis pyrifera is a foundation species that creates kelp forests and supports essential ecosystem services across coastal environments. Over the past half-century, more than 95% of giant kelp forests have declined around Tasmania, Australia, due to climate change, causing a near-complete loss of the ecosystems and services they support. Compared with northern hemisphere giant kelp ecosystems, Australian populations have received little research attention in genomic and other genetic analyses. We present the complete mitochondrial and chloroplast genomes of Macrocystis pyrifera from Tasmania. Both organellar genomes were similar to published Laminariales genomes in length, GC content, gene composition and synteny. A phylogeny constructed by combining protein-coding genes from both genomes showed Tasmanian specimens clustered with M. pyrifera specimens from the northern hemisphere. Genetic differences in protein genes between the Tasmanian M. pyrifera and the northern hemisphere specimens were overall low, but some ribosomal protein genes presented higher values of nonsynonymous mutations. The most divergent gene, the mitochondrial conserved hypothetical protein ORF377, can provide insights into the evolution of the species. This gene has been proposed as a suitable molecular marker for population genetic research in Fucales and may also be helpful for intraspecific studies of M. pyrifera. The complete mitochondrial and chloroplast genomes of Tasmanian M. pyrifera provide important genetic data and critical information for further evolutionary and population studies and for managing these endangered and disappearing populations.
Introduction
Macrocystis pyrifera (Linnaeus) C.Agardh (Laminariales, Ochrophyta), commonly known as giant kelp, is a rapidly growing foundation species that forms tall kelp forests. Giant kelp forests support productive and diverse communities and provide essential ecosystem services to coastal environments (Schiel & Foster, Citation2015). Changes in regional oceanography and environmental conditions, including warming waters and declines in coastal nutrients, have been associated with ~95% declines in giant kelp coverage around Tasmania since the 1940s (Butler, Lucieer, Wotherspoon, & Johnson, Citation2020; Johnson et al., Citation2011). Recently, efforts have been made to restore these disappearing kelp forests in Tasmania, using selective breeding and seeding populations from remnant locations (Layton & Johnson, Citation2021; Layton et al., Citation2020). Despite the importance of M. pyrifera in Tasmania, there is limited genomic information to represent the species from the southern hemisphere.
Until recently, the genus Macrocystis was divided into four species based mainly on the morphology of the blades and holdfast. However, the morphological variability is probably driven by environmental effects on the early development of the sporophytes, and all species have collapsed into M. pyrifera (Demes, Graham, & Suskiewicz, Citation2009). Posterior DNA barcoding studies supported the recognition of a single species (Macaya & Zuccarello, Citation2010a). This taxonomic revision turned M. pyrifera into the only kelp present in both the northern and southern hemispheres. In the northern hemisphere, it is present along the North American west coast, while in the southern hemisphere, it is relatively widespread across temperate and sub-Antarctic coasts (Graham, Vasquez, & Buschmann, Citation2007; Mora‐Soto et al., Citation2021). Although there is a broader distribution of M. pyrifera across the southern hemisphere, there is only information on mitochondrial and chloroplast genomes from individuals from the northern hemisphere. Overall, there have been few genetic studies surveying giant kelp populations from the southern hemisphere, and these were based on a few molecular markers or microsatellites (Astorga, Hernández, Valenzuela, Avaria-Llautureo, & Westermeier, Citation2012; Camus, Faugeron, & Buschmann, Citation2018; Coyer, Smith, & Andersen, Citation2001; Durrant, Barrett, Edgar, Coleman, & Burridge, Citation2015; Macaya & Zuccarello, Citation2010a, Citation2010b). These molecular markers, especially the organellar genes cox1 and rbcL, showed a low divergence between giant kelp populations (Durrant, Barrett, Edgar, Coleman, & Burridge, Citation2015). Mitochondrial and chloroplast genomes provide greater insight into evolutionary questions and can generate robust phylogenies (Iha et al., Citation2018). These data may also be helpful in finding more suitable molecular markers for genetic population analyses. Therefore, here we present the full mitochondrial and chloroplast genomes of Macrocystis pyrifera from Tasmania to increase our understanding of the differences between organellar genomes from northern and southern hemisphere populations and to facilitate future research.
Material and methods
Collection, DNA extraction and sequencing
To obtain the organellar genomes, we collected approximately 30 cm of the apical lamina from an adult M. pyrifera sporophyte at Blackmans Bay, Tasmania, Australia (43°01’02.4“S, 147°19’45.8“E). The tissue was rinsed in deionized water and dried on absorbent paper. Small samples, ~3 cm2, were cut from the thinnest portions of the lamina and stored in silica gel. Qiagen DNeasy PowerPlant Pro Kit was used for DNA extraction, following the modified method outlined by Peters, Waters, Dutoit, & Fraser (Citation2020). Samples were soaked for 24 h at 65°C in 500 µl of PowerBead solution and 3 µl of RNase A. After incubation, 100 µl of isopropanol was added and incubated at 65°C for 90 min, with vortexing every 30 min. Samples were then placed in a FASTPREP-24™ 5 G homogenizer (MP Biomedicals, Santa Ana, California, USA) for 40 s. Subsequent steps followed the manufacturer’s protocols, with elution of DNA in 100 µl of TE buffer, incubated for 10 min before centrifugation. The DNA library and whole-genome sequencing were carried out by the Australian Genome Research Facility (Melbourne, Australia). Sequencing was performed on Illumina NovaSeq 500 using PE 150 bp High Output kit (Illumina, San Diego, California, USA).
Genome assembly and annotation
Read quality was checked using FASTQC v.0.11.8 (Andrews, Citation2010), and pair reads were trimmed using Trimmomatic 0.38 (Bolger, Lohse, & Usadel, Citation2014) using the parameter SLIDINGWINDOW:4:20 HEADCROP:14 MINLEN:120. We performed an initial genome assembly with SPAdes v. 3.15.3 (Prjibelski, Antipov, Meleshko, Lapidus, & Korobeynikov, Citation2020), setting different k-mer sizes (−k) 21,33,55 and isolate flags (–isolate). We identified the mitochondrial and chloroplast contigs using BLASTn search against published M. pyrifera genomes (mitochondrion: MH411105; chloroplast: MZ156032). The SPAdes assembly did not recover the entire genomes. Therefore, we performed another assembly with NOVOplasty (Dierckxsens, Mardulyn, & Smits, Citation2016) using the longest SPAdes contig for each genome as a seed, resulting in both organellar genomes as completed and circular. We checked the assemblies by mapping the reads against the genomes using Bowtie2 v.2.4.4 (Langmead & Salzberg, Citation2012). Both mitochondrial and chloroplast genomes were annotated using MFannot (https://megasun.bch.umontreal.ca/cgi-bin/mfannot/mfannotInterface.pl), RNAweasel (https://megasun.bch.umontreal.ca/cgi-bin/RNAweasel/RNAweaselInterface.pl) and ARAGORN (http://www.ansikte.se/ARAGORN/). The automatic organellar genome tools above did not recover the ribosomal 5S RNA for the chloroplast genome, and we searched for this gene in the 5SrRNAdb (http://combio.pl/rrna; Szymanski, Zielezinski, Barciszewski, Erdmann, & Karlowski, Citation2016).
Phylogenetic and genomic analysis
To perform the phylogenetic analyses, we selected 12 Laminariales species available in GenBank for each mitochondrial and chloroplast genome (Supplementary table S1). We extracted the coding genes from each genome in Geneious Prime® v2022.1.1 (Biomatters, Auckland, New Zealand), which were translated to protein sequences with SeqKit v2.1.0 (Shen, Le, Li, Hu, & Zou, Citation2016) using the subcommand “translate” and setting the genetic code standard (1) for mitochondrial genes and bacterial code (11) for chloroplast genes. For each protein, we created a matrix aligning the amino acid sequences with MUSCLE v5.0.1430 (Edgar, Citation2004). We concatenated all mitochondrial and chloroplast protein matrixes to generate a supermatrix using FASconCAT-G script (https://github.com/PatrickKueck/FASconCAT-G). The phylogeny was constructed with IQtree 2.0.7 (Minh et al., Citation2020). ModelFinder (Kalyaanamoorthy, Minh, Wong, von Haeseler, & Jermiin, Citation2017) was used to select the best-fit model for each gene, with 1000 ultrafast bootstrap replicates (Hoang, Chernomor, von Haeseler, Minh, & Vinh, Citation2018) and with Chorda asiatica Sasaki & Kawai, Pseudochorda nagaii (Tokida) Inagaki and Akkesiphycus lubricus Yamada & Tanaka as outgroups. We also constructed phylogenies for each organelle using the same approach described above.
There was one mitochondrial and chloroplast genome each of M. pyrifera from the Northern Hemisphere available in GenBank at the time of the development of this research. We used these genomes to perform comparative genomic analysis and calculate evolutionary rates for protein-coding genes. For the chloroplast genome (accession number: MZ156032), we used a specimen from British Columbia, Canada (Starko et al., Citation2021). The currently available M. pyrifera mitochondrial genome (accession number: MH411105) belongs to a specimen from Perharidy, France (Chen, Zang, Shang, & Tang, Citation2019). While the original population of that specimen is unclear because M. pyrifera is not naturally found in Europe, and those individuals were introduced to the Brittany coast in France in the early 1970s, they probably originated from California (Boalch, Citation1981). We reconstructed a haplotype network for the cytochrome c oxidase subunit I gene (cox1) to investigate the origin of M. pyrifera in France. We extracted the partial cox1 sequence from the mitochondrial genome of the French specimen and aligned it with cox1 sequences obtained by Macaya & Zuccarello (Citation2010a) & and Durrant, Barrett, Edgar, Coleman, and Burridge (Citation2015). The reconstruction was performed with the minimum spanning method using PopART v.17 (Leigh, Bryant, Nakagawa, & Nakagawa, Citation2015).
The genomic architecture was compared using the MAUVE plugin in Geneious Primer. We calculated the pairwise divergence, synonymous substitution (dS) and nonsynonymous substitution (dN) rates for each coding gene between the Tasmanian M. pyrifera and the northern hemisphere specimens. We aligned the genes at the codon level with PRANK v.170427 (Löytynoja, Citation2014). The uncorrected pairwise distances were calculated with mothur 1.46.1 (Schloss et al., Citation2009) using “dist.seqs” command. dN and dS rates were calculated using CODEML command from PAML v4.9 (Yang, Citation2007), setting the runmode as “pairwise”. Plots were constructed using ggplot2 v3.3.5 (Wickham, Citation2016).
Results and discussion
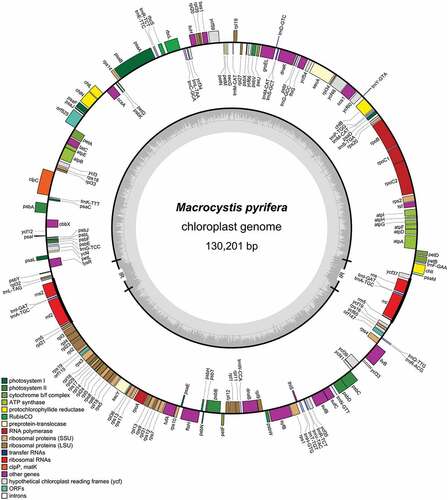
The mitochondrial (; GenBank accession: ON227496) and chloroplast (; GenBank accession: ON227495) genomes were similar to published Laminariales genomes in length, GC and gene content (Starko et al., Citation2021). The length of the mitochondrial genome () was 37,326 bp and had 31.8% GC content. The gene content was 37 protein-coding genes, including two widely conserved open reading frame (ORF) genes, three ribosomal (LSU, SSU and 5S rRNA) and 25 transfer RNA genes. None of the genes was found to contain introns. The chloroplast genome () was 130,201 bp long and had 30.9% GC content. It contained 142 protein-coding genes, including three widely conserved ORF genes, 28 tRNAs and two copies of LSU, SSU and 5S ribosomal RNAs situated in duplicated and reversed regions. The tRNA for leucine (tRNA-Leu) contains a group I intron, which is conserved in Laminariales plastomes (Starko et al., Citation2021).
Figure 1. Macrocystis pyrifera mitochondrial genome map.
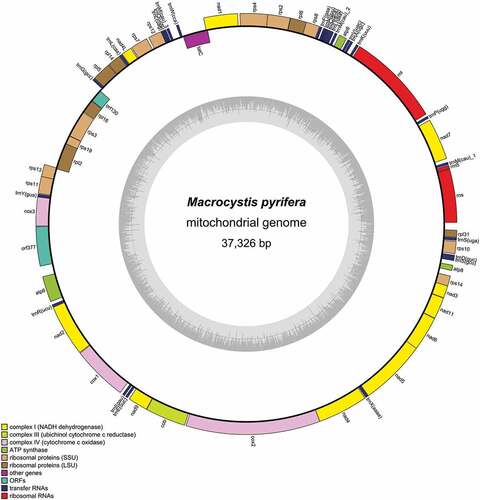
Figure 2. Macrocystis pyrifera chloroplast genome map.
Our phylogenetic analysis aimed to put the Tasmanian M. pyrifera in a phylogenetic context. As expected, Tasmanian M. pyrifera clustered with northern hemisphere specimens in the combined mitochondrial and chloroplast phylogeny (). The phylogenetic reconstruction was strongly resolved, almost all congruent with the prior Laminariales phylogeny based on combined chloroplast, mitochondrial and ribosomal genes (Starko et al., Citation2019). The incongruence is found within the Alariaceae family, represented here with Undaria pinnatifida (Harvey) Suringar, Alaria crispa Kjellman, Lessoniopsis litoralis (Tilden) Reinke and Pterygophora californica Ruprecht. Alaria crispa clustered with a low-supported clade formed by Lessoniopsis littoralis and Pterygophora californica in our tree (), while the Alaria genus was close to Undaria pinnatifida in the previous phylogenetic reconstruction (Starko et al., Citation2019). The chloroplast phylogeny was similar to the combined phylogenetic tree, while the internal branching in the Alariaceae clade was not supported in the mitochondrial tree (Supplementary fig S1). Conflicting evolutionary history between mitochondrial and chloroplast phylogenies of brown algae and other algal lineages is common, and chloroplast phylogenies have been shown to be more powerful in constructing better-resolved phylogenies (Lyra et al., Citation2021; Starko et al., Citation2019). Understanding the evolutionary factors that may cause phylogenetic incongruencies is beyond the scope of this study.
Figure 3. (a) Maximum likelihood phylogeny combining concatenated coding sequences from mitochondria and chloroplasts. Ultrafast bootstrapping is shown in the support values, only above 90%. (b) Haplotype network for cox1 from Macrocystis pyrifera. Haplotypes were obtained from Macaya et al. (2010) and Durrant, Barrett, Edgar, Coleman, & Burridge (Citation2015), in which each haplotype represented only one sequence. Mutations are shown as hatch marks in connecting lines. Haplotypes are shaded according to geographic origin. (c) Whole-genome alignment built with MAUVE. Locally Collinear Blocks (LCBs; light red) show high similarities between genomes from southern and northern hemisphere individuals. Below LCB, gene synteny of each genome is shown: ribosomal RNA genes in red, coding genes in white and transfer RNA genes in green. Orange blocks in chloroplast genomes indicate repeat regions.

Our haplotype network analysis strongly indicates that the French M. pyrifera was originally from the northeast Pacific (). The partial cox1 sequence from the French specimen is identical to the haplotype 2 (H2) that shared sequences with samples from California and Canada (Macaya & Zuccarello, Citation2010a). The haplotype from the Tasmanian M. pyrifera specimen is identical to previous sequences obtained from the southern part of Australia, including Tasmania (Durrant, Barrett, Edgar, Coleman, & Burridge, Citation2015), and New Zealand, located in haplotype 1 (H1) (; Macaya & Zuccarello, Citation2010a).
The gene composition and synteny between Tasmanian and northern hemisphere specimens for either organelle genome showed no difference, and the nucleotide composition was very similar throughout the genome (). Considering only coding genes (proteins), the divergences were also low (), but mitochondrial protein genes presented higher pairwise divergence, 1.14% on average, compared to chloroplast genes, with 0.15% on average (, , Supplementary table S2). Previous studies have demonstrated that the genetic diversity in mitochondrial sequences of M. pyrifera worldwide is low (Macaya & Zuccarello, Citation2010a, Citation2010b) and that plastid sequences have lower diversity than mitochondrial ones (Durrant, Barrett, Edgar, Coleman, & Burridge, Citation2015). The same was observed with synonymous (dS) and non-synonymous (dN) substitution rates, which were low comparing organelle genes from northern hemisphere and Tasmanian M. pyrifera (), and mitochondrial rates were higher than chloroplast rates. Almost half of the plastid genes (67) did not show any divergence, and from the 74 genes where divergence was present, only 40 showed a non-synonymous mutation (Supplementary table S2). This general low genetic diversity may indicate that mitochondrial and plastid genomes are under strong constraint (Starko et al., Citation2021) even between populations separated by the furthest geographic distances. It has been postulated that M. pyrifera originated from the northern hemisphere coast and experienced a recent dispersal to the southern hemisphere (Coyer, Smith, & Andersen, Citation2001; Estes & Steinberg, Citation1988; Macaya & Zuccarello, Citation2010a).
Figure 4. Genetic variation distribution of chloroplast and mitochondrial coding proteins. (a) uncorrected pairwise divergence, (b) synonymous substitution rate and (c) nonsynonymous substitution rate.
Table 1. The top 10 protein genes with the highest nonsynonymous substitution rates in chloroplast and mitochondrial genomes. dN, nonsynonymous substitution rates; dS, synonymous substitution rates.
Although the comparison between northern hemisphere M. pyrifera with Tasmanian specimens’ genomes does not show high differences, complete organellar genomes can give insights into this species’ evolution and provide useful data for studying the evolution of other brown algae. Most of the genes that had the highest dN values () are ribosomal proteins (rpl or rps), especially in the mitochondrion. Ribosomal proteins are responsible for ribosome biogenesis and are crucial for protein synthesis. The nonsynonymous mutation would indicate a response to local adaptation. However, the effect of these mutations in those genes is unknown, and further research should be conducted to understand whether the nonsynonymous mutations are indeed related to the adaptation in different locations. The most divergent gene found among both mitochondrial and chloroplast genes is the conserved hypothetical protein ORF377 (), located between cox3 and atp6 () in the mitochondrial genome. It also presented the highest dN value. The gene function is unknown and does not present known conserved domains. Its higher divergence indicates that this gene may be a potential marker for genetic studies in M. pyrifera and other Laminariales, as its orthologue is present in all mitochondrial genomes from Laminariales sequenced so far. This region has been considered a strong candidate for genetic population studies in Fucales (Graf et al., Citation2017). Although this locus is potential to population studies in Laminariales, this gene is not widespread in Phaeophyceae. For example, it is absent in the mitochondrial genomes of Ectocarpus (Cock et al., Citation2010), Pylaiella (Oudot-Le Secq, Fontaine, Rousvoal, Kloareg, & Loiseaux-De Goer, Citation2001), Analipus (Starko et al., Citation2021) and Dictyota (Oudot-Le Secq, Loiseaux-de Goer, Stam, & Olsen, Citation2006).
Here, we provide novel and important genetic data for populations that may be on the verge of extinction – the giant kelp forests of southern Australia. These new organellar genomes of a southern hemisphere M. pyrifera specimen are essential for future genetic and evolutionary studies. Many genetic studies have used organellar markers with low genetic variation, such as cox1 and rbcL, that possibly hide the real genetic structure of this species. Our results identified a region in the mitochondrial genome that may be developed for future rapid genetic surveys, which may be valuable for the management of these endangered and disappearing M. pyrifera populations.
Author contribution
C. Iha: conceptualization, methodology, formal analysis, investigation, data curation, writing – original draft, writing – review & editing, visualization. C. Layton: conceptualization, resources, writing – review & editing. W. Flentje: writing – review & editing, project administration, funding acquisition. A. Lenton: writing – review & editing, project administration, funding acquisition. C. Johnson: conceptualization, resources, writing – review & editing. C.I. Fraser: conceptualization, writing – review & editing. A. Willis: conceptualization, writing – review & editing, project administration, funding acquisition, supervision.
Supplemental Material
Download PDF (112.8 KB)Supplemental Material
Download PDF (176 KB)Supplemental Material
Download PDF (276.4 KB)Disclosure statement
No potential conflict of interest was reported by the authors.
Supplementary data
Supplemental data for this article can be accessed online at https://doi.org/10.1080/26388081.2023.2193619.
Data availability statement
The data that support the findings of this study are openly available in GenBank (https://www.ncbi.nlm.nih.gov/genbank), accession number ON227496 for mitochondrion and ON227495 for chloroplast.
Correction Statement
This article has been republished with minor changes. These changes do not impact the academic content of the article.
Additional information
Funding
References
- Andrews, S. 2010. FastQC: A quality control tool for high throughput sequence data. http://www.bioinformatics.babraham.ac.uk/projects/fastqc/.
- Astorga, M. P., Hernández, C. E., Valenzuela, C. P., Avaria-Llautureo, J., & Westermeier, R. (2012). Origin, diversification, and historical biogeography of the giant kelps genus Macrocystis: evidences from bayesian phylogenetic analysis. Revista de Biología Marina Y Oceanografía, 47, 573–579. doi:10.4067/S0718-19572012000300019
- Boalch, G. T. 1981. Do we really need to grow Macrocystis in Europe? In: T. Levring. [Ed.] Xth International Seaweed Symposium: Proceedings Göteborg, Sweden August 11-15, 1980. Göteborg, Sweden, pp. 657–667.
- Bolger, A. M., Lohse, M., & Usadel, B. (2014). Trimmomatic: A flexible trimmer for Illumina sequence data. Bioinformatics, 30, 2114–2120. doi:10.1093/bioinformatics/btu170
- Butler, C. L., Lucieer, V. L., Wotherspoon, S. J., & Johnson, C. R. (2020). Multi-decadal decline in cover of giant kelp Macrocystis pyrifera at the southern limit of its Australian range. Marine Ecology Progress Series, 653, 1–18. doi:10.3354/meps13510
- Camus, C., Faugeron, S., & Buschmann, A. H. (2018). Assessment of genetic and phenotypic diversity of the giant kelp, Macrocystis pyrifera, to support breeding programs. Algal Research, 30, 101–112. doi:10.1016/j.algal.2018.01.004
- Chen, J., Zang, Y., Shang, S., & Tang, X. (2019). The complete mitochondrial genome of the brown alga Macrocystis integrifolia (Laminariales, Phaeophyceae). Mitochondrial DNA Part B, 4, 635–636. doi:10.1080/23802359.2018.1495114
- Cock, J. M., Sterck, L., Rouze, P., Scornet, D., Allen, A. E., Amoutzias, G., Anthouard, V., Artiguenave, F., Aury, J. M., Badger, J. H., Beszteri, B et al. (2010). The Ectocarpus genome and the independent evolution of multicellularity in brown algae. Nature, 465, 617–621. doi:10.1038/nature09016
- Coyer, J. A., Smith, G. J., & Andersen, R. A. (2001). Evolution of Macrocystis SPP. (Phaeophyceae) as determined by ITS1 and ITS2 sequences. Journal of Phycology, 37, 574–585. doi:10.1046/j.1529-8817.2001.037001574.x
- Demes, K. W., Graham, M. H., & Suskiewicz, T. S. (2009). Phenotypic plasticity reconciles incongruous molecular and morphological taxonomies: The giant kelp, Macrocystis (Laminariales, Phaeophyceae), is a monospecific genus. Journal of Phycology, 45, 1266–1269. doi:10.1111/j.1529-8817.2009.00752.x
- Dierckxsens, N., Mardulyn, P., & Smits, G. (2016). Novoplasty: de novo assembly of organelle genomes from whole genome data. Nucleic Acids Research, 45, e18. doi:10.1093/nar/gkw955
- Durrant, H. M. S., Barrett, N. S., Edgar, G. J., Coleman, M. A., & Burridge, C. P. (2015). Shallow phylogeographic histories of key species in a biodiversity hotspot. Phycologia, 54, 556–565. doi:10.2216/15-24.1
- Edgar, R. C. (2004). MUSCLE: Multiple sequence alignment with high accuracy and high throughput. Nucleic Acids Research, 32, 1792–1797. doi:10.1093/nar/gkh340
- Estes, J. A., & Steinberg, P. (1988). Predation, herbivory, and kelp evolution. Paleobiology, 14, 19–36. doi:10.1017/S0094837300011775
- Graf, L., Kim, Y. J., Cho, G. Y., Miller, K. A., Yoon, H. S., & Li, X. -Q. (2017). Plastid and mitochondrial genomes of Coccophora langsdorfii (Fucales, Phaeophyceae) and the utility of molecular markers. PLoS One, 12, e0187104. doi:10.1371/journal.pone.0187104
- Graham, M. H., Vasquez, J. A., & Buschmann, A. H. (2007). Global ecology of the giant kelp Macrocystis: From ecotypes to ecosystems. Oceanography and Marine Biology, 45, 39–88.
- Hoang, D. T., Chernomor, O., von Haeseler, A., Minh, B. Q., & Vinh, L. S. (2018). Ufboot2: Improving the ultrafast bootstrap approximation. Molecular Biology and Evolution, 35, 518–522. doi:10.1093/molbev/msx281
- Iha, C., Grassa, C. J., Lyra, G. M., Davis, C. C., Verbruggen, H., Oliveira, M. C., & Müller, K. (2018). Organellar genomics: A useful tool to study evolutionary relationships and molecular evolution in Gracilariaceae (Rhodophyta). Journal of Phycology, 54, 775–787. doi:10.1111/jpy.12765
- Johnson, C. R., Banks, S. C., Barrett, N. S., Cazassus, F., Dunstan, P. K., Edgar, G. J. … Taw, N. (2011). Climate change cascades: Shifts in oceanography, species’ ranges and subtidal marine community dynamics in eastern Tasmania. Journal of Experimental Marine Biology and Ecology, 400, 17–32. doi:10.1016/j.jembe.2011.02.032
- Kalyaanamoorthy, S., Minh, B. Q., Wong, T. K. F., von Haeseler, A., & Jermiin, L. S. (2017). ModelFinder: Fast model selection for accurate phylogenetic estimates. Nature Methods, 14, 587–589. doi:10.1038/nmeth.4285
- Langmead, B., & Salzberg, S. L. (2012). Fast gapped-read alignment with Bowtie 2. Nature Methods, 9, 357–359. doi:10.1038/nmeth.1923
- Layton, C., Coleman, M. A., Marzinelli, E. M., Steinberg, P. D., Swearer, S. E., Vergés, A. … Johnson, C. R. (2020). Kelp forest restoration in Australia. Frontiers in Marine Science, 7, 74. doi:10.3389/fmars.2020.00074
- Layton, C., & Johnson, C. R. 2021. Assessing the feasibility of restoring giant kelp forests in Tasmania. Report to the National Environmental Science Program, Marine Biodiversity Hub.
- Leigh, J. W., Bryant, D., Nakagawa, S., & Nakagawa, S. (2015). Popart full-feature software for haplotype network construction. Methods in Ecology and Evolution, 6, 1110–1116. doi:10.1111/2041-210X.12410
- Löytynoja, A. (2014). Phylogeny-aware alignment with PRANK. In D. J (Ed.), In: Russell (pp. 155–170). Totowa, NJ: Humana Press.
- Lyra, G. M., Iha, C., Grassa, C. J., Cai, L., Zhang, H., Lane, C. … Davis, C. C. (2021). Phylogenomics, divergence time estimation and trait evolution provide a new look into the Gracilariales (Rhodophyta). Molecular Phylogenetics and Evolution, 165, 107294. doi:10.1016/j.ympev.2021.107294
- Macaya, E. C., & Zuccarello, G. C. (2010a). DNA barcoding and genetic divergence in the giant kelp Macrocystis (Laminariales). Journal of Phycology, 46, 736–742. doi:10.1111/j.1529-8817.2010.00845.x
- Macaya, E. C., & Zuccarello, G. C. (2010b). Genetic structure of the giant kelp Macrocystis pyrifera along the southeastern Pacific. Marine Ecology Progress Series, 420, 103–112. doi:10.3354/meps08893
- Minh, B. Q., Schmidt, H. A., Chernomor, O., Schrempf, D., Woodhams, M. D., von Haeseler, A., & Lanfear, R. (2020). IQ-TREE 2: New models and efficient methods for phylogenetic inference in the genomic era. Molecular Biology and Evolution, 37, 1530–1534. doi:10.1093/molbev/msaa015
- Mora‐Soto, A., Capsey, A., Friedlander, A. M., Palacios, M., Brewin, P. E., Golding, N., and Palmeirim, A. F. (2021). One of the least disturbed marine coastal ecosystems on Earth: Spatial and temporal persistence of Darwin’s sub‐Antarctic giant kelp forests. Journal of Biogeography, 48, 2562–2577. doi:10.1111/jbi.14221
- Oudot-Le Secq, M. P., Fontaine, J. M., Rousvoal, S., Kloareg, B., & Loiseaux-De Goer, S. (2001). The complete sequence of a brown algal mitochondrial genome, the ectocarpale Pylaiella littoralis (L.) Kjellm. Journal of Molecular Evolution, 53, 80–88. doi:10.1007/s002390010196
- Oudot-Le Secq, M. P., Loiseaux-de Goer, S., Stam, W. T., & Olsen, J. L. (2006). Complete mitochondrial genomes of the three brown algae (Heterokonta: Phaeophyceae) Dictyota dichotoma, Fucus vesiculosus and Desmarestia viridis. Current Genetics, 49, 47–58. doi:10.1007/s00294-005-0031-4
- Peters, J. C., Waters, J. M., Dutoit, L., & Fraser, C. I. (2020). SNP analyses reveal a diverse pool of potential colonists to earthquake-uplifted coastlines. Molecular Ecology, 29, 149–159. doi:10.1111/mec.15303
- Prjibelski, A., Antipov, D., Meleshko, D., Lapidus, A., & Korobeynikov, A. (2020). Using SPAdes De Novo Assembler. Current Protocols in Bioinformatics, 70, e102. doi:10.1002/cpbi.102
- Schiel, D. R., & Foster, M. S. (2015). The biology and ecology of giant kelp forests (p. 416). University of California Press, Oakland, CA.
- Schloss, P. D., Westcott, S. L., Ryabin, T., Hall, J. R., Hartmann, M., Hollister, E. B. … Weber, C. F. (2009). Introducing mothur: open-source, platform-independent, community-supported software for describing and comparing microbial communities. Applied and Environmental Microbiology, 75, 7537–7541. doi:10.1128/AEM.01541-09
- Shen, W., Le, S., Li, Y., Hu, F., & Zou, Q. (2016). SeqKit: A cross-platform and ultrafast toolkit for FASTA/Q file manipulation. PLoS One, 11, e0163962. doi:10.1371/journal.pone.0163962
- Starko, S., Bringloe, T. T., Gomez, M. S., Darby, H., Graham, S. W., Martone, P. T., & Piganeau, G. (2021). Genomic rearrangements and sequence evolution across brown algal organelles. Genome Biology and Evolution, 13, evab124. doi:10.1093/gbe/evab124
- Starko, S., Soto Gomez, M., Darby, H., Demes, K. W., Kawai, H., Yotsukura, N. … Martone, P. T. (2019). A comprehensive kelp phylogeny sheds light on the evolution of an ecosystem. Molecular Phylogenetics and Evolution, 136, 138–150. doi:10.1016/j.ympev.2019.04.012
- Szymanski, M., Zielezinski, A., Barciszewski, J., Erdmann, V. A., & Karlowski, W. M. (2016). 5srnadb: An information resource for 5S ribosomal RNAs. Nucleic Acids Research, 44, D180–3. doi:10.1093/nar/gkv1081
- Wickham, H. (2016). ggplot2: Elegant graphics for data analysis (p. 260). Springer cham, NewYork NY.
- Yang, Z. (2007). PAML 4: Phylogenetic analysis by maximum likelihood. Molecular Biology and Evolution, 24, 1586–1591. doi:10.1093/molbev/msm088