ABSTRACT
Leguminous farmland in China is severely polluted by antimony. Here, to explore the effects of antimony stress on rhizobia and soil microorganisms in leguminous plants, mung beans, kidney beans, and peanuts were grown in soil with different concentrations of Sb3+, Sb5+, and Sb3++Sb5+. Antimony had a promotional effect on soil sucrase and catalase activities and an inhibitory effect on urease activity. The effects of Sb3+ on sucrase, catalase, and urease activities were 3.3–11.1, 1.27–1.29, and 1.24–3.05 times those of Sb5+, respectively. Antimony reduced the rhizobial activity by 20.63–57.84%, with the inhibitory effect positively related to the antimony content. Additionally, the inhibitory effect of Sb3+ was 1.10–2.22 times that of Sb5+. This inhibition decreased the total nitrogen and ammonia nitrogen content in the soil. However, the decrease in Sb3+ was 0.46–1.54 times that of Sb5+. Sb3+ significantly altered the microbial activity.
1. Introduction
China currently holds 70–80% of the world’s antimony stockpile [Citation1], with 3.28 million tons of antimony ore reserves identified [Citation2]. With China’s rapid economic development, large amounts of antimony have entered the environment [Citation3,Citation4]. Antimony concentrations in the Taipu River basin in China have exceeded the standard on several occasions, affecting the normal operation of the Taipu River water source to varying degrees and even leading to the closure of the water intake at the downstream water source [Citation5]. Antimony levels in the contaminated Taipu River basin range from 21.00 to 115.50 mg·kg−1. Southwest China is a severely affected area of antimony pollution [Citation6]. Antimony concentrations in soil contaminated with heavy metals have been found to reach 36.793 mg·kg−1, which seriously increases the risk of cancer [Citation7]. A previous study found that the average antimony contents in the sediments of the Hunan tin mine and Yatta gold mine were 1,163 and 149 mg·kg−1, respectively, ranging from 57.17 to 7,315 mg·kg−1 and from 111 to 223 mg·kg−1, respectively [Citation8]. The detrimental effects of antimony on biological growth have been widely documented [Citation9]. Antimony is extremely mobile and readily enters plants [Citation10]. Farmland located near antimony smelters and chemical plants that contain antimony is seriously contaminated with antimony [Citation11]. The roots of some plants have a strong ability to absorb antimony, and can accumulate a large amount of trivalent and pentavalent antimony [Citation12]. In another study, researchers tested 34 plants and found that antimony concentrations ranged from 3.92 to 143.69 mg∙kg−1. These researchers found that plants in the Sargassaceae family had the highest antimony content (98.23 mg·kg−1), while plants in the Dryoptera family had the lowest antimony content (6.43 mg·kg−1) [Citation13]. The roots, stems, and leaves of Ficus plants commonly found in mining areas exhibit a strong antimony enrichment ability, and the highest antimony concentrations at the subcellular level are found in the cell wall (72.4%–87.5%) and cytoplasm (8.2%–18.6%) [Citation14]. The World Health Organization stipulates that the daily antimony intake of humans should not exceed 0.86 mg·kg−1 [Citation15], but in polluted areas, this value is easily exceeded. Antimony pollution increases the risk of human cancer and can also damage soil quality.
Antimony in the soil changes from Sb3+ to Sb5+, and the extent to which antimony changes influences its toxic effects in the soil. Most previous studies focused on the toxicity of trivalent antimony to the soil environment [Citation16]. Researchers have investigated the effects of Sb3+ on soil and microorganisms, including the distribution of microorganisms in antimony-contaminated soil [Citation17] and the potential applications of microorganisms in improving antimony-contaminated soil [Citation18], while fewer studies have explored the differences in soil toxicity between Sb3+, Sb5+, and mixed antimony. In this study, soils contaminated with different concentrations of Sb3+, and Sb5+, and mixed antimony were set up. Mung bean (Vigna radiata), kidney bean (Phaseolus vulgaris), and peanut (Arachis hypogaea Linn.) were planted into each group of soils to investigate the effects of antimony in different shelf states on the soil enzyme activity, soil nitrogen content, rhizobial activity, and microbial diversity; to analyze the differences in the effects of three types of antimony pollution on soil and microorganisms; and to explore the differences in toxicity between Sb3+ and Sb5+.
2. Materials and methods
2.1. Experimental materials
2.1.1 Test seeds
Mung bean, kidney bean, and peanut seeds were purchased from the Jing Yue seed market of Changchun City, Jilin Province, China
2.1.2 Soil configuration
The soil was sampled from the green area of Dong Hua University. The soil type and the estimated key chemical attributes and composition of the soil are listed below in .
Table 1. Basic physicochemical properties of test soil.
2.2. Experimental method
Soil was placed into basins, with 1.5 kg per basin. L-antimony potassium tartrate (C8H4K2O12Sb2) and SbCl5 were used to prepare antimony-bearing soils with concentration gradients of 0, 100, 200, and 400 mg·kg−1. KCl was added to compensate for the concentration of K+ in the control samples. After evenly mixing the solution with the soil and letting it stand for a week, the seeds of three leguminous plants (mung bean, kidney bean, and peanut) were sown in the soil. The experiment used three parallel replicas, with the only differences being in the concentration of the heavy metal antimony; otherwise, each pot had similar conditions. Distilled water was applied periodically to compensate for water evaporation during incubation [Citation19]. After 2 months of growth, the rhizobia and nearby soil were collected as samples. The rhizobia of the three leguminous plants were tested synchronously after being extracted from the roots. The samples were stored in a − 5°C freezer.
2.3. Determination method
2.3.1 Enzyme activity
Soil sucrase activity was determined using the colorimetric method [Citation20]. Soil catalase activity was determined using the UV spectrophotometric method [Citation21]. Soil urease activity was determined using colorimetric method [Citation10].
2.3.2 Rhizobial activity
Determination of rhizobia activity used the acetylene method. Acetylene could be reduced to ethylene by rhizobia. Acetylene gas was injected into a closed vessel containing an ammonia solution of a monovalent copper salt, and the interaction produced acetylene copper, which made the solution appear purplish red. The obtained color was determined by a spectrophotometer [Citation22].
2.3.3 Ammonia nitrogen and total nitrogen content
Ammonia nitrogen content was determined using the spectrophotometric method [Citation23]. The total nitrogen content was determined using the Kjeldahl method [Citation24].
2.3.4 Soil microbial diversity
The microbial diversity was tested by Hangzhou Yanqu Information Technology Co., Ltd. to complete the composition spectrum analysis of microbial community diversity (limited by experimental funding, the samples with the most pronounced data were sent for sampling: the control (CK), Sb5+ (200 mg·kg−1), and Sb3+ (200 mg·kg−1) treatments). Briefly, the polymerase chain reaction (PCR) for the bacterial V4–V5 region of the 16s rDNA gene was amplified using the Novaseq-PE250 (GTGCCAGCMGCCGCGGTAA CCGTCAATTCMTTTRAGTTT) with Q5 high-fidelity DNA polymerases. The quality of DNA extraction was checked using 1.2% agarose gel electrophoresis. PCR amplification was performed using Pfu high-fidelity DNA polymerase purchased from Alltech Gold, and the number of amplification cycles was strictly controlled [Citation25–27]. The PCR amplification products were quantified based on fluorescence. The fluorescence reagent used was the Quant-iT PicoGreen dsDNA Assay Kit, and the quantification instrument was a microplate reader (BioTek, FLx800) [Citation28]. Sequencing libraries were prepared using the Illumina TruSeq Nano DNA LT Library Prep Kit [Citation29,Citation30]. A base was added at the 3’ end of the DNA sequence to prevent the self-association of the DNA fragment and to ensure that the target sequence could be attached to the sequencing junction (there was a prominent T base at the 3’ end of the sequencing junction) [Citation26]. A sequencing junction containing a library-specific tag (i.e. an index sequence) was added at the 5’ end of the sequence to enable the DNA molecule to be immobilized on the Flow Cell;. BECKMAN AMPure XP Beads were used to purify the library system after the addition of the junction by removing the self-linked fragments through magnetic bead screening [Citation31,Citation32]. PCR amplification was performed on the above-linked DNA fragments to enrich the sequencing library template, and BECKMAN AMPure XP Beads were employed to purify the library enrichment product again. Final fragment selection and purification of the library were performed using 2% agarose gel electrophoresis. The final selection and purification of the library were performed via 2% agarose gel electrophoresis.
Each of the high-quality denoised sequences was called an amplicon sequence variant (ASV), and their sequences were clustered into operational taxonomic units (OTUs) at a sequence similarity level of > 97%. The Green Genes database was used to compare the 16S rRNA genes of bacteria, construct a phylogenetic tree, and calculate the abundance of each taxon [Citation33,Citation34].
2.4. Statistical analyses
The average and standard deviation for the results of each experiment are displayed (M ± SD, n = 3). The statistical analysis was conducted using MS Excel 2016, whereas the supporting charts, plots, and curves were created using Origin 2021.
3. Results
3.1. Effect of antimony on soil enzyme activity
depicts the effects of different valence states of antimony on sucrase in soil. The results indicated that sucrase activity in the soil increased with increasing antimony content. When the concentrations of Sb3+ were 100, 200, and 400 mg·kg−1, sucrase activity increased by 32.05%, 34.26%, and 42.73%, respectively. When the concentrations of Sb5+ were 100, 200, and 400 mg·kg−1, sucrase activity increased by 2.90%, 9.25%, and 12.92%, respectively. When the concentrations of a mixture of both Sb3+ and Sb5+ were 100, 200, and 400 mg·kg−1 (50% each), sucrase activity increased by 26.52%, 29.77%, and 37.43%, respectively. The amount of increase in sucrase activity in Sb3+-containing soils was 3.31–11.06 times higher than that of Sb5+-containing soils ().
Figure 1. Effects of Sb3+ on soil enzyme activity. Note a sucrase activity sucrase activity was expressed as milligrams of 1 g of soil glucose after 24 h); b Catalase promotes (Catalase activity was expressed as milliliters of 0.02 mol/L potassium permanganate consumed by lg soil); c urease activity (urease activity was expressed as milligrams of NH3-N in lg soil after 24 h).
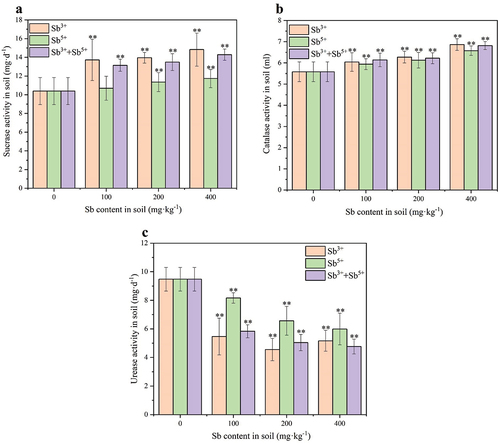
depicts the effects of different valence states of antimony on catalase in soil. The results indicated that catalase activity in the soil increased with increasing antimony content. When the concentrations of Sb3+ were 100, 200, and 400 mg·kg−1, catalase activity increased by 8.34%, 12.45%, and 23.05%, respectively. When the concentrations of Sb5+ were 100, 200, and 400 mg·kg−1, catalase activity increased by 6.49%, 9.80%, and 17.88%, respectively. When the concentrations of a mixture of both Sb3+ and Sb5+ were 100, 200, and 400 mg·kg−1 (50% each), catalase activity increased by 10.07%, 11.50%, and 22.19%, respectively. The amount of increase in catalase activity in Sb3+-containing soils was 1.27–1.29 times higher than that of Sb5+-containing soils ().
depicts the effects of different valence states of antimony on urease in soil. The results indicated that urease activity in the soil decreased with increasing antimony content. When the concentrations of Sb3+ were 100, 200, and 400 mg·kg−1, urease activity decreased by 42.28%, 51.96%, and 45.50%, respectively. When the concentrations of Sb5+ were 100, 200, and 400 mg·kg−1, urease activity decreased by 13.88%, 30.66%, and 36.79%, respectively. When the concentrations of a mixture of both Sb3+ and Sb5+ were 100, 200, and 400 mg·kg−1 (50% each), urease activity decreased by 38.40%, 46.79%, and 49.70%, respectively. The amount of increase in urease activity in Sb3+-containing soils was 1.24–3.05 times higher than that of Sb5+-containing soils ().
3.2. Effect of antimony on soil nitrogen content
Soil nitrogen content is an important indicator of farmland soil fertility. Because the soil nitrogen content after planting legumes is closely related to rhizobial activity, the soil nitrogen content can also reflect the degree of antimony toxicity to plant roots and soil.
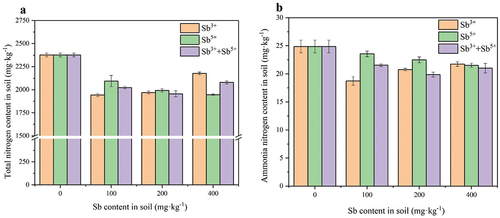
As shown in , the total nitrogen content and ammonia nitrogen content of the soil under antimony stress were lower than those of the blank control group. The total nitrogen content of the soil decreased by 8.37–18.28% and the ammonia nitrogen content of the soil decreased by 12.58–24.71% under Sb3+ stress. Both the total nitrogen content and ammonia nitrogen content reached their lowest values of 1942.55 ± 15.56 mg·kg−1 and 18.73 ± 0.77 mg·kg−1, respectively, at the Sb3+ content of 100 mg·kg−1. Under Sb5+ stress, the total nitrogen content in soil decreased by 11.91–18.09% and the ammonia nitrogen content in soil decreased by 5.29–13.43%, both of which reached their lowest values of 1946.50 ± 7.78 mg·kg−1 and 21.53 ± 0.36 mg·kg−1, respectively, at 400 mg·kg−1 of Sb5+. Under mixed antimony stress, the total nitrogen content in soil was reduced by 12.54–17.69% and the ammonia nitrogen content in soil was reduced by 13.38–20.14%, both of which reached their lowest values of 1956.11 ± 3.25 mg·kg−1 and 19.87 ± 0.44 mg·kg−1, respectively, at the antimony content of 100 + 100 mg·kg−1. The variation of ammonia nitrogen content in soil contaminated with Sb3+ was 0.94–4.67 times that in soil contaminated with Sb5+. The change in total nitrogen content in soil contaminated with Sb3+ was 0.46–1.54 times that in Sb5+-contaminated soil.
3.3. Effect of antimony on rhizobia
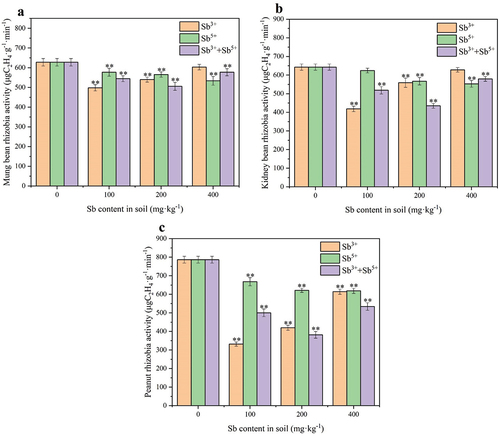
Antimony had a significant effect on the physical indexes of the rhizobia of mung beans (), kidney beans () and peanuts (). With the increase in the concentration of antimony, the average mass of rhizobia was reduced by 15.87–26.98%, and the average diameters of rhizobia were reduced by 5.2–10.53%. The rhizobia were incapable of normal development under the toxic effect of antimony. Using the spread plate method to culture the rhizobia samples, it was found that the number of bacterial colonies in rhizobia under antimony stress was also significantly lower than that of the blank control group, and there was a slight difference in the types of colonies cultured.
Table 2. Physical indicators of mung bean root nodules.
Table 3. Physical indicators of kidney bean root nodules.
Table 4. Physical indicators of peanut root nodules.
As shown in , antimony inhibited rhizobial activity. When the concentration of Sb3+ was 100 mg·kg−1, the rhizobial activity was the lowest; the mung bean rhizobial activity was reduced by 20.63%, the kidney bean rhizobial activity was reduced by 34.86%, and the peanut rhizobial activity was reduced by 57.84% compared to that of the blank control group. The rhizobial activity under Sb5+ stress decreased with the increase of the Sb5+ concentration. When the Sb5+ concentration reached 400 mg·kg−1, mung bean rhizobial activity decreased by 15.01%, kidney bean rhizobial activity decreased by 13.99%, and peanut rhizobial activity decreased by 21.32%. When legumes were under mixed antimony stress, the magnitude of changes in rhizobial activity depended on the Sb3+ content, and the rhizobial activity was the lowest when the Sb3+ concentration was 100 mg·kg−1 and the total mixed antimony concentration was 200 mg·kg−1.
3.4. Effect of antimony on microorganisms
To demonstrate the species annotation, the identification results were counted as shown in . The identification results of each sample shown in at each taxonomic level were plotted as bar graphs to compare the differences in the number of OTUs and the taxonomic identification results of different samples, as shown in .
Figure 4. Statistical chart of the number of microbial taxonomic units at each level. Note. Sb0 represents CK, Sb1 represents soil with added Sb5+, and Sb2 represents soil with added Sb3+.
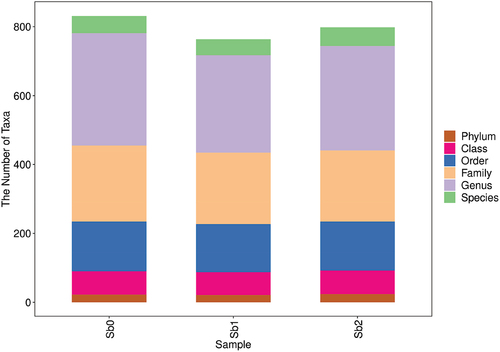
Table 5. Statistical table of the number of microbial taxonomic units at each level.
The analysis of the experimental results showed that the number of microorganisms and the number of species, families, and classes in the soil under antimony stress were lower than those in the CK group. Under Sb3+ stress, the number of microorganisms and the number of species, families, and classes in the soil were similar compared to the CK group.
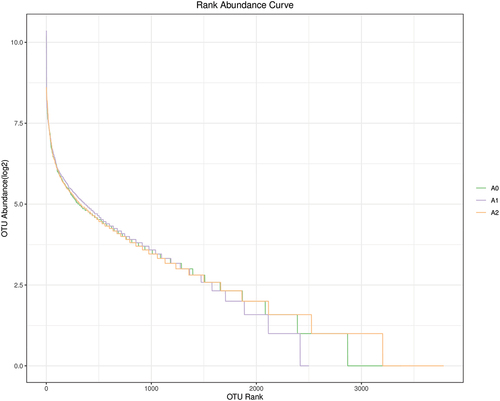
The abundance rank curves shown in are more abstract, where each fold line represents a soil sample. More fold lines indicated higher homogeneity of the bacterial community, while steeper folds reflected lower homogeneity and greater variation in the OTU abundance [Citation31]. The results showed that soils contaminated with Sb3+ had high homogeneity. In contrast, soils contaminated with Sb5+ had lower homogeneity and greater differences in abundance.
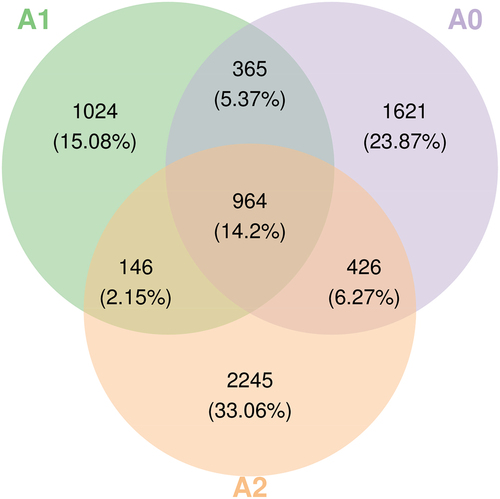
The ASV/OTU abundance table was used to produce a Venn diagram to analyze which species were common and which were unique among the different samples (). In total, 14.2% of microorganisms were not significantly affected, while 23.87% of microorganisms survived only in the blank control and could not survive under antimony stress. Under Sb3+ stress, 33.06% of the microorganisms survived. Antimony changed the survival environment of the soil, and the composition of microorganisms in the three soils was significantly different between treatment groups. Microorganisms with higher antimony tolerance that were better at mitigating the toxic effects of antimony replaced most of the native microorganisms in the soil. This demonstrated that the native microorganisms in the soil did not adapt to the environmental changes brought about by antimony contamination.
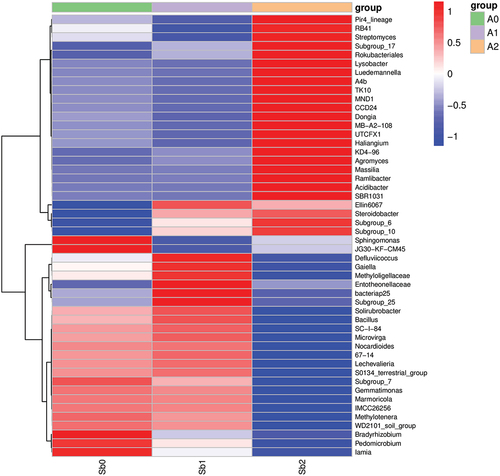
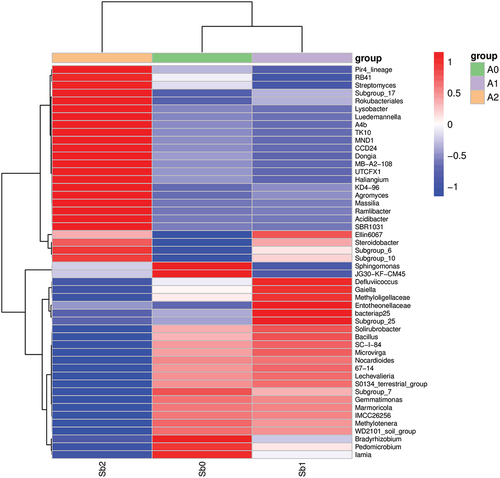
As shown in and , the activity of microorganisms was analyzed by using heat maps to further compare the differences between samples and to illustrate the species abundance distribution trends for each sample. Under Sb5+ stress, the composition of active microorganisms was close to that of the blank control group, and the changes in microorganisms were mainly reflected in the changes in the activity of microorganisms of the same species. At this time, the activity of microorganisms declined, but the composition of active microorganisms did not change. However, under Sb3+ stress, the composition of active microorganisms changed greatly. The activity of previously active microorganisms in the soil was significantly reduced, while the activity of previously inactive microorganisms increased and dominated.
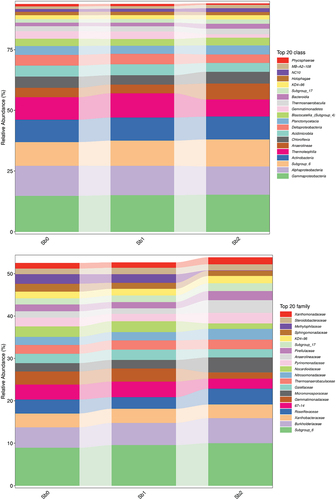
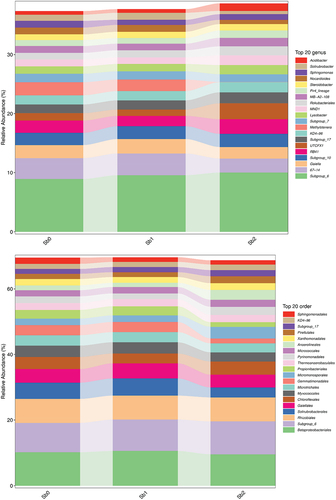
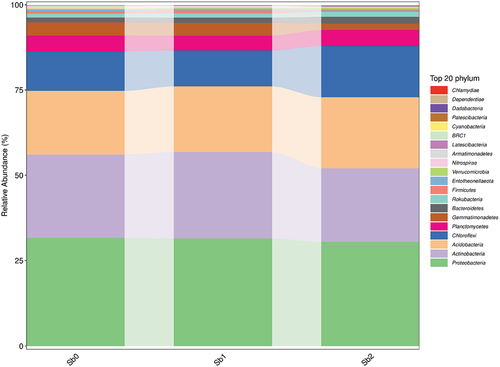
shows the visualization of the composition and distribution of each sample at the six classification levels of phyla, class, order, family, genus, and species in the form of a bar chart. Microorganisms in Sb5+-containing soils were similar to those in CK, but the microbial populations in Sb3+-contaminated soils were more variable.
4. Discussion
In terms of mechanism, metals may reduce enzyme activity by interacting with enzyme – substrate complexes, denaturing enzyme proteins, and binding to protein-reactive groups, which can essentially be summarized as a biochemical reaction between a protein and a metal. The inhibitory effect of exogenous substances, including heavy metals, on some soil enzymes has been reported in several studies, and the enzyme activity is negatively correlated with the amount of exogenous substances; however, the activity may increase under certain circumstances [Citation35]. Sb3+ had a promoting effect on sucrase activity in the present study, similar to the findings of other researchers [Citation36]. Although Sb5+ also had a promoting effect on sucrase activity, the effect was much lower than that of Sb3+. It is hypothesized here that the presence of antimony drastically alters the soil microbial environment, contributing to the elevated microbial demand for organic matter and contributing to the increased sucrase activity. As a metal with strong oxidizing properties, all three antimony pollutants elevated catalase activity to different degrees, similar to other heavy metals. The changes in urease activity in this experiment were similar to the findings of previous researchers, which showed a significant decrease in urease activity under soil Sb content of 200–1000 mg·kg−1 and with the presence of Sb in the soil for 10 days [Citation37]. The three antimony contaminants in the present study showed the same trend of effect on urease, similar to those of Cu and Cd [Citation38,Citation39], and only the degree of the effect differed. Experimental data showed that reduced soil urease activity led to lower soil N content, which was consistent with the results of this experiment. In addition, the lack of nitrogen content led to elevated rhizobial activity. The rhizobia under Sb5+ and mixed antimony stress exhibited fewer toxic effects than those under Sb3+ stress. Sb5+ had similar effects to Sb3+ on both soil enzymes and rhizobial activity, but the degree of effect varied greatly, which was due to the difference in oxidative strength between the two forms of Sb.
Analysis based on the Venn diagram and heat map showed that the activity of the original microorganisms declined under Sb3+ stress. The previously active microorganisms were replaced by microorganisms that were more adaptable under Sb3+ stress. Unlike the microorganism activity under Sb3+ stress, a decrease in microorganism activity was observed under Sb5+ stress. This confirmed that the change in microbial activity in the soil did not occur because antimony promoted the activity of the original microorganisms in the soil. The microorganism activities changed under Sb3+ stress. The activity of native microorganisms almost disappeared, while the activity of microorganisms with extremely low activity prior to the addition of Sb3+ significantly increased. This disruption of microbial activity had cascading effects on various soil processes and functions, further exacerbating the adverse effects of antimony on the overall soil fertility and ecosystem functioning. Sb5+ did not possess the strong oxidizing properties of Sb3+, therefore its impact on microbial populations was not as severe as that of Sb3+.
Figure 9 Bar chart of species composition. Note Sb0 represents CK, Sb1 represents soil with added Sb5+, and Sb2 represents soil with added Sb3+
5. Conclusion
The conclusions of this paper are as follows:
The toxic effect of Sb3+ on sucrase activity was 3.31–11.06 times that of Sb5+. The toxic effect of Sb3+ on catalase activity was 1.27–1.29 times that of Sb5+. The toxic effect of Sb3+ on urease activity was 1.24–3.05 times that of Sb5+. The toxic effect of Sb3+ on the rhizobial activity of mung bean was 1.41 times that under Sb5+ stress, 1.10 times that on the rhizobial activity of kidney bean, and 2.22 times that on the rhizobial activity of peanut.
Both valence states of antimony ions had significant toxic effects on microbial populations. Sb3+ was more toxic and changed the microbial population categories.
This paper focuses on the toxicity of antimony in different rack states on the soil and rhizobacteria of farmland planted with leguminous plants. As the rhizobacteria of leguminous plants can improve the soil environment, the degree of antimony toxicity in soil planted with other crops will be higher than that found in the results of the present experiments. Limited by the experimental conditions, this experiment failed to analyze the effects of antimony on the rhizobial and microbial activity at the genetic level. The toxic effects of antimony in different rack states on other plants and animals, as well as the effect of the soil in other conditions, need to be further investigated in depth.
Authorship
The article was experimented on and written by Yiran Yang, and modified by Zaifu Yang, with some experimental data provided by Yueyue Tian and Jingyao Xu, and financial support provided by Simeng Kan. Thank you to the authors for their help with the article. All authors agree to proceed with publication.
Availability of data and materials
All relevant data are within the manuscript and its Additional files.
Ethics and consent
The article does not involve any theoretical or moral issues.
Research involving plants
The plants involved in this article are not rare.
Acknowledgments
We thank LetPub (www.letpub.com) for its linguistic assistance during the preparation of this manuscript.
Disclosure statement
No potential conflict of interest was reported by the author(s).
Additional information
Funding
References
- Hu XY, He M, Li S, et al. The leaching characteristics and changes in the leached layer of antimony-bearing ores from China. J Geochem Explor. 2017;176:76–264. doi: 10.1016/j.gexplo.2016.01.009
- Yantao D, Bo Y, Yingchao N, Research on the high quality development of China’s antimony mining resource industry. Modern Min. 2020;36(10): 19–21.
- Wang C, Wan D, Cao X, et al. Spatial distribution characteristic of antimony in typical paddy soil of eastern Hunan province, China. Frontiers Environ Sci. 2021;9. doi: 10.3389/fenvs.2021.661148
- Zhou S, Deng R, Hursthouse A, Risk assessment of potentially toxic elements pollution from mineral processing steps at xikuangshan antimony plant, Hunan, China. Processes, 2020. 8(1):29. doi:10.3390/pr8010029
- Yanan W, Zaifu Y, Tao W, et al. Analysis and risk assessment of heavy metals in soils of taipu river basin. Environ Eng. 2019; 37(1): 18–22.
- Li Y, Lin H, Gao P, et al. Variation in the diazotrophic community in a vertical soil profile contaminated with antimony and arsenic. Environ Pollut. 2021;291. doi: 10.1016/j.envpol.2021.118248
- Fan Y, Zhu T, Li M, et al. Heavy metal contamination in soil and Brown Rice and human health risk assessment near three mining areas in Central China. J Healthc Eng. 2017;2017:1–9. doi: 10.1155/2017/4124302
- Zhinan X, Zaifu Y, Lisha G, et al. Preliminary study of antimony freshwater sediment quality criteria. Asian J Ecotoxicol. 2020;15(4):280–287.
- Maher WA. Antimony in the environment - the new global puzzle. Environ Chem. 2009;6(2):93–94. doi: 10.1071/EN09036
- Ji Y, Mestrot A, Schulin R, et al. Uptake and transformation of methylated and inorganic antimony in plants. Front Plant Sci. 2018;9. doi: 10.3389/fpls.2018.00140
- Li C, Hao C, Zhang W, et al. Highny source and geochemical behaviors in mine drainage water in China’s largest antimony mine. Polish J Environ Stud. 2020;29(5):3663–3673. doi: 10.15244/pjoes/114970
- Wei C, Ge Z, Chu W, et al. Speciation of antimony and arsenic in the soils and plants in an old antimony mine. Environ Exp Bot. 2015;109:31–39. doi: 10.1016/j.envexpbot.2014.08.002
- Qi C, Liu G, Kang Y, et al. Assessment and distribution of antimony in soils around three coal mines, Anhui, China. J Air Waste Manag Assoc. 2011;61(8):850–857. doi: 10.3155/1047-3289.61.8.850
- Wang Y, Liu Z, Li Y, et al. On the concept of subcriticality and criticality and a ratio theorem for a branching process in a random environment. Stat Probab Lett. 2017;127:97–103. doi: 10.1016/j.spl.2017.02.023
- Ren BZ, Zhou YY, Hursthouse, AS et al. Research on the Characteristics and Mechanism of the Cumulative Release of Antimony from an Antimony Smelting Slag Stacking Area under Rainfall Leaching. J Anal Chem. 1997. doi:10.1155/2017/7206876
- Tang H, Hassan MU, Nawaz M, et al. A review on sources of soil antimony pollution and recent progress on remediation of antimony polluted soils. Ecotoxicol Environ Saf. 2023;266. doi: 10.1016/j.ecoenv.2023.115583
- Wang WN, Xiao S, Amanze C, et al. Microbial community structures and their driving factors in a typical gathering area of antimony mining and smelting in South China. Environ Sci Pollut Res. 2022;29(33):50070–50084. doi: 10.1007/s11356-022-19394-6
- Xiao SS, Wang W, Amanze C, et al. Antimony oxidation and whole genome sequencing of Phytobacter sp. X4 isolated from contaminated soil near a flotation site. J Hazard Mater. 2023;445:445. doi: 10.1016/j.jhazmat.2022.130462
- Xu ZN, Yang Z, Zhu T, et al. Toxicity of soil antimony to earthworm eisenia fetida (savingy) before and after the aging process. Ecotoxicol Environ Saf. 2021;207:207. doi: 10.1016/j.ecoenv.2020.111278
- Li TF, Chongyi L, Xumei J, et al., Effects of different cultivation strategies on soil nutrients and bacterial diversity in kiwifruit orchards. Eur J Hortic Sci, 2022. 87(1). 87 1 10.17660/eJHS.2022/005
- Zazueta-Sandoval R, Durón-Castellanos A, Silva-Jiménez H. Peroxidases in YR-1 strain of Mucor circinelloides a potential bioremediator of petroleum-contaminated soils. Ann Microbiol. 2008;58(3):421–426. doi: 10.1007/BF03175537
- Kozar SF, Symonenko EP, Volkohon VV, et al. Nanocarboxylates of molybdenum and of iron enhance the functional activity of rhizobium radiobacter 204. Appl Nanosci. 2019;9(5):795–800. doi: 10.1007/s13204-018-00939-6
- Zhao PN, Wang S, Liu D, et al. Study on influence mechanism of biochar on soil nitrogen conversion. Environ Pollut Bioavailabil. 2022;34(1):419–432. doi: 10.1080/26395940.2022.2125445
- Pereira MG, Espindula A, Valladares GS, et al. Comparison of total nitrogen methods applied for histosols and soil horizons with high organic matter content. Commun Soil Sci Plant Anal. 2006;37(7–8):939–943. doi: 10.1080/00103620600584743
- DeSantis TZ, Hugenholtz P, Larsen N, et al. Greengenes, a chimera-checked 16S rRNA gene database and workbench compatible with ARB. Appl environ microbiol. 2006;72(7):5069–5072. doi: 10.1128/AEM.03006-05
- Quast C, Pruesse E, Yilmaz P, et al., The SILVA ribosomal RNA gene database project: improved data processing and web-based tools. Nucleic Acids Res. 2013;41(Database issue):D590–6. 10.1093/nar/gks1219
- Koljalg U, Nilsson RH, Abarenkov K, et al. Towards a unified paradigm for sequence-based identification of fungi. Mol Ecol. 2013;22(21):5271–5277. doi: 10.1111/mec.12481
- Ramette A. Multivariate analyses in microbial ecology. FEMS Microbiol Ecol. 2007;62(2):142–160. doi: 10.1111/j.1574-6941.2007.00375.x
- Benjamini Y, Hochberg Y, Controlling the false discovery rate - a practical and powerful approach to multiple testing. J R Stat Soc Ser B Stat Methodol. 1995;57(1):289–300.10.1111/j.2517-6161.1995.tb02031.x
- Rognes T, Flouri T, Nichols B, et al. VSEARCH: a versatile open source tool for metagenomics. PeerJ. 2016;4:4. doi: 10.7717/peerj.2584
- Bokulich NA, Subramanian S, Faith JJ, et al., Quality-filtering vastly improves diversity estimates from Illumina amplicon sequencing. Nat Methods. 2013;10(1):57–U11. doi:10.1038/nmeth.2276
- Nilsson RH, Ryberg M, Kristiansson E, et al., Taxonomic reliability of DNA sequences in public sequence databases: a fungal perspective. PLoS One, 2006. 1(1). doi:10.1371/journal.pone.0000059
- Anderson MJ, Willis TJ. Canonical analysis of principal coordinates: a useful method of constrained ordination for ecology. Ecology. 2003;84(2):511–525. doi: 10.1890/0012-9658(2003)084[0511:CAOPCA]2.0.CO;2
- Anderson MJ, Ellingsen KE, McArdle BH. Multivariate dispersion as a measure of beta diversity. Ecol Lett. 2006;9(6):683–693. doi: 10.1111/j.1461-0248.2006.00926.x
- Chen X, Chen HYH, Chen X, et al. Soil labile organic carbon and carbon-cycle enzyme activities under different thinning intensities in Chinese fir plantations. Appl Soil Ecol. 2016;107:162–169. doi: 10.1016/j.apsoil.2016.05.016
- Xu Z, Yang Z, Zhu T, et al. Ecological improvement of antimony and cadmium contaminated soil by earthworm eisenia fetida: soil enzyme and microorganism diversity. Chemosphere. 2021;273. doi: 10.1016/j.chemosphere.2020.129496
- An YJ, Kim M. Effect of antimony on the microbial growth and the activities of soil enzymes. Chemosphere. 2009;74(5):654–659. doi: 10.1016/j.chemosphere.2008.10.023
- Wyszkowska J, Kucharski M, Kucharski J, et al. Activity of dehydrogenases, catalase and urease in copper polluted soil. J Elem. 2009; 14(3):605–617.
- Wang Y, Yan A, Wu T, et al. Accumulation and remediation of cadmium-polluted soil by a potential cadmium-hyperaccumulator Chlorophytum comosum. energy sources part a-recovery utilization and environmental effects. Energy Sources Part A. 2012;34(16):1523–1533. doi: 10.1080/15567036.2010.489100


