 ?Mathematical formulae have been encoded as MathML and are displayed in this HTML version using MathJax in order to improve their display. Uncheck the box to turn MathJax off. This feature requires Javascript. Click on a formula to zoom.
ABSTRACT
Ethiopia, with its diverse ecological settings, is endowed with rich floral diversity. However, its vegetation is rapidly vanishing. Thus, the status was carried out to analyze of the Endiras forest in Northwest Ethiopia. Systematically, 50 (20 × 20 m) quadrats were laid on 10 transects oriented in a north-south direction. In each quadrat, woody species were recorded; circumferences (DBH ≥2.5 cm) were measured, and species’ cover abundance (in %) was recorded, which were later transformed into a modified Braun-Blanquet scale. Seedlings and saplings were recorded in five subquadrats (5 × 5 m) placed at each corner and center of the main quadrat. Cluster analysis was employed to identify community types, and the Shannon-Wiener index was computed to quantify species diversity. Structural parameters and size-class ratios were used to analyze the structural pattern and regeneration status, respectively. Seventy-three woody species distributed in 38 families were recorded, of which three were Ethiopian endemics. Fabaceae was the most species-rich family (21.92%). Five communities with different species diversity were identified. Structural data analyses showed that small trees and shrubs dominated the forest species. Species with a small IVI, lower numbers of juveniles, and abnormal population structures should receive conservation priority.
1. Introduction
Ethiopia, with its variable topographic features, is endowed with habitat heterogeneity that favors the existence and evolution of various organisms (NBSAP National biodiversity strategy and action plan, Citation2005). These features also make it among the top 25 biodiversity-rich nations on the globe (EBI, Citation2014). Among the 34 biodiversity hotspots, Ethiopia hosts the Eastern Afromontane and the Horn of Africa hotspots. Ethiopia is also considered one of the nations in the Horn of Africa that serves as a major hub for many plant species that have high levels of diversity and endemism (FAO Food and Agriculture Organization of United States, Citation2010). Thus, Ethiopia is believed to have about 6027 vascular plant species with 10% endemic elements (Kelbessa & Demissew, Citation2014).
Recently several authors including Vivero et al. (Citation2005), Friis et al. (Citation2010), Kelbessa and Demissew (Citation2014), Asefa et al. (Citation2020) and FAO (Citation2020) have examined Ethiopia’s plant biodiversity at various points in time using a variety of methods. According to FAO (Citation2020) Ethiopia has 15.7% forest cover, with a deforestation rate of 92 000 ha/year showing that the forest resources of Ethiopia are dwindling at an alarming rate. The absence of alternative livelihood options for the rapidly growing population has resulted in the conversion of forests into farmlands (Senbeta & Denich, Citation2006), leaving fragments of forest patches in religious sites, inaccessible, and protected areas. Despite the fact that these works deepen our knowledge of Ethiopian vegetation, given the country’s vast surface area and diverse topographic features, vegetation studies of Ethiopia is far from complete. Taking this in to account, Asefa et al. (Citation2020), suggested further research on Ethiopia’s vegetation at community and species level in order to meet the target of zero global plant extinctions
Despite a lack of complete data, the Amhara Region in northwest Ethiopia lost 135 ha of tree cover in 2022, which is equal to 1,82 tons of CO2 emissions, experiencing a 2.3% decline in tree cover since 2000 (https://www.globalforestwatch.org). Endiras natural forest is one of the large patches of dry evergreen afromontane state forests located in Fogera District, South Gondar Administrative Zone, Amhara Region, Northwest Ethiopia. The forest area was unwisely exploited and largely converted to pasture and farm lands during the civil war (1990–1992). After the nation’s political stability, the land was once again protected as a forest area. The forest is still being impacted by anthropogenic activities because it is surrounded by farmland and settlements.
To produce scientific information on the status of forest, identify ecologically significant plant species, and prioritize the endangered species for conservation, it is essential to conduct ecological investigations. In addition, the identification of plant community types helps in recommending appropriate management regimes for each separate unit. Moreover, looking at population structure patterns reveals important details regarding their recruitment and regeneration status that can be used to develop conservation plans (Teketay, Citation2005). Thus, the objectives of the current study were to (a) analyze woody species richness and diversity of the study forest, (b) identify the community types, and (c) evaluate vegetation structure and regeneration status of the Endrais forest, Northwest Ethiopia.
2. Methods
2.1. Description of the study area
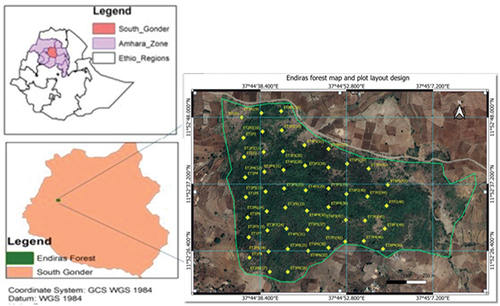
The research was carried out in Endiras State Forest, situated in Fogera District, South Gondar Zone, and Amhara Region, Northwest Ethiopia. The forest is found at 11°52′20′′–11°52′50′′N latitude and 037°44′0′′–037°44′45′′E longitude and has an altitudinal range of 1968–2064 m.a.s.l. (Figure ). Woreta, a capital town of Fogera district, is located 625 km from Addis Ababa, the capital of Ethiopia. Topographically, Fogera district is composed of 76% flat, 11% mountain and hills, and 13% valley bottom (Anjulo & Mezgebu, Citation2016) with an altitudinal range of 1700 to 2400 m.a.s.l.
Figure 1. Map of the study area (E = Endiras, T = transect, p = plot).
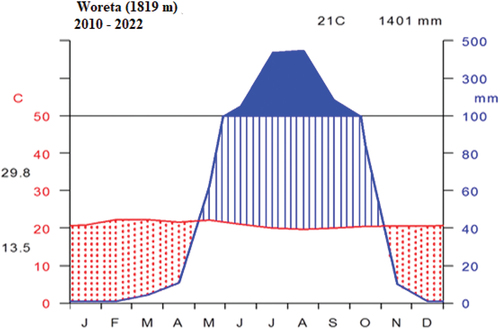
According to the 10-year data from Amhara Meteorological Service Center (2010–2022), the study area has a unimodal rainfall distribution pattern with a mean annual rainfall of 1401 mm. The wettest months were from July to October followed by a decline in rainfall from November to December and little or no rainfall from January to May. The mean minimum and maximum temperatures were 13.5°C and 29.8°C, respectively, with 21°C mean annual temperature (Figure ).
Figure 2. Climadiagram of the study area (data source: Ethiopian Meteorological Agency Woreta Station).
2.2. Study design and data collection
After the reconnaissance survey, systematic random sampling technique was employed to collect vegetation data following Kent (Citation2011). Ten line transects were established in a north-south direction, spaced at 100 m intervals. Fifty quadrats with the size of 20 m × 20 m, placed 100 m apart, were set along the transects. Five (5 m × 5 m) subquadrats, at four corners and center, were set up within each quadrat to record seedling and sapling data.
Actual data collections were carried out from September 20/2022–February 7/2023. In each quadrat, the woody species cover abundance (in %) was recorded and later transformed into a modified Braun-Blanquet 1–9 scale (Kent, Citation2011). All woody species having a DBH ≥2.5 cm were measured. In this work, seedlings were defined as newly sprouted young plants that were less than 1.5 m in height, adults as mature individual plants that were greater than 3 m, and saplings as young plants progressed beyond seedlings and were between 1.5 and 3 m in height as used by Belachew (Citation2010). In each plot, elevation, aspect, and slope were measured using GPS, compass, and clinometers, respectively. Plant specimens of each species were recorded and collected using their local names or codes. Plant specimens collected from the study area were dried, pressed, and finally identified by using the Flora of Ethiopia and Eritrea in the University of Gondar Herbarium. The recent scientific name change for a plant species was verified (checked) using The World Flora Online (Borsch et al., Citation2020).
2.3. Analyses of floristic data
2.3.1. Community classification
The abundance data set of species in 50 sample quadrats was subjected to hierarchical cluster analysis with the aim of identifying plant community types using R Statistical Software version 3.5.1. The similarity ratio was used in order to determine the resemblance function. Ward’s method was employed to increase homogeneity within groups and increase heterogeneity among groups (Kent, Citation2011). The communities generated during cluster analysis were refined further in a synoptic table, and occurrences of species were compiled as values of synoptic cover abundance, where synoptic values are the product of the species frequency and average cover abundance values (Woldu, Citation2012). The synoptic value of species was used to determine the dominant species in each community type, and the community types were, then, named after these dominant species. Synoptic value was chosen (rather than IVI value that focuses on relative importance of species) to indicate the importance of the species in the community since it provides a holistic perspective on a species’ ecological characteristics across the entire study area.
2.3.2. Species diversity
Woody species diversity was calculated by using Shannon-Wiener diversity index by the formula and woody species evenness was quantified by using Shannon-Wiener evenness index using
formula, where
signifies the index of Shannon-Wiener index, s = species richness, Pi = individuals’ proportion, and ln = natural logarithm to base n, and J = evenness.
2.3.3. Analyses of vegetation structure data
Structural parameters (density, DBH, BA, and IVI) were used to examine the structure of the vegetation data.
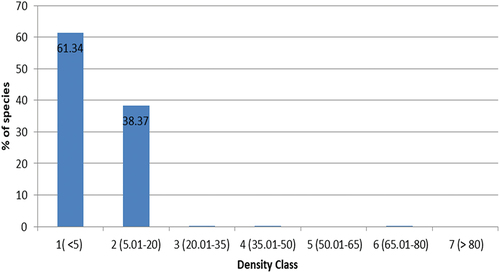
By sorting the density in ascending order, species were grouped into seven density classes (in %): 1) ≤5, 2) 5.01–20, 3) 20.01–35, 4) 35.01–50, 5) 50.01–65, 6) 65.01–80, and 7) >80
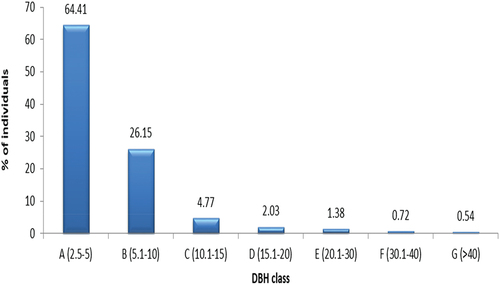
Diameter at breast height (DBH) was computed from adult woody species circumference as D = C/π, where D = DBH, C = circumference, and π = 3.14. Based on the size of individuals, DBH (in cm) was, then, sorted in ascending order into six classes to evaluate the forest species structure patterns: 1) ≤5, 2) 5.1–10, 3) 10.1–15, 4) 15.1–20, 5) 20.1–30, and 6) >40.
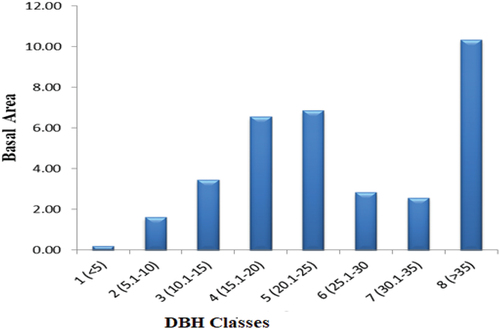
Basal area (BA) values were computed from the DBH value, BA = πd2/4 where D denotes DBH andπ = 3.14. Basal areas of the forest species were grouped into eight classes in ascending order to analyze the patterns of the vegetation structure: 1 (<5), 2 (5.1–10), 3 (10.1–15, 4 (15.1–20), 5 (20.1–25), 6 (25.1–30, 7 (30.1–35), and 8 (>35).
The importance value index (IVI) was calculated from the summation of three parameters: relative frequency (RF), relative density (RD), and relative dominance of the species (RDo) (Kent, Citation2011).
To prioritize species for conservation measures, IVI values of species were classified into 5 IVI classes (Shibru & Balcha, Citation2004) as 1) >15, 2) 10.01–15, 3) 5.01–10, 4) 1.01–5, 5) ≤1. Setting conservation priorities were based on the decreasing order of the species IVI classes. Species falling into the high-priority IVI class were considered threatened since they were the least frequent, dense, and dominant. These ecologically important plant species, thus, need immediate conservation action. However, species in the lower IVI classes are considered as low-priority species that may not require immediate conservation intervention.
2.3.4. Regeneration status data analysis
The regeneration status of woody species was evaluated based on density ratios of size classes (i.e. ratios of seedlings with saplings, seedlings with adult plants, and saplings with adults) by extrapolating the seedling and sapling count in the subquadrats to the main quadrat. Seedlings and saplings were identified using the seedling field guide.
3. Results
3.1. Floristic composition and species accumulation curve
Seventy-three woody plant species distributed in 63 genera and 38 families were recorded in Endrais forest (Table ). A species area curve was used in order to assure whether the data collected represent the study forest or not. The curve was plotted as a function of the cumulative number of species recorded versus sampling effort. In ecological communities, species numbers increase as the area sampled increases, with a decrease in rate as the sampling effort continues. Thus, labeling off the curve, like the present study, showed that the forest had been sufficiently sampled that further sampling efforts did not add new species (Figure ). The three curves (lines), in a species accumulation curve, are observed species curve, rarefaction curve, and asymptote. The observed species curve (middle line) represents the cumulative number of distinct species that have been encountered during the sampling effort. It starts from zero and increases as more samples are collected. The rarefaction curve (lower line) estimates the expected number of species at a given level of effort, taking into account the variation in sample size. It typically starts below the observed species curve and approaches it as the sampling effort increases. The asymptote (upper line) is a horizontal line that represents the estimated maximum number or upper limit of species that would be observed if the sampling effort were infinite. The observed species curve and the rarefaction curve both tend to approach this asymptote as the sampling effort increases. These three lines or curves provide important information about the species richness, the completeness of sampling, and the expected number of species at different levels of effort in a species accumulation curve.
Figure 3. Species accumulation curve for Endiras forest, northwest Ethiopia.
Fabaceae contributed the highest number of species (16 species = 21.92%) that accounted for over three-folds of the second-top species-rich families, Euphorbiaceae and Moraceae, which contained five and four species, respectively. Three families, Lamiaceae 3 (4.11%), Celastraceae 2 (2.74), and Primulaceae 4 (5.48%), accounted for species each and eight families contained two (2.74%) species each (Table ). The above 13 families accounted for 65.75% of the total species, and the rest 25 families contributed a single (1.37%) species each (Table ).
Table 1. The communities, quadrat, species richness (S), diversity (H’), and evenness (J)
Table 2. Synoptic value for species having ≥1 in at least one community (bold numbers indicate dominant species by which communities are named)
Regarding the growth form of species, shrubs contributed the highest number of species 39 (53.4%) followed by trees 30 (41.1%). Few numbers of lianas 4 (5.5%) were recorded in the study forest. A small number of endemic species (3 species or 4.35%) were recorded in the study area (Table ). These endemic species are listed in the preliminary list assessed for the IUCN Red Data List. Two of the endemics were shrubs, whereas the other was a tree species. Based on the IUCN category, Searsia glutinosa is vulnerable, and Acanthus senniiis near threatened, whereas Millettia ferruginea is in the least concern category.
3.2. Woody plant communities in Endiras forest
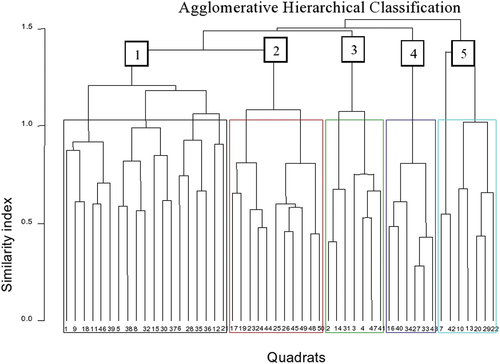
Five community types were generated through the analysis of floristic data and named after two dominant woody species that would have a high synoptic value (Figure ). Cluster colors on the dendrogram refer to the different colors assigned to specific plant communities. These colors are used to visually represent and distinguish different groups or clusters of plant communities based on their shared characteristics.
Figure 4. Dendrogram generated from hierarchical cluster analysis of species in Endiras Forest, northwest Ethiopia.
3.2.1. Vachellia lahai–Carissa spinarum community
This community contained 19 quadrats (38%) and 48 associated species distributed in the altitudinal range from 1972 to 2016 m.a.s.l. (Table ). Several quadrats (36.8%) were found on slightly steep slopes. A large proportion of quadrats (31.6%) were distributed on the north-facing slopes. Acacia lahai, Stereospermum kunthianum, Albizia schimperiana, Albizia malacophylla, Compretum collinum, Acacia persiciflora, and Ficus thonningii were well-represented tree species in the community. Carissa spinarum, Grewia ferruginea, Clausena anisata, and Ocimum lamiifolium were preferably distributed in the shrubby layer (Table ).
3.2.2. Buddleja polystachya–Croton macrostachyus community
The 42 species distributed in 11 quadrats (22%) under the community were situated in the elevation range of 1988–2043 m.a.s.l. (Table ). Large numbers of quadrats (45.5%) were laid on gentle slopes. Most quadrats were located on the eastern (36.4%) and southern (27.3%) facing slopes. Croton macrostachyus, Stereospermum kunthianum, Terminalia brownie, and Combretum collinum were tree species dominating the community. Ficus sycomorus and Millettia ferruginea were indicator tree species of the community. Buddleja polystachya, Calpurnia aurea, Vernonia myriantha, Capparis tomentosa, and Acanthus sennii were common species in the shrub layer. Rhoicissus tridentata and Jasminum abyssinicum were the only lianas seen in the community (Table ).
3.2.3. Syzygium guineense–Maytenus undata community
The community contained 7 (14%) quadrats and 41 species distributed in the elevation range from 1978 to 2031 m.a.s.l. (Table ). The distributions of quadrats were not affiliated with specific slopes or aspects. Among the tree species included in the community, Syzygium guineense, Albizia gummifera, and Albizia malacophylla were relatively dominant. Maytenus undata. Euclea racemosa, Rosa abyssinica, Maesa lanceolata, Ximenia americana, Flueggea virosa, Acokanthera schimperi, and Ocimum lamiifolium were the predominant species in the shrub layer of the community. Turraea holstii was a rare shrub available only in this community. Jasminum abyssinicum was the only liana found in the community (Table ).
3.2.4. Osyris lanceolata–Pittosporum viridiflorum community
This community encompasses 6 (12%) quadrats and 41 associated species located in the elevation range from 1975 to 2059 m.a.s.l. (Table ). Large proportions of quadrats 83% of were situated on gentle slopes, and 50% of the quadrats were found on the north-facing slopes. Shrubs dominated the community. Pittosporum viridiflorum, Syzygium guineense, Albizia gummifera, and Phoenix reclinata were tree species observed in the community, whereas Osyris lanceolata, Carissa spinarum, Maytenus undata, Dodonea viscosa, Gardenia ternifolia, Dovyalis abyssinica, Ximenia americana, Rosa abyssinica and Acokanthera schimperi were species in the shrub layer. Jasminum abyssinicum and Embelia schimperi were liana species available in the community (Table ).
3.2.5. Acacia senegal–Searsia glutinosa community
This community’s 7 (14%) quadrates and 52 related species were oriented within the elevation range of 1984 to 2064 m.a.s.l. (Table ). Quadrats were largely distributed in sloppy areas (57.1%). Large proportions of quadrats were laid on westward-facing slopes (42.9%). Acacia senegal, Erythrina abyssinica, Pittosporum viridiflorum, Albizia schimperiana, Gardenia ternifolia, and Terminalia brownie were trees commonly available in the community, whereas Searsia glutinosa, Dodonea viscosa, Pterolobium stellatum, Bersama abyssinica, and Acanthus polystachius were shrubs preferably distributed in this community. Jasminum abyssinicum was a liana species observed in the community. Ficus vasta, Cordia africana, Bridelia micrantha, Ficus palmate, and Allophylus abyssinicus were indicator species found in the community (Table ).
3.3. Species richness, diversity, and evenness of the plant communities
Species diversity (H’) and evenness (J) of Endiras forest woody species were 3.40 and 0.85, respectively. Comparisons among the communities showed that community 1 (58 species) had the highest species richness, evenness, and diversity, whereas community 4 showed the least species richness, evenness, and diversity (Table ). Other communities (i.e. 2, 3, and 5) had intermediate species diversity, evenness, and richness
3.4. Vegetation structure of Endiras forest
3.4.1. Density
In the Endiras Forest, the total density of adult woody species with DBH ≥2.5 cm was 3252.5 individuals ha−1. Carissa spinarum (442.5 ha−1) followed by Maytenus undata (323.5 ha−1) Acanthus polystachius (229 ha−1), Calpurnia aurea (157 ha−1), Rhus glutinosa (141 ha−1), Croton macrostachyus (133 ha−1), Pterolobium stellatum (129.5 ha−1), and Acanthus sennii (124.5 ha−1) were the abundant species. In contrast, Turraea holstii (0.5 ha−1), Cordia africana (1 ha−1), Ficus sycomorus (1.5 ha−1), Allophylu sabyssinicus (2 ha−1), and Mimusops kummel (2 ha−1) were the least dense species (Table ).
A rapidly declining J-shaped pattern that approaches zero after density class two indicates a striking pattern of very low abundance for the majority of species in the forest. The majority of species were found in density classes one (61.34%) and two (38.37%) (Figure ). Such a pattern is a characteristic feature of secondary forests, which have regrown after previous disturbance events such as logging, agricultural expansion, or fire. In these regenerating ecosystems, the density-class distribution of species can exhibit unique patterns due to the specific characteristics of the secondary forest environment. Based on the provided data, it appears that Carissa spinarum (442.5 stems ha−1), Acanthus polystachius (323.5 stems ha−1), and Maytenus undata (229.5 stems ha−1) are the dominant species in terms of stem density (Table ). These species are contributing significantly to the abundance in the first and second density classes.
Figure 5. Sixty-four species distribution across the density classes of Endiras forest, northwest Ethiopia.
3.4.2. DBH class distribution
As trees grow, they increase in size and move towards higher DBH classes. However, the mortality rate of larger trees tends to be higher due to factors such as senescence, competition, and susceptibility to diseases. This leads to a decline in the number of individuals in higher DBH classes, resulting in an inverted J-shaped pattern (Figure ). The first class containing the largest proportion of individuals ha−1 followed by the 2nd, 3rd, 4th, 5th, 6th, and 7th, respectively. About 90.56% of individuals in ha−1 was accounted for the 1st and 2nd classes. In DBH class 1, shrub species such as Carissa spinarum (19.69%), Maytenus adata (11.86%), and Acanthus polystachius (10.72%) contributed most of the individuals. The remaining five DBH classes contributed 9.44% to the total tree density ha−1 (Table ).
Figure 6. Individual distributions of 64 species across DBH classes in Endiras Forest, northwest Ethiopia.
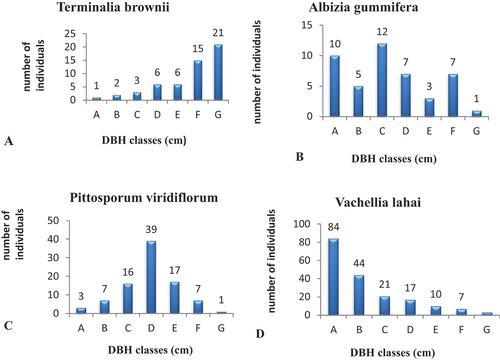
Despite the forest’s overall vegetation structure being normal (J-shaped pattern), several species exhibit aberrant population structures that highlight the different structural dynamics present in the forest. A small number of species, representing those with different abnormal population structures, were selected for analysis in order to illustrate these variations (Figures ). Thus, population structure analyses of these species, using the DBH class distribution, showed four different patterns suggesting different population dynamics of species. The “J”-shaped pattern, represented by Terminalia brownie (Figure ), showed that most members of a species were found in the upper DBH classes (classes 4–8) and gradually decreased and nearly disappeared in the lower classes. The second form was an irregular individual distribution, where the density of every member of the class reduces as DBH rises up to a certain point, then rises as DBH classes rise in an almost zigzag fashion. Such a pattern was represented by Albizia gummifera (Figure ). The third pattern (bell shape) demonstrated a relatively large number of individuals in the middle DBH classes, with a steady decline in individuals of species in the lower and upper classes. Pittosporum viridiflorum exhibited the bell-shaped distribution (Figure ). Vachellia lahai (Figure ) exhibited the fourth pattern, an inverted J-shape, with a high density of individuals in the lower DBH classes and a gradually declining density of individuals in the higher DBH classes.
Figure 7. (A–D) Population structure of selected tree species in Endiras forest, northwest Ethiopia.
3.4.3. Basal area
The overall basal area of the forest patch (DBH ≥2.5 cm) was 17.23 m2/ha. Seven species, Syzygium guineense (1.72 m2/ha−1), Terminalia brownie (1.41 m2/ha−1), Pittosporum viridiflorum (1.37 m2/ha−1), Rhus glutinosa (1.06 m2/ha−1), Acacia lahai (1.05 m2/ha−1), Croton macrostachyus (0.66 m2/ha−1), and Albizia gummifera (0.54 m2/ha−1) together contributed 7.81 m2/ha−1 (45.32%), whereas the remaining 59 species contributed 9.42 m2/ha−1 (54.67%) to the total basal area of Endiras forest. The J-shaped curve in forests may show irregularities due to factors like tree growth rates, species composition, successional stage, disturbance history, or management practices (Figure ). These irregularities may indicate a lack of uniformity in forest dynamics, habitat heterogeneity, or potential management interventions needed to promote a more balanced forest structure. Comparison of basal area and densities of individuals in DBH classes showed that 2934.65 (81.98%) individuals in DBH class one accounted for 2.05 m2/ha−1 (13.2%) to the total basal area, whereas 18 (0.5%) individuals in DBH class eight contributed 4.87 m2ha−1 (31.2%) of the total basal area. The tree species that contributed a large amount of basal area to DBH class eight were Syzygium guineense (1.48 m2 ha−1) followed by Terminalia brownie (1.03 m2 ha−1). Some other species, Pittosporum viridiflorum (0.46), Ficus vesta (0.41), Vachellia lahai (0.197), and Ficus sycomorus (0.192) also accounted for a considerable amount of basal area in class eight (Table ).
Figure 8. Basal area classes based on DBH distribution of 64 species in Indiras Forest, northwest Ethiopia.
3.4.4. Importance Value Index (IVI)
The IVI result for the Endiras forest showed that five plant species made up a large portion of the forest, accounting for 30% (90.48/300) of the IVI. These were Carissa spinarum (21.19), followed by Rhus glutinosa (18.22), Maytenus undata (17.88), Croton macrostachyus (17.08), and Acacia lahai (16.11), respectively. The 10 leading species, Carissa spinarum (21.19), Rhus glutinosa (18.22), Maytenus undata (17.88), Croton macrostachyus (17.08), Acacia lahai(16.11), Syzygium guineense(10.91), Osyris lanceolata (10.64), Calpurnia aurea (10.19), Dodonea viscosa (9.95), and Bersama abyssinica (9.79) shared 47.32% of the overall IVI. Since most of the above 10 species (7/10) were shrubs, the highest contribution to the total IVI comes from their relative density and frequency, as shrubs do not grow to a large size with a large basal area (Table ).
Based on their IVI values for conservation priority and monitoring, woody species in Endiras Forest were grouped in to five classes (Table ). The highest number of species were distributed in IVI class four (42.9% of species), followed by IVI class five (25.4% of species), which contributed 22.68% and 3.32% to the total IVI value, respectively. Thus, the least parentage of IVI was, then, contributed by species included in IVI class five such as Turraea holstii (0.143) Allophylus abyssinicus (0.2), Cordia Africana (0.26), Mimusops kummel (0.33), and Sapium ellipticum (0.374). In contrast, IVI class one has the lowest number of species (7.9%) but accounted for the highest percentage of IVI value (32.83%) (Table ). Priori class (rank) of species for conservation was made based on the IVI classes of species which in turn was based on IVI value of species (Table ). Thus, species with the highest prior class need immediate conservation action and species with the least priori class need regular monitoring management.
Table 3. IVI classes and the number of woody plant species in each class
3.4.5. Regeneration status
In Endrais forest, 5425.8, 4891.8, and 3372.5 ha−1 of seedlings, saplings, and adults were documented, respectively. Pterolobium stellatum (1424 ha−1), Acanthus polystachyus (353.6 ha−1), Capparis tomentosa (340 ha−1), Jasminum abyssinicum (296 ha−1), Calpurnia aurea (273.6 ha−1), and Clausena anisata (265.6 ha−1) accounted for 54.4% of the overall seedling density. Pterolobium stellatum alone contributed 26.2% to the total seedling density. In contrast, 19 species, including Ficus sycomorus, Cordia africana, and Albizia schimperiana, were not represented by seedlings. Maytenus undata (710.4 ha−1), Acanthus polystachius (592 ha−1), Grewia ferruginea (230.4 ha−1), Calpurnia aurea (228.8 ha−1), and Dodonea viscosa (224 ha−1) were the major contributors to sapling density, whereas saplings were not recorded for Croton macrostachyus, Allophylus abyssinicus, Mimusops kummel, and other 13 species (Table ).
Table 4. List of woody plant species collected from Endiras Forest with the information of each species structure and regeneration
Compared to mature individuals and saplings, seedlings had a higher overall density (seedlings > saplings > adults). This demonstrates that the forest’s overall regeneration status was in a good condition. Separate analyses of the regeneration status of the various species, however, showed that 29% and 11.3%, respectively, were in good and poor regeneration status. Due to the lack of seedlings and saplings, about 19.3% of the species were not regenerating at all. Thus, 14 species including Buddleja polystachya, Dichrostachys cinerea, and Flueggea virosa were not regenerating as they were without seedlings and saplings (Table ).
4. Discussion
4.1. Floristic composition
The study forest’s species richness (73 species) was greater than some other dry evergreen afromontane forest patches studied in a similar manner, including Abunie and Dalle (Citation2018) in Yemrehane Kirstos (39 species), Getnet (Citation2018) in Wanzaye (49 species), and Masresha et al. (Citation2023) in Gosh Beret (52 species). However, a smaller number of woody species was documented compared to Masresha et al. (Citation2015) in Alemsaga (88 species) and Kebede et al. (Citation2016) in Gedo forests (134 species). Species richness is attributed to environmental heterogeneity, disturbance level, forest size, climate, and ecological successional stage. Environmental heterogeneity could create different micro-habitats that suit the growth of various species (Stein et al., Citation2014). In addition, a given vegetation can have good species richness if it is under an active ecological successional stage where the species of successive communities’ overlap (Silverown, Citation2004), which might probably be the reason for the better species richness of the present study.
In addition to being the second-largest family in the flora of Ethiopia and Eritrea (Hedberg & Edwards, Citation1989), Fabaceae, most species-rich family (21.92%) in the present study, was also found to be the dominant in other afromontane forests in Ethiopia such as Belete (10%) (Hundera & Gadissa, Citation2008) and Komto (12%) (Gurmessa et al., Citation2012). The dominance of this family might be attributed to its evolutionary adjustment (adaptation) to a variety of ecological circumstances, and effective pollination and dispersal strategies.
Similar to the present study, previous studies in Gedo (Kebede et al., Citation2016) and Zengena Forests (Tadele et al., Citation2014) reported higher number of shrub species. The dominance of shrubs can be attributed to their capacity to withstand and adapt to disturbances (Hill & Hill, Citation2001). According to Pitchairamu et al. (Citation2008), shrubs and trees predominate in disturbed and undisturbed conditions, respectively. The predominance of shrubs would also indicate that the forest has recently been protected where active ecological succession is taking place.
Compared to the flora of Ethiopia and Eritrea endemic plant species proportions (Kelbessa & Demissew, Citation2014, 10%) and other similar studies in different forest patches of Ethiopia (Kebede et al., Citation2016 = 17.75%; Masresha et al., Citation2015 = 5.6%), the endemic species of Endiras Forest (4.4%) was lower. Differences in topographic barriers that hamper pollination and dispersal would lead to the isolation of species and independent evolution, resulting in a high number of endemic species (Vetaas & Grytnes, Citation2002). Conversely, higher environmental uniformity would lead to a lower endemic species proportion. Lower levels of endemic species might also be a result of the smaller size of the forest. Thus, in the present study, reduced topographic variability and small area coverage of the forest might contribute to the lower level of endemic species.
4.2. Species diversity
The overall species diversity of the forest (3.40) was greater than that of Yemrehane Kirstos (H’ = 2.88) (Abunie & Dalle, Citation2018), Abbo Sacred Forest (H’ = 2.99) (Yigeremu et al., Citation2022), Zijje Maryam Church Forest (H’ = 3.29) (Mekonnen et al., Citation2022), but lower than Bradi Forest (H’ = 3.84) (Yemata & Haregewoien, Citation2022). In addition, compared to the observed total species of Abbo Sacred Forest (J = 0.75) (Yigeremu et al., Citation2022), Tara Gedam Monastery forest (J = 0.65) (Zegeye et al., Citation2011), and Gosh Beret (J = 0.66) (Masresha et al., Citation2023), Endiras Forest had higher overall evenness (J = 0.85), indicating the presence of a relatively more equitable distribution of individuals among various species in the forest. A forest with the higher species diversity (H’ > 3.0) like the present study (H’ = 3.40) is considered stable and in a healthier condition that allows for more species interaction and is an indication of a good ecosystem condition (Kent, Citation2011)
4.3. Plant communities
The five communities identified from the forest entertain considerable variations in terms of habitat preference (distribution), species dominance, diversity, and area coverage. Looking into the first community, Vachellia lahai and Carissa spinarum community, it shared most of the surveyed area (38%) in the slightly hilly north-facing slopes of escarpments. The community was relatively dominated by trees and was the most diverse with a relatively even distribution of species. Thus, this community can be regarded as the most stable and healthy. This may be caused by the variability of the habitat, medium disturbance, topographic factors, and different combinations of these factors. Higher diversity may also be attributed to the sloppy nature of places that are difficult to disturb through selective cutting and grazing (Masresha et al., Citation2015). Conversely, Osyris lanceolata–Pittosporum viridiflorum shared the least surveyed area (12%) where large proportion of the area (83%) were gentle slopes largely facing north. The community was dominated by shrubs, and it was the community that had the lowest species richness, diversity, and evenness. Distribution of species in gentle slopes might expose the species to higher disturbances. Small area coverage (12%) and higher disturbances in the form of selective tree logging, grazing, and trampling might contribute to the least species richness, diversity, and evenness of the community. The remaining three communities (2, 3, and 5) in the study area shared medium area coverage (14–22% of the surveyed area) distributed at different altitudinal ranges and slopes facing in different directions. These communities had medium species richness, diversity, and evenness in between the two extreme communities (1 and 4) which might be associated with anthropogenic disturbances and topographic variability.
4.4. Structure
The overall density of adult woody species (DBH ≥2.5 cm) in the Endiras Forest (3252.5 stems ha−1) was greater than the density of Yangudi-Rassa (Beyene, Citation2010 = 427 ha−1) and Gedo (Kebede et al., Citation2016 = 781.94 ha−1). Differences in density might be explained by the intricate interplay of the many historical events and human disruptions. At a certain stage of succession, the forests might experience varying degrees of disturbances that would impact the species density. Higher densities of species such as Carissa spinarum (442.5 ha-1) and Maytenus undata (323.5 ha-1) could be attributed to low local demand as well as species’ resistance to grazing and trampling. In contrast, species with lower densities, such as Cordia africana (1 ha−1) and Ficus sycomorus (1.5 ha−1) might be due to their multiple uses or weaker resistance to disturbances.
The inverted J-shaped pattern, observed in the overall DBH classes of woody species, was a representation of the normal population structure and healthy regeneration of forest species, with the greatest density (individuals ha−1) in the lower DBH classes and a gradual decline towards the higher classes. Such a pattern is demonstrated by some other remnant dry forests in Ethiopia (Gurmessa et al., Citation2012; Hundera et al., Citation2007). This pattern is a sign of a forest species’ ability to regenerate and recruit normally (Senbeta et al., Citation2014).
However, population structure pattern provides important clues about specific species for the sustainable use and conservation strategies (Shibru & Balcha, Citation2004) by assisting in the understanding of the regeneration, and recruitment status of species (Teketay, Citation2005). In this study, various (4) patterns of population structure were observed, demonstrating various population dynamics among species. A J-shape pattern documented in some species was also observed Senbeta and Denich (Citation2006) and Gebrehiwot and Hundera (Citation2014). Such a pattern is observed in a species that has hindered regeneration and reproduction caused by loss of seed production due to aging or seed predators (Senbeta & Denich, Citation2006). The irregular (zigzag) distribution noted in some species was also observed in other earlier studies (Getnet, Citation2018; Masresha et al., Citation2015). Selective removal of trees may be the cause of this distribution pattern. The bell shape type was also reported by Zegeye et al. (Citation2011) and Gebrehiwot and Hundera (Citation2014). Poor recruitment potential of bell-shaped pattern may be due to fierce competition with neighboring species (Kuma & Shibru, Citation2015). An inverted J-shape, the commonest pattern in this study, was also reported by Senbeta et al. (Citation2007) and Didita et al. (Citation2010). Such a pattern demonstrates a healthy structural pattern with adequate capacity for species’ recruitment and regeneration (Senbeta et al., Citation2007).
In comparison to the typical basal area of tropical forests (35 m2 ha−1) (Midgley & Niklas, Citation2004), the study forest’s total basal area (17.23 m2 ha−1) was found to be significantly smaller. Likewise, Masresha et al. (Citation2015) and Yemata and Haregewoien (Citation2022) disclosed a signifiantly higher total basal area in Alemsaga (75.37 m2ha−1) and Bradi Forest (91.03 m2ha−1), respectively. The basal area is a better indicator of the forest’s structure and conservation status, where a lower basal area shows that the forest is made up of made up of shrubs and small-sized trees indicating recent conservation of the forest species and the converse is true for a forest with higher basal area. Since the relative importance of a species is measured by basal area, the species with higher basal area, Syzygium guineense, Terminalia brownie, Pittosporum viridiflorum, Searsia glutinosa, and Acacia lahai, are important species in Endrias forest.
The relative ecological importance of the species is well illustrated by its IVI value. Two of the top 10 species in IVI, Carissa spinarum and Maytenus undata, derived their higher IVI value from their large relative frequency and density, whereas Acanthus polystachius got it from its higher density. The comparable contributions of relative frequency, density, and basal area led to a higher IVI in Croton macrostachyus. However, Syzygium guineense, Terminalia brownie, Pittosporum viridiflorum, Searsia glutinosa, and Acacia lahai, all had greater IVI values due to their higher basal areas. A similar result was observed in the work of Yemata and Haregewoien (Citation2022), who justified that the higher IVI in trees was due to their large size. Such variations in the contribution of IVI might result from the habit and maturity level of the species. In most cases, shrubs get a higher IVI if they frequently occur with a larger number of individuals, whereas trees mostly get a higher IVI from their basal area (from their large size).
IVI reflects the extent of dominance of a given species in relation to the other species in a forest stand, which is vital to compare the ecological relevance of a species (Shibru & Balcha, Citation2004). Species with higher IVI are successful owing to their efficient dispersal mechanisms and resistance to disturbances and pests. The limited demand for the species by the local community for lumber and other building materials may also occasionally account for the species’ high IVI value (Gebrehiwot & Hundera, Citation2014).
The distribution of species among the five IVI classes showed that many species had lower IVI values, as the majority of the species were in the lower IVI classes. The IVI value of a species is used to prioritize species for management and conservation measures and aids in determining a plant species’ sociological status as either dominating or rare (Kent, Citation2011). While species with greater IVI values require monitoring and management, those with lower IVI values require high conservation efforts. Therefore, species are given a priori class (rank) for conservation which was made based on the IVI classes of species which in turn was based on IVI value of species. Thus, species with the highest prior class need immediate conservation action and species with the least priori class need regular monitoring management. Since they are at risk of local extinction, plant species in higher priority class (class 5), like Turraea holstii (0.16), Allophylus abyssinicus (0.21), Cordia africana (0.26), and Mimusops kummel (0.35) should receive the highest priority for conservation. Conversely, species in the lower priority class (1–2), such as Carissa spinarum, Maytenus undata, and Searsia glutinosa, may not need conservation measures rather regular monitoring, and species in the middle priority class (class 3), such as Bersama abyssinica, Grewia ferruginea, and Acacia Senegal, need conservation measures but not that much immediate.
4.5. Regeneration status
The overall regeneration status of the Endrias forest was in good condition. Abunie and Dalle (Citation2018) and Mekonnen et al. (Citation2022) disclosed similar results in Yemrehane Kirstos and Zijje Maryam Church forests, respectively. However, separate analyses showed 29% and 11% of the species were in good and poor regeneration status, respectively. In addition, several species (19.3%) lacked seedlings, which is a key stage for the survival and continuity of the species. Fourteen species including Buddleja polystachya, Dichrostachys cinerea, and Flueggea virosa were not regenerating as they were without juveniles. Comparable results were also reported by Yemata and Haregewoien (Citation2022) and Yigeremu et al. (Citation2022).
Trees made up the majority of the species with no seedlings and saplings, whereas shrubs provided the majority of the forest’s seedlings and saplings. The drivers of poor or absent regeneration in a species might be human activities (selective cutting before seed production) or problems associated with the seed bed and seed set (predation or abortion), as well as grazing and trampling. Therefore, shrubs’ superior resistance to disturbances and adaptation to various circumstances compared to trees can be used to explain why there are fewer or no seedlings in trees than in shrubs (Hill & Hill, Citation2001; Pitchairamu et al., Citation2008). Therefore, species with poor regeneration status (11%), without seedlings (19.3%) and without juveniles (without both seedlings and saplings) (19%) require immediate conservation action.
5. Conclusion and recommendations
From the result of the study, it can be said that Endiras Forest serves as an in-situ conservation site and is the repository for plant genetic resources, including endemic and threatened plant species recognized in IUCN categories. Grouping the forest species into different community types, varying in some degree of species diversity, could tell us to design different management options. Structural metrics such as DBH and basal area showed that the forest is composed of largely small trees and shrubs, characteristics of secondary forest, which is under active succession. Several plant species were found to have abnormal population patterns, small IVI, and few or no seedlings that indicate signs of local extinction. Therefore, species with low IVI value such as Turraea holstii, Allophylus abyssinicus, Cordia africana, Mimusops kummel, and Sapium ellipticum should receive priority of conservation measures. In addition, species with no or few seedlings including Ficus sycomorus, F. palmata, Celtis africana, Acacia persiciflora, and Buddleja polystachya as well as species with abnormal population structure such Terminalia brownii (J-shape), Albizia gummifera (irregular pattern), and Pittosporum viridiflorum (bell shape pattern) need proper managerial intervention.
Acknowledgements
Ethiopian Meteorological Agency is acknowledged for the provision of meteorological data.
Disclosure statement
No potential conflict of interest was reported by the author(s).
Data availability statement
The data used to generate the findings of this study are available from the corresponding author that can be provided upon request.
Additional information
Funding
References
- Abunie, A. A., & Dalle, G. (2018). Woody species diversity, structure, and regeneration status of Yemrehane Kirstos Church Forest of Lasta Woreda, North Wollo Zone, Amhara region, Ethiopia. International Journal of Forest Research, 2018, 1–17. https://doi.org/10.1155/2018/5302523
- Anjulo, A., & Mezgebu, A. (2016). Determinants of agroforestry practicing at Fogera District Northwest Ethiopia. Journal of Agriculture and Ecology, 9(4), 1–14. https://doi.org/10.9734/JAERI/2016/28310
- Asefa, M., Caoa, M., Hea, Y., Mekonnena, M., Songa, X., & Jie Yang, J. (2020). Ethiopian vegetation types, climate and topography. Plant Diversity, 42(4), 302–311. https://doi.org/10.1016/j.pld.2020.04.004
- Belachew, S. (2010). Floristic composition, structure and regeneration status of woody plant species of Sese Forest. Oromiya National Regional State.
- Beyene, S. (2010). Woody species composition and structure of Yangudi-Rassa National Park vegetation, Northeastern Ethiopia [ (Doctoral dissertation, M. Sc. Thesis (Unpublished)]. Addis Ababa University, Addis Ababa).
- Borsch, T., Berendsohn, W., Dalcin, E., Delmas, M., Demissew, S., Elliott, A. & Zamora, N. (2020). World flora online: Placing taxonomists at the heart of a definitive and comprehensive global resource on the world’s plants. Taxon, 69(6), 1311–1341. https://doi.org/10.1002/tax.12373
- Didita, M., Nemomiss, S., & Gole, T. W. (2010). Floristic and structural analysis of the woodland vegetation around Dello Menna, Southeast Ethiopia. Journal of Forestry Research, 21(4), 395–408. https://doi.org/10.1007/s11676-010-0089-9
- EBI. (2014). Ethiopia’s fifth national report to the convention on biological diversity, Addis Ababa Ethiopa.
- FAO. (2020). Global forest resources assessment main report,
- FAO (Food and Agriculture Organization of U.S.). (2010). Food and Agriculture Organization of the United Nations, 163. FAO Forestry Department, Rome. https://www.fao.org
- Friis, I., Demissew, S., & Breugel, P. V. (2010). Atlas of the potential vegetation of Ethiopia. The Royal Danish Academy of Sciences and Letters 1–312.
- Gebrehiwot, K., & Hundera, K. (2014). Species composition, plant community structure and natural regeneration status of Belete moist evergreen montane forest, Oromia regional state, Southwestern Ethiopia. Momona Ethiopian Journal of Science, 6(1), 97–101. https://doi.org/10.4314/mejs.v6i1.102417
- Getnet, A. (2018). Woody species composition, diversity and vegetation structure of dry afromontane forest, Ethiopia. Journal of Agriculture and Ecology Research International, 16(3), 1–20. https://doi.org/10.9734/JAERI/2018/44922
- Gurmessa, F., Soromessa, T., & Kelbessa, E. (2012). Structure and regeneration status of Komto Afromontane moist forest, East Wollega Zone, west Ethiopia. Journal of Forest Research, 23(2), 205–216. https://doi.org/10.1007/s11676-012-0242-8
- Hedberg, I., & Edwards, S. (Eds.). (1989). Flora of Ethiopia (Vol. 2). National Herbarium, Biology Department, Science Faculty, Addis Ababa University.
- Hill, J. L., & Hill, R. A. (2001). Why are tropical rain forests so species rich? Classifying, reviewing and evaluating theories. Progress in Physical Geography, 25(3), 326–354. https://doi.org/10.1177/030913330102500302
- Hundera, K., Bekele, T., & Kelbessa, E. (2007). Floristics and phytogeographic synopsis of a dry afromontane coniferous forest in the Bale Mountains (Ethiopia): Implications to biodiversity conservation. SINET: Ethiopian Journal of Science, 30(1), 1–12. https://doi.org/10.4314/sinet.v30i1.18277
- Hundera, K., & Gadissa, T. (2008). Vegetation composition and structure of Belete Forest, Jimma Zone, south western Ethiopia. Ethiopian Journal of Biological Science, 7(1), 1–15.
- Kebede, B., Soromessa, T., & Kelbessa, E. (2016). Floristic composition and community types of Gedo dry evergreen montane forest, West Shewa, Ethiopia. Acta Ecologica Sinica, 36(5), 392–400. https://doi.org/10.1016/j.chnaes.2016.07.001
- Kelbessa, E., & Demissew, S. (2014). Diversity of vascular plant taxa of the flora of Ethiopia and Eritrea. Journal of Biological Science, 13(Supp.), 37–45.
- Kent, M. (2011). Vegetation description and data analysis: A practical approach. 2nd ed. John Wiley & Sons.
- Kuma, M., & Shibru, S. (2015). Floristic composition, vegetation structure, and regeneration status of woody plant species of Oda Forest of Humbo Carbon Project, Wolaita, Ethiopia. Journal of Botany, 2015, 1–9. https://doi.org/10.1155/2015/963816
- Masresha, G., Getnet, A., Chekole, G., & Źróbek-Sokolnik, A. (2023). Woody species composition, structure, and regeneration status of gosh-beret dry evergreen forest patch, South Gondar Zone, Northeast Ethiopia. International Journal of Forestry Research, 2023, 1–16. https://doi.org/10.1155/2023/5380034
- Masresha, G., Soromessa, T., & Kelbessa, E. (2015). Status and species diversity of Alemsaga forest, northwestern Ethiopia. Advances in Life Science Technololgy, 34(1), 87–99.
- Mekonnen, A. B., Wassie, W. A., Ayalew, H., Gebreegziabher, B. G., & Vergara, P. M. (2022). Species composition, structure, and regeneration status of Woody Plants and anthropogenic disturbances in Zijje Maryam Church Forest, Ethiopia. Scientifica, 2022, 1–14. https://doi.org/10.1155/2022/8607003
- Midgley, J. J., & Niklas, K. J. (2004). Does disturbance prevent total basal area and biomass in indigenous forests from being at equilibrium with the local environment? Journal of Tropical Ecology, 20(5), 595–597. https://doi.org/10.1017/S0266467404001816
- NBSAP (National Biodiversity Strategy and Action Plan). (2005). National Biodiversity Strategy and Action Plan. Addis Ababa.
- Pitchairamu, C., Muthuchelian, K., & Siva, N. (2008). Floristic inventory and quantitative vegetation analysis of tropical dry deciduous forest in Piranmalai forest, Eastern Ghats, Tamil Nadu, India. Ethnobotanical Leaflets, 12(1), 204–216.
- Senbeta, F., & Denich, M. (2006). Effects of wild coffee management on species diversity in the afromontane rainforests of Ethiopia. Forest Ecology and Management, 232(3), 68–74. https://doi.org/10.1016/j.foreco.2006.05.064
- Senbeta, F., Schmitt, C., Woldemariam, T., Boehmer, H. J., & Denich, M. (2014). Plant diversity, vegetation structure and relationship between plant communities and environmental variables in the afromontane forests of Ethiopia. SINET, 37(2), 113–130.
- Senbeta, F., Woldemariam, T., Demissew, S., & Denich, M. (2007). Floristic diversity and composition of Sheko forest, Southwest Ethiopia. Ethiopian Journal of Biological Sciences, 6(1), 11–42. https://doi.org/10.4314/ejbs.v6i1.39038
- Shibru, S., & Balcha, G. (2004). Composition, structure and regeneration status of woody species in Dindin Natural Forest, Southeast Ethiopia: An implication for conservation. Ethiopian Journal of Biological Sciences, 3(1), 15–35.
- Silverown, J. (2004). Plant coexistence and the niche. Trends in Ecology and Evolution, 19(11), 605–611. https://doi.org/10.1016/j.tree.2004.09.003
- Stein, A., Gerstner, K., & Kreft, H. (2014). Environmental heterogeneity as a universal driver of species richness across taxa, biomes and spatial scales. Ecological Letters, 17(7), 866–880. https://doi.org/10.1111/ele.12277
- Tadele, D., Lulekal, E., Damtie, D., & Assefa. (2014). Floristic diversity and regeneration status of woody plants in Zengena Forest, a remnant montane forest patch in northwestern Ethiopia. Journal of Forest Research, 25(2), 329–336. https://doi.org/10.1007/s11676-013-0420-3
- Teketay, D. (2005). Seed and regeneration ecology in dry afromontane forests of Ethiopia: In seed production-population structures. Tropical Ecology, 46(1), 29–44.
- Vetaas, O. R., & Grytnes, J. A. (2002). Distribution of vascular plant species richness and endemic richness along the Himalayan elevation gradient in Nepal. Global Ecology and Geography, 11(4), 291–301. https://doi.org/10.1046/j.1466-822X.2002.00297.x
- Vivero, J. L., Kelbessa, E., & Demissew, S. (2005). The red list of endemic trees and shrubs of Ethiopia and Eritrea. Fauna and Flora International.
- Woldu, Z. (2012). Environmental and ecological data analyses. Basics, concepts and methods. Lamberet Acadamic Publishing, Addis Ababa.
- Yemata, G., & Haregewoien, G. (2022). Floristic composition, structure and regeneration status of woody plant species in Northwest Ethiopia. Trees Forest, 9, 1–10. https://doi.org/10.1016/j.tfp.2022.100291
- Yigeremu, A., Woldearegay, M., & Mansour, A. (2022). Woody species diversity, composition, and regeneration status of Abbo Sacred Forest, Southern Ethiopia. Scientific World Journal, 2022, 1–9. https://doi.org/10.1155/2022/9112578
- Zegeye, H., Teketay, D., & Kelbessa, E. (2011). Diversity and regeneration status of woody species in Tara Gedam and Abebaye forests, northwestern Ethiopia. Journal of Forest Research, 22(3), 315–328. https://doi.org/10.1007/s11676-011-0176-6