
 ?Mathematical formulae have been encoded as MathML and are displayed in this HTML version using MathJax in order to improve their display. Uncheck the box to turn MathJax off. This feature requires Javascript. Click on a formula to zoom.
Abstract
The paper examines the effect of war on food insecurity in Tigrai using data from 3245 households. The calorie intake approach and the Integrated Food Insecurity Phase Classification (IPC) were applied to measure the level of food insecurity and classify the phases. The logistic regression model was applied to identify the factors affecting food insecurity in Tigrai. The empirical result revealed that 77.38% of the households are food insecure with a calorie deficiency gap of 33.68 and 69.21% of them are classified in crisis phase and above. The war has caused the level of food insecurity and share of crisis phase and above to upsurge by 153.8 and 49.7%, respectively. It is also shown that conflict, price of commonly consumable cereals, age of the head, family size, support (aid), and access to electricity and financial services are affecting the level of food insecurity in the region. To cope with the war-induced shortage of food, households reduced the quality and quantity of food they consumed, sold off livestock and assets, used their savings, requested support from family, NGOs, and the government, ate inedible green leaves, migration, and begging.
HIGHLIGHTS
Tigray is one of the regions in Ethiopia located in the Northern tip of the country. The war in Tigray, which started on 4 November 2021, destroyed the economic, social, political, and environmental landscape and aggravated the level of food insecurity in the region.
77.38% of the households are food insecure and the calorie deficiency gap is estimated at 33.69 and 69.29% of the households need urgent lifesaving support. The war increased the number of food-insecure households by more than 153% and the number of catastrophe households by more than 87%.
The severe food insecurity is a man-made famine where the Ethiopian and Eritrean government military forces and the Amhara ‘fano’ and militia have destroyed all the economic bases of the households; looting cereals, livestock, assets of the people, burning crops, slaughtering livestock, blocking humanitarian assistant, total and partial blockage of electricity, banking services, and others.
REVIEWING EDITOR:
1. Introduction
1.1. Background and justification
The world history tells us the occurrence of so many devastating wars in the various corners of the globe. Though there are variations in the nature, motivation, and aims of the wars occurred, economic, political, and social motived wars have dominated the wars that arose in the world.
The theoretical literature on the impact of civil conflicts/wars on economic growth provides two conflicting views. The first view is associated with Benoit’s hypothesis of war (Benoit, Citation1978) which states wars affect positively economic growth and development since military expenditures are treated as expansionary policy tools. War can increase GDP per capita by reducing unemployment, and improve production and infrastructure by shifting people from family formation and other non-market activities into wartime production. Using an endogenous growth model, Lai et al. (Citation2002) confirm that the rise in military expenditure tends to stimulate the sustained economic growth rate which supports Benoit’s hypothesis. Reno (Citation1998) supported the functional approaches to violence and civil war and explained that violence and instability often serve a range of political, social, and economic functions for individuals. Appreciating and considering the economic benefits of peace as given, De Groot et al. (Citation2022) stated that wars brought economic benefits to countries that fought far away from home due to their domestic military spending while causing damage to foreign territories. They added that high-income countries are, also, benefited from their external participation in the conflict of the developing countries which are hit hardest by the conflict.
In contrast, significant numbers of studies argue that war damages the economy through the destruction of resources and by reducing investment. Food insecurity and armed-conflicts are the two major problems that have aroused the attention of international institutions, political analysts, and governments in developing countries. Civil wars and conflicts have been associated with food insecurity in the developing world. Civil strife affects food security in developing countries due to its detrimental effects on the agricultural sector and on the economy (Pierre & Fred, Citation2006).
The armed-conflict in Yemen caused 8.4 million people to be classed as emergency and catastrophe and reduced the crop, livestock, and fish production and, as a result, their supply has been reduced to local markets (FAO et al., 2017). More than 85,000 children have died due to lack of food and hunger resulting from the long-lasting war in Yemen (Save the Children International, Citation2017). In Syria, the civil war resulted in severe food insecurity and all forms of malnutrition. It caused about 12.4 million people to be food insecure and 1.3 million to be severely food insecure. Similarly, about 600,000 and 90,000 children are chronically and acutely malnourished, respectively. The overall food insecurity has grown from 42 to 71% during 2020. The impact of the continued Syrian crisis during 2020 has led to a 21% (13.4 million) increase in the number of people in need of humanitarian assistance (Humanitarian Programme Cycle, Citation2021).
In Somalia, rampant due to conflict and erratic weather, large numbers of people are facing high levels of acute food insecurity. Between January to June 2021, about 1.6 million Somali people are experiencing high levels of acute food insecurity (IPC Phase 3 or above) and need sustained urgent action (IPC, Citation2021). In 2020, conflict, weather extremes, and economic shocks, including COVID-19 related economic effects again constituted the three primary drivers of acute food insecurity. However, the drivers are often interlinked and mutually reinforcing, rendering it difficult to specify a singular trigger of each food crisis. Conflict drove internal and cross-border displacement, deprived people of their livelihoods, disrupted markets, trade, and crop production, prevented herders from accessing their pasturelands, and contributed to high food prices. Conflict also constrained humanitarian access, leaving communities without essential assistance, and exposing aid workers to increased risks (FSIN & GNAFC, Citation2021).
Conflicts expressed in terms of the large number of fatalities are correlated with a large estimated reduction in the national dietary energy supply of countries (Stijn, Citation2018). Verwimp (Citation2012) also stated that conflict affects the food security situation of the farm households via its effect on income sources, local food chain, and political systems.
A study made in Afghanistan confirms the inverse relationship between conflict and food security. Households in provinces with higher levels of conflict experienced lower levels of food security than provinces with lower levels of conflict as there were staple food price increases in the provinces with lower levels of conflict (D’Souza & Jolliffe, Citation2013). Further, the conflict caused the destruction of rural infrastructure, the loss of livestock, deforestation, the widespread use of land-mines, and migration leading to long-term food security problems (Teodosijević, Citation2003).
After the bloody civil war ended in 1991, the Ethiopia government carried out several economic reforms to improve the livelihood of people and securing inclusive development. Since the founding policy direction of the nation, ADLI strategy, till the GTP II, the country has introduced several policies and strategies which would help to achieve economic successes; recording an economic growth rate of averaging 10.6% for successive 12 years (2005–2017), reduced the level of poverty to around 24.1% and improve the provision of social services National Planning Commission (NPC, Citation2017). Additionally, even though the level of food insecurity in Ethiopia is driven by drought, COVID-19, displacement, conflict, and others, the number of food insecure households in Ethiopia dropped from 40% in 2014 (WFP & CSA, Citation2014) to 16% in 2020 (IPC, Citation2020).
Tigrai has also achieved several economic and social triumphs. In its second growth and transformation plan period (2016–2019), the GDP of the region was grown by 8.1% and the share of food insecure households was reduced to 25%. In this period, agriculture had the highest share in GDP (38.5%), followed by services (34.6%) and industry sectors (26.9%) Tigray Statistics Agency (TSA, Citation2020). Resulting of the successive economic growth in the region, the level of poverty was reduced from 61.4% in 1995/6 to 31.8% in 2010/11 and 27% in 2015/16 and is believed to further reduce to <24% in 2020. IPC (Citation2021) pointed out that the severe crisis of the acute food insecurity in Tigrai was mainly due to the recurrent conflict, large population displacements, movement and access restrictions, limited humanitarian access, loss of production, loss of livelihood assets, dysfunctional or non-existent markets, and loss of income. FAO (2021) stated that the outbreak of the war in the Tigrai resulted in the destruction of livelihoods, internal displacement, and high levels of violence in the region. Furthermore, the armed-war has brought about the destruction of the social services providers which aggravates the incidence of food insecurity in the region.
The inconsistency in the empirical findings on the link between war and food insecurity and the lack of war-time status of food insecurity, depth, and model-based determinants of food insecurity in Tigray made this topic a researchable area. The paper assesses the war time status of food insecurity, analyze acute food insecurity phases, and investigates the determinants of food insecurity in Tigrai using the consumption approach and the first level-acute food insecurity phase classification. Despite the study has a limitation to capture the food insecurity situation in the whole Tigray as the secure and accessible woredas are included, it has significant contributions to humanitarian aid actors and governments to provide lifesaving support in a coordinated manner, prioritizing demands & target groups and substantiating for rehabilitation works and enhance the existing literature on conflict and food insecurity in developing countries. The paper is organized into four chapters. The succeeding chapter deals with the methodology of the study. The third chapter is the result, analysis, and discussion section. The last chapter contains the conclusion and recommendations forwarded.
2. Methodology and data sources
2.1. Source, nature, and sampling technique
2.1.1. Description of the study area
Tigrai, in the Ethiopian history, is the base of ancient civilizations, the home of the Arc of covenant, an exemplary host and center to exercise various religions, especially the Christianity and Muslim, and historic grave place for invaders, and a symbolic region of struggling for freedom, equality, and justice. Tigrai is one of the ten regions of Ethiopia. Its capital, Mekelle, is 781 km far away from Addis Ababa, capital city of Ethiopia. The region has seven zones, namely, Western, Northwest, Central, Eastern, Mekelle, Southeast, and Southern. The zones are divided into 93 woredas and towns and 814 tabia,Footnote1 also referred to as kebele (OCHA, Citation2021).
In the year 2021, the population of the region is estimated at 5,685,598 (OCHA, Citation2021). With an average family size of 4.2 persons (2021 est.), 49% of the population were male headed households and 50.7% led by female. The age composition of the population is dominated by the young where 13% were estimated to be <5 years old and 50% were under the age of 18 years. Further, 30% of the Tigrai’s population is living in the urban areas (OCHA, Citation2021).
2.1.2. Research design and data source
This study employed a cross-sectional type of research design where the quantitative and qualitative types of data are used. It depends on the primary and secondary sources of information. The primary data was collected through semi-structured questionnaire, focus group discussion (FGD), key informant interview (KII), and participatory rural appraisal (PRA). One FGD and one PRA were organized in each study tabia and seven participants were selected from the associations, like women’s association, youth association, farmers’ association, religious leaders, and community leaders. Further, 34 KII were done with food security cluster experts and the Relief Society of Tigray (REST) focal person in the woreda who have ample information about the livelihood and food security situation of the people. The primary data was collected between 4 May 2021 and 4 June 2021Footnote2 in the selected woredas of the region. The data was collected from 34 woredas in the region; 17 rural woredas and 17 urban woredas. All the target respondents & discussants were asked for their willingness to participate in the survey and discussions and verified with full consent.
The secondary data was collected from statistical bulletins, published reports, and monthly briefs of USAD, WFP, and OCHA and unpublished research works, and annual reports of the Regional Government of Tigray.
2.1.3. Sampling technique and sample size determination
The study used multi-stage sampling techniques to select participants of the study. First, zones were classified based on accessibility and security criteria, depending on the military and transportation information, into three namely, totally inaccessible and in secure,Footnote3 insecure but accessible, and both accessible and secure. Second, based on the intensity of wars and physical destructions that occurred,Footnote4 the relatively accessible and secure woredas were classified into three categories, i.e. severely affected, moderately affected, and less affected. Two tabias from each woreda were randomly selected for the survey. Since the war destroyed the registry of the households in the tabia, the representative households were selected using the directional sampling technique.
In determining the sample size, the Kothari (Citation2004) equation was employed as it is appropriate when the population size is large (>10,000) and finite. The proportion here is that 72% of the woredas were severely affected and the rest 28% were affected moderately and/or less. A total sample was determined from the total household population (1,339,831) of the region (TSA, Citation2020).
n = sample size, N = pop size, p = population proportion, Z = confidence level, e = degree of error.
Thus, by taking a confidence interval of 99% (z = 2.58), margin/degree of error of 2%, proportion (P) = 72%, the initial sample size was 3346. The war affected the movement of researchers and enumerators across the region and reach the target population, as a result, 20% of the sample size is added as a contingency for none return, incomplete responses, data loss, and other defects and the total sample size was determined to be 4016. Then, this was distributed to the zones, woredas, and tabias based on a proportional sample to population size. The sample was also disaggregated by urban-rural proportions (urban = 1354 and rural = 2662).
However, data was collected from 1,345 urban and 1,900 rural residents. About 764 (19.1%) of the sample were not included in the survey due to the accessibility challenges. Besides, 7 observations were dropped for their incomplete consumption data (refer to for sample size distribution by gender).
2.2. Methods of data analysis
The study used both the qualitative and quantitative studies. The status of food insecurity and its determinants and the integrated acute food insecurity phases are estimated using the quantitative approach and are strengthened using the qualitative data collected through the PRA, FDG, and KII.
2.2.1. Measuring food security
Household level food security was measured based on its calorie requirements and calorie intake. Using the 2200 kcal per adult per day as the required calorie to lead a healthy and moderately active life, the food security estimation was carried out Ministry of Finance and Economic Development (MoFED, 2012). A household is categorized to be food insecure if its total calorie intake falls short of its calorie requirements; otherwise, it is food secure. Besides, the depth and severity of food insecurity were also computed at the household level. To count the number of food insecure households and estimate the calorie gap against the standard, the modified version of the Foster-Greer-Thorbecke (FGT) index was used.
Let be the required calorie per adult equivalent,
is the actual calorie intake (adult equivalent) of individuals below the required level,
is the number of households,
is the number of food poor households normally those below the required threshold, α is the food poverty aversion parameter (Ejigayhu & Abdi-Khalil, Citation2013; Sidhua et al., Citation2008; World Bank Institute, Citation2005).
Then, the status of food insecurity /FIS/i, which is the observed food insecurity status of the household i is:
(1)
(1)
Where α in this context assumes a value of 0, 1, and 2; if the value of α = 0, the FIS indicates the proportion/percentage/of food insecure households in the total number of households and when α has a value 1, FIS represents the food insecurity gap. Thus, the depth of food insecurity is the deficiency in calorie requirements (gap between required and actual intake of calories) as a proportion of total calorie requirements.
2.2.2. Integrated acute food insecurity phase classification (IPC phase)
The severity level of acute food insecurity was examined using the Integrated Acute Food Insecurity Phase Classification (IPC phase) using the computed food insecurity estimates. There are three IPC scales, namely, acute food insecurity, chronic food insecurity, and acute malnutrition (IPC, Citation2019). The IPC scale has become the global standard for the classification of acute food insecurity and is used mainly to inform decision-makers on allocating and programming resource worldwide and within countries. The IPC Phases are, namely Phase 1 (Minimal or none), Phase 2 (Stressed), Phase 3 (Crisis), Phase 4 (Emergency), and Phase 5 (Famine (areas) or Catastrophe (households) (IPC, Citation2019) (refer for details).
There are two food security outcomes, namely first-level outcomes include food consumption (Quantity and nutritional quality) and livelihood change (Assets and strategies) and second-level outcomes include nutritional status and mortality (IPC Global Partner, Citation2019). For this study purpose, the first-levelFootnote5 outcomes approach was employed.
2.2.3. Determinants of acute food insecurity
Econometrics models are very useful tools that enable to assess the relationship between the regressed and explanatory variables and determine their significance. Therefore, the accuracy and relevance of any policy implication or general research results mainly depend on the proper specification of the model.
To determine the factors influencing food insecurity during the war time, we employed the logistic regression model, with the dependent variable being dichotomous variable.Footnote6 If the dependent variables are categorical variables, a logit model is the appropriate one (Gujarati, Citation2007; Madala, Citation1992). In this study, household variables, community level factors, and economic and social variables were controlled, and examined their effect on acute food insecurity.
Let the underlying response variable is defined by the regression relationship as adopted by Alemayehu et al. (Citation2005) and Teka et al. (Citation2018) is represented as follows:
(2)
(2)
Where: is the status of household
(food secure vs. food insecure),
is set of coefficients,
is set of explanatory variables (determinants),
is the error term, and
represents the households that run from 1 to n.
Thus, as is a latent variable, what is observable is an event represented by a dummy variable
defined by:
(3)
(3)
So, the response of the variable is a binary, taking two values, 1 if the household is food secure, and 0 otherwise. The probability of being poor depends on a set of variables so that,
(4)
(4)
Where: is the cumulative distribution function for the error term
The logit is the natural logarithmic value of the odds of the food secure and food insecure households. Therefore, the estimable logit model after transformation is given as:
(5)
(5)
Where: is the natural log of the odds of households being food secure.
is the estimated probability of households being food secure evaluated at the mean.
,
, ….
are the explanatory variables.
,
, ….
are the estimated coefficients of the jth explanatory variables.
Furthermore, the OLS regression was also applied to assess the determinants of food insecurity using the calorie per adult equivalent per day and the food consumption expenditure per capita.
3. Results and discussions
3.1. The war in Tigrai
The war between the federal government of Ethiopia and the regional government of Tigray occurred on 4 November 2021. It is, believed, to be an outcome of the political tensions, disagreements, and violation of the constitutional order in the country. The conflict is differently stated and there is no agreement on the objectives of the war. The federal government of Ethiopia and its supporters have termed it as ‘act of law enforcement’ and some Amhara regional government officials and their affiliated activists also termed as ‘act of law enforcement and securing fief’. On the other hand, the regional government of Tigrai and its supporters stated that the federal government, allied with Eritrean government, has declared war against Tigrayan identity, cleansing Tigrayans, destroying the federal system in the country, and harming Tigrai economically, socially, and politically. So, it was termed as ‘a challenge against all round invasions’. What so over the terminology, both the federal government, regional government of Tigrai, UN, international organizations, and media have witnessed the involvement of many actors/countries and the deployment of full-flagged military forces; UAE’s drones, air-force, mechanized army, hundreds of thousands of Ethiopian troops and paratroopers, Eritrean troops, Amhara special forces, and fano/militia, Afar special forces and militia and others and caused unquantifiable death, destruction of wealth, starvation and displacement (Bruke & Sabbage, Citation2021; Center for Preventive Action, Citation2023; Omna Tigray, Citation2022).
Though the war was initiated to achieve a certain political game; with all measures, it was a devastating war and considered as ‘genocidal war’. The World Peace Foundation (Citation2021) explained that the Ethiopian and Eritrean governments, who are the main actors in the war in Tigrai, were intentionally, systematically, and prevalently starving the people of Tigrai and extensive risk of famine is shadowing badly. The regional government of Tigrai also accused the Ethiopian government and its supporters for they started the war in Tigrai to extinct the people of Tigrai from the world by closing all the communication means like the telecom, electricity, banking, and transport services and encircled to totally vanish the people in a short period of time. They exercised all forms of genocide in the people of Tigrai; they used famine, rape, abduction, and killing of innocent people as a weapon of war in the region.
Oxford Committee for Famine Relief (OXFAM, Citation2021) also stated that the people of Tigrai had lost their farm tools, seeds, and livestock which made the livelihood of the people to be misery and made more than five million people to face extreme hunger. FEWS NET (Citation2020) also criticized the acts of the Ethiopian government for its deliberate outage of connections, blockage of transport and aid convoys to cross to Tigrai and cautioned emergency Phase is expected in parts of Tigrai in 2021 if the access constraint persists.
3.2. Household features
In this study, regardless of the sample size and the number of woredas included, the data were collected from all zones, all social and economic status, and type of settlement of the region.
The central zone accounts 26.35% of the sample households followed by the IDP, mainly from Western zone (17.16%), Eastern zone (15.62%), Northwestern (12.63%), Southeast (12.54%), Mekelle (11.68%), and Southern zone (10.76%). In addition, 64.28% of the sample households were male headed and the remaining share (35.72%) were female headed households (see ). The average age of the head of the households was 44.3 years and the mean family size was 4.5 persons.
The sample households had various levels of educational status. The major share was the illiterate households (32.54%) followed by primary education (27.92%), secondary school (16.64%), religious education (5.33%), first degree (9.77%), diploma holders (6.1%), second degree (5.14%) and terminal degree holders (0.15%). The married heads of households in the sample had share of 74.79%, divorced (11.74%), widowed (10.08%), single (3.08%), and others (0.31%). Religion wise, orthodox accounted 93.13%, Muslim (6.59%), catholic (0.15%), and protestant had share of 0.12% (refer ).
3.3. The war-time status of food insecurity
Tigrai was known for its efforts to tackle food insecurity and reduce the deep-rooted level of poverty. Due to the war in Tigrai, the level of food insecurity, malnutrition, and lack of access to basic social services are believed to be at their highest level ever. The food security analysis result () indicates that 77.38% of the sample households were food insecure, and they did not meet their essential food needs without engaging in atypical coping strategies. Only 22.62% of the surveyed households were food secure.
The food insecurity gap is estimated at 33.68% which indicates that the food insecure households need, at an average, 740.9 kcal per adult equivalent a day to get the required calorie and lead healthy life. The severity of food insecurity/the energy deficiency severity/in the households is estimated to be 18.5%.
The level of food insecurity was higher in the rural areas than the urban counterpart which differs with the nature of the woreda. Accordingly, the proportion of households who had inadequate food calories consumption constitutes 81.17% of the sample rural households. 75% and 72.85% of the households in the urban areas and small towns were food insecure, respectively. The result in also portrays that the food insecurity gap was higher in the rural areas (36.68%), followed by the small towns (33.02%) and the urban areas (30.35%).
According to the report by Tigrai Statistics Agency (TSA) and Mekelle University (MU) (2019), 41.28% of the households in the region were mild, moderately, and severely food in secure. A study made by the World Food Program (Citation2019) shows that 24.7% of the households in Tigrai are food insecure. Another study made by Mekelle University and BoPF (2018), also stated that 75% of urban residents and 54% of the rural households had enough food for the 10–12 months of the year. The NPC (Citation2017) also indicates that level of food poverty in Tigrai was markedly declining overt time. On average, 1995/6–2015/6, the food poverty was reduced by more than 3.2% per year. In the year 2015/18, 32.9% of the households were food poor which is expected to be 29.7 in the year 2020/21.
Based on the above information, more importantly, the current magnitude of food insecurity in the selected woredas of the region was 213.3% higher than the findings of the WFP (2019), 160.5% higher than the regional food insecurity level reported by the NPC and 87.8% higher than the study made by TSA and MU (2018). Moreover, at an average, the incidence of food insecurity is 153.8% higher than the previous levels of food insecurity in the region. The war induced extremely high level, depth, and severity of food insecurity in Tigrai was consistent with food insecurity level of countries while they enter to war like Yemen, South Sudan, Somalia, Syria, and others.
There is a variation in the magnitude and gap of food insecurity across the study zones of the region. The highest level of food insecurity was observed in the Central zone of Tigrai (85.39%) followed by Northwest zone (77.36%) and Mekelle zone (73.88%). The Eastern zone, South-east, and Southern zone of Tigrai had food insecurity level of 72.38, 69.52, and 68.39%, respectively. The highest calorie deficient zones are also featured by high level of food gap which ranges from 40.18% in the Central zone to 27.01% in the Southeast zone. The food insecure households in the Northwest zone had food gap of 32.62% followed by Eastern zone which had food gap of 30.62% and Mekelle zone (29.6%).
Even though there is no significant difference in the magnitude of food insecurity, based on nature of woreda understudy, 81.17% of the sample households in the rural areas, 75% in the urban areas and 72.85% of the households in the small-town setting were found food insecure households. The incidence of food insecurity differs in magnitude across the woredas in the study area. 31.4% of them had food insecurity level of above 80%, 47.1% of them also placed in the range of 70–80% and the remaining share (21.5%) had food insecurity level of 60–70%. Adwa, Rama/Aderbete, Laelay Maichew, Adwa town, ‘Kifle ketema’ Hawelti, Tahtay Koraro, Adigrat, Aksum, Ahferom, Endabaguna town were the woredas which had severe level food insecurity of above 80% ().
The food insecure households had higher average family size (4.89) than the food secure households (3.32). Thus, food insecure households are typically large families headed by unemployed head of household. Before the outbreak of the war, 4.49% of the respondent households were unemployed. However, following the war in Tigrai, 48.32% of the households are forced to lose their job and became unemployed. The remaining share perceived as if they are in their previous type of employment, but they are less productive and inefficient to generate income to support their families.
The FGD, KII, and PRA result also supported the existence of extremely high level of food insecurity in the study areas. The awful rise in the price of goods and services, particularly the commonly consumed cereals, such as ‘taff’, wheat, maize, barely, beans, oil, and others have a significant impact on the reduction of food consumption at the household level. The war created the permanent and temporarily closure of the banking services which hampered households to use their savings, lack of access to electricity, transportation & market for consumables contributed to the high food insecurity in the study areas. The market was not functioning properly; people were afraid to go to market and the Ethiopian government and its alliance forces were looting and destroying their wealth so that they fail to supply to the market and only few traders were dominating the system where the interim government’s offices were collapsed to manage and regulate the market. As a result, the price of goods and services reached the climax where households could not afford to purchase and refrained consumption of the foods items they need. Very few humanitarian aid (food aid) distributions have been done to those who need immediate and continuous support. Though there were trials of food aid distribution, it was highly limited in its coverage, full-package,Footnote7 and continuity. In fact, Ethiopian government officials were repeatedly criticized foreign humanitarian aid distributed to rescue the 1985 famine as it was helping TPLF to be strong and able to win on the battlefields. Therefore, they used all the evil alternatives to oppress & terrorize the people to detach easily from TPLF. The quantitative and qualitative findings witnessed that the Ethiopian government was using famine as a weapon of war in Tigrai and the severe level of food insecurity was, basically, man-made.
3.4. War-time phases of acute food insecurity
Generally, the armed-conflict that took place in Tigrai affects the households’ acute food insecurity with different levels of severity among households, place of resident, and demographic features.
An IPC severity of acute food insecurity () revealed that 22.62% were in phase 1, 6.07% of households were in Stressed phase, 7.24% of the households were in Crisis Phase, and about 17.32% of households were in Emergency Phase. In addition, 44.71% of the households were placed in Catastrophe Phase in March 2021. The share of households placed in the crisis phase and above in this study (69.27%) is similar to what the USAID assessed from October to December 2020 (70.2%). However, the share of the crisis phase and emergency phase in 2020 was moved to the next phase as the war in Tigrai worsened the food insecurity situation of the households. As a result, 62.03% of the households were placed in the emergency phase or above which verifies the ‘existence of disquieting famine’ in the region.
This severe acute food insecurity might result from the cascading effects of the war, including high population displacements, movement restrictions, very limited humanitarian access, looting of cereals, livestock & livelihood assets by the Ethiopian and Eritrean troops and the Amhara Special Forces, militia and ‘Fano’, and the limited functions of markets in the region.
Further, the IPC Phase area classification indicated that the magnitude of acute food insecurity was diverse across the zone. Accordingly, the three zones with the highest number of households in phase 5 were the Central, Northwest, and Mekelle.
In the Central zone (), 56.8% of the households were classified in IPC Phase 5 followed by emergency (17.48%). 5.99% of the households in the Central zone were also in the crisis phase and the remaining 5.12 and 14.6% were in the crisis phase and phase 1 of food insecurity, respectively. The Northwest zone of the region had the second highest number of households placed in phase 5 (46.6%), and 16.8% of them were placed in the Emergency phase. Further, 7.8% of the households were classified as crisis phase and the stressed phase accounted 5.8%. Mekelle zone was ranked third in terms of the number of people who are facing catastrophic conditions (41.42%). 17.94% of the households were classified as Emergency phase, and the crisis phase and the stressed phase had a share of 6.9 and 7.7%, respectively.
Comparing these findings with the October-December 2020 data, , except for the Mekelle and Western zone, the share of households in the catastrophe phase was 34.6% higher than the October to December 2020. The October to December 2020 share of the emergency was 15.2% higher than the March 2021. Moreover, the share of households in the crisis phase in March was 31.8% lower than that of October to December 2020.
As can be depicted from , further, the share of the stressed, crisis, emergency was higher in the October to December 2020 study than in the March findings. The share of households in the stressed phase in March was 17.9% lower than the October-December index. From the comparison and the status of IPC classification in Tigrai, the war has a negative impact not only on the level of food insecurity but also on the depth and severity of acute food insecurity.
Households in all the surveyed woredas (), were placed in the emergency and catastrophe phase. Six woredas, such as rural Adwa (64.09%), Adwa town (59.68%), Naeder (5.21%), Ahferom (58.02%), Tahtay Koraro (51.04%), and K/ketema Ayder (50.48%) were having more than 50% of the households placed in phase 5. The higher number of households in phase 5 and phase 4 clearly justifies the presence of the critical shortage of food to eat which might be due to the food stock depletion, lack of humanitarian aid, selling of both productive and livestock assets of the households in the woredas. In fact, this study indicates that, November–March 2021, 41.97% of the households received humanitarian support (aid) from the government, non-government organizations, and community. The households who received aid from the government and non-governmental organizations accounted for 30.17% and 11.8% of them also received support from their families, individuals, and local community.
Furthermore, the findings of this work show that the household members were facing different challenges associated with a lack of food. On average 1.2 family members were exposed to one or more of the challenges/human crises/of food shortage. Similarly, on average, one family member loss weight due to lack of food and related diseases which might result in death and/or repeated tiresomeness and stunting. In addition, due to a lack of sufficient and nutritious food, the share of family members who reduced their weight and faced repeated illnesses accounted for 18.2 and 13.13%, respectively.
Moreover, 25.49% of the households were getting food support only once, 9.18% of them received two times and 5.3% responded as they got three times and more. Though a certain number of the households were beneficiaries of the food aid, the quantity of cereal, pulses, and oil did not consider the family size they have, they received for <30% of their family; not as per the intentional standard and the distribution was unfair. During the five months period (Nov-March), very small quantity, below the standard, of cereals, pulses, and oil was distributed to the households. The average amount/quantity of food items distributed to the households were 47.69 kg. These issues were also be evidenced from the FGD and KII carried out in the selected woredas.
The FGD and KII results on the status of food insecurity and severity also substantiate the findings of the food insecurity phase classification stated above which supports the existence of severe food insecurity and the prevalence of the emergency phase and the catastrophe phase in the study woredas. As a result, there were situations, like in Adwa, where households are forced to eat green leaves (boiling ‘moringa’ and others like ‘Birnihyo’ and mixed with flour); normally it is not among the human feeds. Households were eating mainly once a day, reducing the quantity and quality of food they eat, and use any kind of flour as a sauce ‘Tsebhi’ as they could not get pulses, oilseeds, and beans which basically serve as sauce/’Tsebhi’/in Tigrai. Further, to a larger extent, there were households who used roasted and ground maize as sauce. They used flour soup/’Suwqo’ to escape the shortage of food; this type of meal is mainly used during critical shortage of food.
Further, there were households who used ‘water and salt’ as a sauce. More importantly, there were households who started begging for cereals from their neighbors and community and lastly migrated to other areas. Moreover, the FGD result depicts the death of people and children, and mothers were malnutrition, like in Ahferom, Aksum, rural Adwa, Adwa, Naeder, and Rama. These all cases or events are evidences for the presence of extremely large food gaps and severe food insecurity in the region. If immediate support is not continuously and regularly given to the people, more people will die in the coming few months.
3.4.1. Rural-urban variations in the phases of acute food insecurity
The IPC Phase analysis revealed that there are no significant variations in the severity of acute food insecurity. The severity of acute food insecurity was higher in rural areas than their urban counterparts. The IPC analysis in indicates that there were variations in the level of severity of acute food insecurity between rural and urban areas. The comparison, by place of resident, shows that rural had the highest share of acute food insecure households (47.69%) in the catastrophe followed by emergency (16.63%). Moreover, 66.96% of the households were in the Crisis or worse.
The small-town form of settlement was the second category (43.36%) in terms of the share of catastrophe. 17.01% of its households were classified as Emergency phase. Further, slightly lower than the small towns, 42.23% of the households in the surveyed urban areas were in phase 5 which is characterized by extreme food gaps.
3.5. Determinants of households’ acute food insecurity
To assess the factors affecting the food security in the region, the logistic regression model (mainly) and multiple regressions were employed. Seven separate regressions were carried out to examine the functional relationship between the dependent variable and the regressors. The calorie per adult equivalent per day, food expenditure per capita, and food secure/insecure (dummy) were the dependent variables; and both conflict,Footnote8 household characteristics, community level variables, economic and social variables were used as regressors (see ).
Depending on the model used and the explanatory variables included, the magnitude of the R2 (0.001–0.342) and RMSE (1.376–0.127), the commonly measure of goodness fit of the model, indicates the model is moderately fit as 34% of the variation in the outcome has been explained by the independent variables included in the model. Generally, the lower the RMSE and the higher the R2 indicate the better the model and its predications.
The status of food insecurity is measured by the calorie intake per adult equivalent to a day or the food expenditure households incur to get the required calorie, commonly known as the food poverty. In panel 1 of , the link between food insecurity and conflict was assessed and the result supports the inverse relationship. Further, the link was tested using the calorie intake (panel 2) and a similar result was observed. However, the food insecurity situation of the households was not only influenced by the conflict, but also other factors have fundamental effects; price effect comes at the first place.
To examine the effect of price change on food security, the price of the commonly used food items was considered. Price of taff (mixed and red), wheat, maize, and barely were used in the regression. Besides, the change in price due to the conflict was also included in the regression using the interaction of conflict and price of the widely consumed cereal in the region.
The results in panel 3 of depict the negative impact of the price on food security measured by the calorie per adult equivalent a day. The price of red ‘taff’, barley, and wheat were statistically significant factors determining food security in Tigrai at 1% level of significance. Thus, a one percentage increase in price of red ‘taff’, barley, and wheat reduced the kilo calorie per adult equivalent a day by 0.057, 0.094, and 0.115 percentage points, respectively.
The effect of household level features was addressed and controlled in panel 4. Family size, marital status, and age of the head are found significant to impact the calorie intake per adult equivalent a day. As a result, a one percentage increase in the family size of the household reduced the kilo calorie per adult equivalent a day by 0.946 percentages. Households led by married headsFootnote9 consumed a higher level of kilo calorie per adult equivalent a day than the unmarried heads, and a one percentage change in the age of the head reduced the kilo calorie per adult equivalent a day by 0.07 percentage points. Further, other community, economic, and social variables were controlled in the regression (panels 5, 6, and 7). The regression results in panels 5, 6, and 7 also depict that conflict significantly reduced the food security situation of the households expressed in calorie per adult equivalent, food consumption expenditure, and whether the household food secure or not (Security-dummy).
The determinants of food security, using the logit model, were examined and presented in panel 6 of . The figures indicate that conflict negatively and statistically significant variable to influence food security. The higher the level of conflict, the higher the likelihood of the household being food insecure as estimated. The prices of the commonly consumed cereals also affect the food security of the households. Price of red ‘taff’, barley, and wheat reduced the probability of being food secure by 0.26, 0.373, and 0.368 at 1% level of significance. The war itself affects the price of goods and services across the zones and woredas. To control such incremental effect on the price of consumable goods and services, it was interacted with the conflict variable, which had a negative effect on the level of food security of the households. As a result, the change in price of goods increases the likelihood of the households to be food insecure by 0.059 percentage points.
Controlling for socio-economic and demographic variables, household size increased the odds of falling into food insecurity by a factor of 3.27. This may mean that most of the household members are consumers rather than producers which resulted partly by the war. Thus, the larger the household size the more the pressure on the household for the scarce resources available and thus the higher the likelihood of falling into food insecurity. The age of the household head is a significant demographic variable that correlates to food insecurity. The higher the age of the household head the higher the likelihood of the household being food insecure by a factor of 0.229.
Income is believed to be among the factors affecting the food security of the households. A one percentage increase in the mean monthly income of the households increased the probability of being food secure by 0.11. The monthly income is determined by the current employment status of the households. Further, the unemployed heads of households had higher probability (0.296) of being food insecure than the employed counterparts. Access to electricity, financial services, and aid supports (given by the family members, community, NGOs, and the government) also determine the level of food insecurity of the household. The household who had access to functioning electricity services had higher probability (0.409) of being food secured than those who did not have at 1% level of significance. The households who got monetary and in kind support from their families, NGOs, and government had lesser (0.296) probability of falling to food insecurity at 1% level of significance.
Moreover, during the war time, households were using savings to cover their expenses. As a result, access to financial services also affects the level of food security of the households. This study came with a positive relationship between access to financial services (banking service) and the level of food security. The regression result in depicts that households who had access to financial services had 0.078 higher probability of being food secured than those who did not have financial services at their localities due to the war. The war time level of food insecurity is much higher (77.38%) than the before war level of food insecurity (25%). Moreover, the major finding of this research work, inverse relationship between food security and conflict, is consistent with research outputs carried out in other countries (D’Souza & Jolliffe, Citation2013; Pierre & Fred, Citation2006; Slobodanka & Teodosijević, Citation2003).
4. Conclusion and recommendations
4.1. Conclusion
The war in Tigray was a genocidal war and the Ethiopian government used famine as a weapon of war as it made 77.38% of the households to become food insecure. The war also widens the food insecurity gap against the required calorie intake which accounted for 33.68%. The war caused 69.21% of the households to be classified in the crisis phase and above where the share of the catastrophe households was about 44.71%. The war not only increased the number of food insecure households but also enhanced the number of households entering the crisis and above phase; the war-time food insecurity increased by 153.8% and the crisis phase and above acute food insecurity to upsurge by 49.7%.
The food insecurity in the Tigrai region was determined by the recurrent war, the price of basic goods and services, income of the household, age of the head, family size, access to electricity, access to financial services, and unemployment of the head at different levels of significance. Though there was no significance difference between the level of food insecurity based on the livelihood style, rural, urban, and small-town setting, higher percentage of good insecure households were observed in the rural areas followed by small towns and urban areas. Further, the level of food insecurity and phases of food insecurity (crisis phase and above) varied across zones where the Central zone had the highest incidence followed by the Northwest zone and Mekelle zones.
4.2. Recommendations
Following the descriptive and empirical analysis of the effect of war on food insecurity in Tigrai, the researchers recommend the following urgent actions:
Finalizing the war in any form is highly required to reverse the distressing effect of the war on food insecurity in the region as a significant number of the households need urgent humanitarian support and are at severe risk of hunger.
Provide urgent actions to save lives and livelihoods of populations estimated in Emergency (IPC Phase 4) and above, as well as to protect livelihoods and reduce food consumption gaps of the populations estimated in Crisis (IPC Phase 3). A special focus should also be directed toward the households unable to purchase food items due to a lack of employment and alternative sources of income because of the armed-war.
Provide emergency livelihood support, including the provision of agricultural and livestock input support to ensure the major agricultural season does not result in a second lost harvest. Support trade to stimulate economic activity—protection for traders and safe markets, ensure livelihood support for populations not displaced to access their farms and agricultural inputs. As access improves, repair damaged social and economic infrastructure. Ensure fully functional telephone communications, financial services, including banks, markets, and transportation services.
Scale-up the humanitarian food assistance in terms of spatial coverage, population coverage, and ration provided to the people in need of humanitarian assistance. This is imperative to prevent deterioration into Famine (IPC Phase 5) level of acute food insecurity. This includes providing immediate and regular humanitarian food assistance to reduce the food gaps, and prevent acute malnutrition.
Restore and enhance the livelihoods of internally displaced people returnees as well as rehabilitation of vulnerable farming (assets) communities by subsidizing basic commodities and agricultural inputs. Also, diverse, and sustained humanitarian interventions aimed at improving access to food and restoring employment opportunities disrupted by the war-induced acute food insecurity in Tigrai have to be immediately implemented.
Support ongoing initiatives on social cohesion and peace building efforts to reduce the impact of conflicts on food security, nutrition, and livelihoods of affected populations. The conflict-induced displacement has continued damaging the lives and livelihoods of the affected population. The humanitarian community, donors, and partners should continue advocating for and implementing an integrated approach of providing humanitarian assistance, in parallel to increasing the resilience of livelihoods and continuous monitoring of the IDP situation.
Author contributions
Teka Araya has initiated the research topic, and developed the questionnaire and FGD, KII, and PRA discussion points. He has also dealt with model specification and carried out the analysis. Sung-Kyu Lee worked on the organization of the paper, editing, reviewing, and proofreading. Besides, he has checked the appropriateness of the model used and the relevance of the topic for the rehabilitation of Tigrai.
Acknowledgments
The authors would like to thank the Tigrai Institute of Policy studies (TIPS) for providing the data necessary for the study. We are also grateful for those who participated in editing, reviewing, and providing their genuine comments. All views raised in this paper are the opinion of the authors and do not reflect the interest of the TIPS.
Disclosure statement
No potential conflict of interest was reported by the author(s).
Additional information
Notes on contributors
Teka Araya
Teka Araya is an Assistant Lead Researcher at the Tigrai Institute of Policy Studies (TIPS). His research areas include poverty analysis, income distribution, development policy, welfare economics, institutional and social change economics, labor studies, industrial and agricultural productivity, environmental policy studies, regional economic policy analysis, risks and uncertainty, malnutrition, maternal care, and public health among others. The research paper contributes to the existing literature on conflict and food insecurity and points out areas of intervention to improve the households’ level of food security in war-torn areas.

Sung-Kyu Lee
Sung-Kyu Lee is a Professor at the Department of International Trade at Andong National University in Korea. He obtained his PhD degree in Economics from the University of Southampton, U.K. He was a Fiscal Policy Analyst of National Assembly Budget Office in Korea. He has been a chief editor of Review of Institution and Economics published by ‘Korea Institution and Economics Association’ and also a chief editor of Korean Journal of Public Choice Economics issued by ‘Korea Center for Public Choice Study’. He is a Director of ‘Korea Center for Public Choice Study’ and a Director of ‘Mancur Olson Institute’. He is also an Editorial Board member of the Journal of Contemporary Management in Canada. His main research field is public finance, public choice, development economics, and institutional economics. He is the author of Theory of International Trade (in Korean), International Trade and Strategic Trade Policy (in English), Political Economy of Tax Policy and International Taxation (in English), and Essays on Probabilistic Voting, Policy and Campaigning (in English). Recently, he published “The impact of agricultural package programs on farm productivity in Tigray, Ethiopia: Panel data estimation” along with Araya Teka in Cogent Economics & Finance (2019), and “Resurrecting the Industrial Policy as Development Policy based on Korean Experiences: Towards a Pro-market Industrial Policy” with Jwa Sung-Hee in World Economics (2019).
Notes
1 Tabia is lower government’s administrative structure below the Woreda.
2 There were three rounds of wars in Tigray and this study assessed the impact of the first-round war.
3 All woredas in the Western zone are insecure and inaccessible during the data collection. Representative data were collected from the Internally Displaced People (IDP) of the zone who are residing in Shire and Mekelle city and treated as IDP in the analysis.
4 Information is gathered form the Ethiopian defense force and the interim government of Tigray.
5 First-level outcomes refer to ‘characteristics of food consumption and livelihood change. Thresholds that correspond as closely as possible to the Phase description are included for each indicator. Although cut-offs are based on applied research and presented as global reference, correlation between indicators is often somewhat limited and findings need to be contextualized. The area is classified in the most severe Phase that affects at least 20% of the population’ (IPC Global Partner, Citation2019).
6 A logit model is applicable for qualitative binary variables that have two outcomes, i.e. if the household is food secure and
if the household is food insecure.
7 Providing food aid based on the family size and the required quantity of cereals, pulses, and oil.
8 The monetary value of assets damaged in the war was used as a proxy variable to measure conflict.
9 We treated marital status as married and unmarried (dummy). The single, divorced and widowed were considered as unmarried.
References
- Alemayehu, G., Jong, N. d., Kimenyi, M. S., & Mwabu, G. (2005). Determinants of poverty in Kenya: A household level analysis. Working paper 1–16.
- Benoit, E. (1978). Growth and defense in developing countries. Economic Development and Cultural Change, 26(2), 271–280. https://doi.org/10.1086/451015
- Bureau of Plan and Finance. (2018). Socio-economic survey of households in Tigray. Mekelle.
- Center for Preventive Action. (2023). Conflict in Ethiopia. Retrieved January 16, 2024, from https://www.cfr.org/global-conflict-tracker/conflict/conflict-ethiopia
- De Groot, O. J., Bozzoli, C., Alamir, A., & Brück, T. (2022). The global economic burden of violent conflict. Journal of Peace Research, 59(2), 259–276. https://doi.org/10.1177/00223433211046823
- D’Souza, A., & Jolliffe, D. (2013). Conflict, food price shocks, and food insecurity: The experience of Afghan households. Food Policy, 42, 32–47. https://doi.org/10.1016/j.foodpol.2013.06.007
- Ejigayhu, S., & Abdi-Khalil, E. (2013). Determinants of food insecurity in Addis Ababa City, Ethiopia. Africa Association of Agricultural Economists Held from September 22–25 in Hammamet, Tunisia.
- FAO, IFAD, UNICEF, WHO, & WFP. (2017). The state of food security and nutrition in the world 2017. Building resilience for peace and food security. FAO.
- FEWS NET. (2020). Food security in Ethiopia: Emergency (IPC Phase 4) expected in parts of Tigray in 2021.
- FSIN & GNAFC (Global Network Against Food Crises). (2021). Global report on food crises 2021. http://https://www.fsinplatform.org/sites/default/files/resources/files/GRFC2021.pdf
- Gujarati, D. (2007). Basic econometrics. Tata McGraw-Hill.
- Humanitarian Programme Cycle. (2021). Humanitarian needs overview. Syrian Arab Republic. Issued March 2021.
- IPC. (2019). Integrated food security phase classification technical manual version 3.0. Evidence and standards for better food security and nutrition decisions. Rome.
- IPC. (2020). Ethiopia: IPC acute food insecurity analysis October 2020–September 2021, Issued December 2020.
- IPC. (2021). IPC acute food insecurity and acute malnutrition analysis in Somalia in January–June 2021.
- Bruke, J., & Sabbage, D. (2021). Ethiopia-Tigray War: Who is fighting and what has been the toll? The Guardian. Retrieved December 22, 2021, from https://www.theguardian.com/world/2021/nov/05/ethiopia-tigray-war-who-is-fighting-and-what-has-been-the-toll
- Kothari, C. R. (2004). Research methodology: Methods and techniques (2nd ed.). New Age International Publishers.
- Lai, C. C., Shieh, J. Y., & Chang, W. Y. (2002). Endogenous growth and defense expenditures: A new explanation of the Benoit Hypothesis. Defence and Peace Economics, 13(3), 179–186. https://doi.org/10.1080/10242690210975
- Madala, G. S. (1992). Introduction to econometrics (2nd ed.). University of Florida, MacMillan Publishing Company.
- Marc, J. C., & Pinstrup-Andersen, P. (1999). Food security and conflict. Social Research, 66(1), 375–416.
- Ministry of Finance and Economic Development. (2012). Ethiopia’s progress towards eradicating poverty: An interim report on poverty study (2010/11). MoFED.
- Mok, T. Y., Gan1, C., & Sanyal, A. (2007). The determinants of urban household poverty in Malaysia.
- National Planning Commission. (2017). Ethiopia’s progress towards eradicating poverty. An interim report on 2015/16 poverty analysis study.
- OCHA. (2021). Humanitarian needs overview. Syrian Arab republic. https://reliefweb.int/report/syrian-arab-republic/wfp-syria-situation-report-2-february-2021
- Omna Tigray. (2022). Foreign involvement in the war in Tigray. Retrieved March 24, 2022, from https://omnatigray.org/foreign-involvement-in-the-war-on-tigray/
- OXFAM. (2021). Conflicts and disasters-Ethiopia.
- Pierre, W. J., & Fred, H. (2006). Analyzing the effects of conflicts on food security in developing countries: An instrumental variable panel data approach.
- Reno, W. (1998). Warlord politics and the African state. Lynne Rienner Publishers.
- Save the Children International. (2017). Extreme hunger in Yemen. Press release. https://www.savethechildren.net/news/yemen-85000-children-may-have-died-starvation-startwar. Accessed on January 7/2022.
- Sidhua, R. S., Inderpreet, K., & Kamal, V. (2008). Food and nutritional insecurity and its determinants in food surplus areas: The case study of Punjab state. Agricultural Economics Research Review, 21(1), 91–98.
- Slobodanka, B., & Teodosijević. (2003). Armed conflicts and food security. Agricultural and Development Economics Division. The Food and Agriculture Organization of the United Nations. ESA Working Paper No. 03-11. FAO.
- Stijn, V. W. (2018). Food security and armed conflict: A cross-country analysis. FAO Agricultural Development Economics. Working Paper 18–3.
- Teka, A., Gabriel, T., & Zeremariam, F. (2018). Status and determinants of poverty and income inequality in pastoral and agro-pastoral communities: Household-based evidence from Afar Regional State, Ethiopia. Vol. 15. World Development Perspectives.
- Teodosijević, S. (2003). Armed conflicts and food security. Food and Agriculture Organization.
- Tigray Statistics Agency. (2020). Annual macroeconomic report of Tigray regional state–Regional gross domestic product (2008EFY-2011EFY).
- Verwimp, P. (2012). Food security, violent conflict and human development: Causes and consequences. Working Paper 2012–016.
- WFP (World Food Program) & CSA (Central Statistics Authority). (2019). Comprehensive food security and vulnerability analysis in Ethiopia. Addis Ababa, Ethiopia.
- World Bank Institute. (2005). Introduction to poverty analysis. World Bank.
- World Peace Foundation. (2021). Starving Tigray: Mass atrocity and humanitarian emergency in Ethiopia. World Peace Foundation. https://sites.tufts.edu/wpf/starving-tigray/. Accessed on November 5 2021.
Appendices
Figure 1. Food insecurity phase in December 2020 and March 2021.
Source: Computed from the survey, 2021 and USAID, 2020.
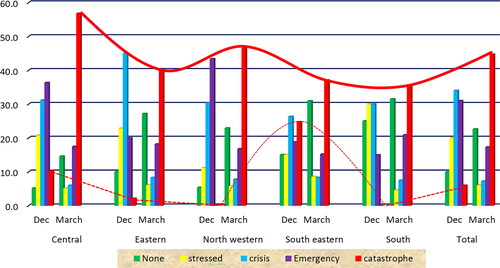
Table A1. Sample size by zone, woreda, and sex.
Table A2. Household features.
Table A3. Level and gap of food insecurity by woreda.
Table A4. Food insecurity phases across woreda.
Table A5. Food security first level outcomes description and indicators of the IPC phases.
Table 1. Intensity, depth, and severity of food insecurity of households by zone and settlement type.
Table 2. Estimates of acute food insecurity at regional and zone levels (IPC phase), 2021.
Table 3. Rural–urban estimates of acute food insecurity (IPC phase), 2021.
Table 4. Determinants of food security.