Abstract
Background. Estimates of cancer patient survival from traditional cohort-based methods may be heavily influenced by the survival experience of patients diagnosed many years ago and may not therefore be relevant to recently diagnosed patients. Period-based analysis provides better predictions of survival for recently diagnosed patients than cohort analysis. The first aim of this study is to provide predictions of the long-term survival of patients diagnosed in 2005–2009 using period analysis and to compare these estimates to the latest available cohort estimates. The second aim is to evaluate predictions published in 2004 regarding the future survival of patients diagnosed 2000–2002. Material and methods. We studied survival among patients diagnosed 1985–2009 reported to the nationwide, population-based Swedish Cancer Registry. Predictions of the future relative survival for recently diagnosed patients were made using period analysis with a window of 2005–2009. Results. The predictions made using period analysis and published in 2004 agreed well with the subsequently observed survival, with common sites showing a better agreement than less common sites. Updated predictions suggest that patients diagnosed today can expect improved survival for many forms of cancer. Conclusions. Period, rather than cohort, survival analysis should be used if the primary aim is to predict the future survival of recently diagnosed patients. Recently diagnosed cancer patients can, for many forms of cancer, expect an improved survival compared to patients diagnosed only a few years earlier.
In 2004 we published predictions of the long-term relative survival for cancer patients diagnosed during the period 2000–2002 [Citation1]. The predictions were made using period analysis and the latest relative survival observed for cohorts with 5-, 10-, 15-, and 20-year survival were provided as comparison. Since five-year follow-up for patients diagnosed in 2002 is now available it is possible to evaluate the extent to which the predictions came true.
The aims of the present study are to provide up-to-date predictions of long-term relative survival for cancer patients diagnosed in Sweden 2005–2009 and to evaluate the predictions for five-year survival made seven years ago. As in the previous analysis, the predictions are made by period analysis and the latest observed relative survival for cohorts with 5-, 10-, 15-, and 20-year survival are provided as a comparison.
Although the majority of the excess mortality due to cancer occurs during the first few years subsequent to diagnosis, excess mortality exists up to 20 years following diagnosis and even longer for some forms of cancer. It is therefore necessary to study both short- and long-term survival in order to gain a comprehensive picture of progress in reducing cancer mortality. Traditional cohort-based estimates of, for example, 10-year survival must out of necessity include patients diagnosed at least 10 years ago. Long-term estimates of patient survival made using cohort-based methods can appear irrelevant to clinicians, their patients, and policy makers alike, since estimates are heavily influenced by patients diagnosed many years in the past who may have been treated with methods now considered obsolete. The time-lag between diagnosis and evaluation of survival can be considerably reduced by applying period survival analysis, which was introduced into cancer survival analysis in 1996 [Citation2]. Period analysis has been shown to provide better predictions of survival for recently diagnosed patients and earlier detection of temporal survival trends than cohort-based analysis [Citation3–5].
Material and methods
The Swedish Cancer Registry
Since 1958 every clinician, pathologist, and cytologist in Sweden is required by law to notify the Swedish Cancer Registry at the National Board of Health and Welfare of each new cancer diagnosed. The non-reporting rate has been estimated at less than 2% based on death certificates for the late 1970s [Citation6] and to 3.7% of the cancer cases reported in 1998 based on a comparison to the Hospital Discharge Register [Citation7]. For most uses in epidemiology the underreporting will be without major impact. However, for specific research questions the underreporting may have implications as the degree of underreporting is site specific, increases with age, and does not seem to be random, as diagnoses without histology or cytology verification are overrepresented [Citation7]. The Swedish Cancer Registry is population-based and covers 9.4 million people today. From its inception the register has accumulated information on 2.3 million tumours for 2.0 million people. The Swedish Cancer registry did not collect information on clinical stage until 2003. For legal reasons pertaining to the regionalised data collection, death certificates cannot be used to register cases either initiated by, or based solely on, death certificate information.
Patients
This study was based on patients aged less than 90 years, diagnosed between 1985 and 2009, and followed up to the end of 2009. A total of 536 223 cancers in males and 499 200 cancers in females were included in the analysis. Ninety-eight percent of the tumours were histologically confirmed and an additional 1.5% were verified by x-ray, computed tomography, nuclear magnetic resonance, etc. Patients diagnosed incidentally at autopsy or without any information regarding follow-up were excluded from the analysis (). The autopsy frequency has dropped from some 40% in the mid-1980s to 12% in 2009 [Citation8]. Only the first primary cancer at each site was included in the analyses. Patients with multiple primary cancers diagnosed at different sites were included as independent entities in the analyses. Patients with a survival time of zero days, but not formally registered as autopsy findings, were included in the analysis. The Cancer Register is linked annually by personal identification numbers to the Cause of Death Register, which is also maintained by the National Board of Health and Welfare, and to the Migration and Population registries at Statistics Sweden, to obtain dates of death or censoring and to confirm continued residency in Sweden. Complete follow-up regarding death and censoring was available for 99.98% of the recorded cases.
Table I. Number of cancers diagnosed 1985–2009 and numbers included/excluded from the analysis. Patients diagnosed incidentally at autopsy or without any information regarding follow-up and patients 90 years or older at diagnosis were excluded from the analysis. Patients with zero survival, but not formally registered as autopsy findings, were included in the analysis.
Forty different forms of cancer were analysed. Some histopathological groups were excluded from the analyses due to low incidence and/or survival probabilities that differ from the predominant pattern for that particular site. For cancer of the small intestine, testis, and brain and nervous system, different histopathological groups within the same site were analysed separately. The analysis does not include basal cell carcinoma as part of the non-melanoma skin-cancer group. In contrast, all benign and malignant tumours of the endocrine glands are registered and were included in the analyses. A majority of all endocrine tumours are histologically benign and the proportion of benign tumours (among all endocrine tumours) has increased over time. Survival is reported separately for males and females for patients less than 90 years of age at diagnosis.
Statistical analysis
We estimated both cumulative and interval-specific relative survival ratios (RSRs) using period-based analysis for the period 2005–2009, and cohort-based analysis for patients diagnosed in 2000–2004, 1995–1999, 1990–1994 and 1985–1989. The latter provide observed RSRs for the latest available corresponding 5-, 10-, 15-, and 20-year cohort-based survival for the period 2005–2009. Patients were followed for 20 years after diagnosis.
Relative survival is defined as the observed survival among the cancer patients divided by the expected survival for a comparable group from the general population with respect to the main factors affecting survival, in this case, sex, age, and calendar year was used. The RSR provides a measure of the excess mortality experienced by patients diagnosed with cancer, irrespective of whether mortality is directly or indirectly related to the cancer in question.
The main analyses were performed with Release 11 of Stata Statistical Software (StataCorp LP, College Station, TX, USA) with the user-written command strs [Citation9], using the Ederer II method [Citation10] and the Brenner option for age standardisation [Citation11]. The survival estimates were age standardised according to the site specific age structure of patients diagnosed during the period 2005–2009. The same weights were used for males and females. The method of age standardisation suggested by Brenner et al. [Citation11] was chosen over the traditional method of age standardisation using grouped data as it enables calculations even when the data are sparse within a particular age group. This method gives an estimate of the conditional net probability of survival for a specific length of follow-up given that the patients had the same age distribution as the standard population at diagnosis (i.e. patients diagnosed 2005–2009).
The evaluation of the predictions published in 2004 was performed with a SAS macro [Citation12–14] that implements the Hakulinen method [Citation15]. This is the same programme and method that was used in the earlier analysis. These estimates were not age standardised as this was not done in the earlier study.
In period survival analysis only person-time at risk and events (death or censoring) occurring during one particular calendar period are considered. The estimates are obtained by left truncation of all observations at the beginning of the period and right censoring at the end of the period. Whereas cohort estimates represent the survival experience of a well-defined cohort of patients diagnosed during a specified calendar period, period estimates do not represent the survival of any actual cohort of patients followed from diagnosis. Period estimates represent the survival that would be observed for a hypothetical cohort of patients who experienced the same interval-specific survival estimates of the patients who were actually at risk during the specified calendar period (in this study 2005–2009). Empirical studies comparing the two methods using historical data show that period estimates from a given time period in most cases predict, quite well, the long-term survival for cohorts of patients diagnosed during that particular period [Citation3–5].
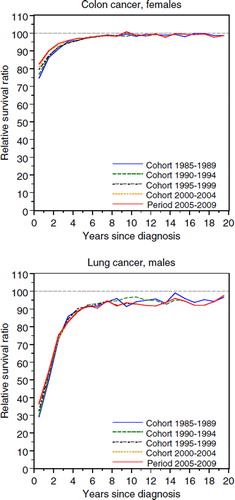
The cumulative RSR can be interpreted as the proportion of patients alive after a given time of follow-up in the hypothetical situation where the cancer in question is the only possible cause of death. An interval-specific RSR of 100% indicates that, during this particular interval (year of follow-up), mortality in the patient group was equivalent to that of the general population. If this level is maintained during subsequent years of follow-up there is no longer evidence of an excess mortality due to cancer and the patients, as a group, can be considered “statistically cured”. The approximate ratio and year of stabilisation was determined by visual inspection of the interval-specific RSRs. As such no formal definition was applied, but in most cases this corresponds to when the RSRs first levels off for three consecutive years. However, for some cancers the interval-specific RSRs continue to increase slightly even after the ratio of stabilisation has been said to occur. For cancers with low incidence and/or survival the reported ratio and year of stabilisation should not be taken too literally, but more be seen as an indication of approximately when the excess mortality stabilises after diagnosis. The interval-specific RSRs for colon cancer among females and lung cancer among males are shown in (sites chosen for illustrational purpose). For colon cancer the ratio and year of stabilisation can quite readily be determined, whereas this is not so straight forward for lung cancer.
Figure 1. Colon cancer among females (upper panel) and lung cancer among males (lower panel). Interval-specific relative survival curves for period and cohort estimates. Patients less than 90 years of age at diagnosis. (sites chosen for illustrational purpose)
Results
Evaluating the cumulative RSRs estimated for the period 2000–2002 against the true cumulative cohort RSRs for patients diagnosed in 2000–2002
Two- and five-year RSRs of the latest available cohort estimates available at the time of the analysis in 2004 (patients diagnosed 1995–1997) and for the period 2000–2002 estimated by period analysis in 2004 are presented in together with the subsequent true RSRs for the cohort of patients diagnosed in 2000–2002. In general, the period analysis predicted the future true survival quite well with more common, larger sites, showing a better agreement than smaller, less common, sites. The absolute mean difference between the true RSRs and the RSRs estimated for the period 2000–2002 are between one percent unit and two percent units lower than compared to the cohort of patients diagnosed in 1995–1997. Comparisons of the five-year RSRs are also presented graphically in .
Figure 2. Five-year cumulative relative survival ratios (RSR) estimated for the latest available cohort-based analysis for patients with five years of follow-up in 2004 (patients diagnosed in 1995–1997) and from the period 2000–2002 in the analysis publicised in 2004 [Citation1] and the subsequent cumulative RSRs later observed for the actual cohort of patients diagnosed in 2000–2002 (data shown in ). Males and females less than 90 years of age at diagnosis. Points on the diagonal line represent perfect agreement between the cohort and period estimates and the subsequent true survival.
![Figure 2. Five-year cumulative relative survival ratios (RSR) estimated for the latest available cohort-based analysis for patients with five years of follow-up in 2004 (patients diagnosed in 1995–1997) and from the period 2000–2002 in the analysis publicised in 2004 [Citation1] and the subsequent cumulative RSRs later observed for the actual cohort of patients diagnosed in 2000–2002 (data shown in Table II). Males and females less than 90 years of age at diagnosis. Points on the diagonal line represent perfect agreement between the cohort and period estimates and the subsequent true survival.](/cms/asset/fbca53ae-e7ef-48cd-8126-8e453a263fff/ionc_a_626444_f0002_b.jpg)
Table II. Cumulative relative survival ratios (RSR) estimated from the period 2000–2002 in the analysis publicised in 2004 [Citation1], the latest available cohort-based estimates for patients with 5-years of follow-up in 2004 (patients diagnosed in 1995–1997), and the true cumulative 5-year RSRs later observed for the cohorts of patients diagnosed in 2000–2002. Males and females less than 90 years of age at diagnosis.
For both males and females the period analysis predicted the 1-year survival within one percent unit for some 60% of the presented cancer sites and some 80% of the predictions were within two percent units (data not shown). Although the censoring applied in the cohort and period analysis is different, we expect good agreement between the two approaches for short follow-up times since the two approaches more or less use the same data. As the time of follow-up increases, the overlap in data used in both the cohort and period analyses decreases, from 67% in the 1-year analysis to 28% for the five-year cumulative estimates (). For males the 2-year RSRs were predicted within one percent unit for 65% of the sites and within two percent units for 83%; the corresponding figures for females were 44% and 72%. The five-year RSRs were predicted within one percent unit for 41% of the sites and within two percent units for 71%, for males, and within 28% and 55%, respectively, for females.
Figure 3. Data included in the five-year survival analysis for the period 2000–2002 published in 2004 [Citation1] (thick dashed line) and the latest available cohort-based analysis for patients with five years of follow-up in 2004 (patients diagnosed in 1995–1997, thin solid line), and data for five-year follow-up for the cohort of patients diagnosed in 2000–2002 (thick solid line). Numbers within cells indicate years of follow-up since diagnosis.
![Figure 3. Data included in the five-year survival analysis for the period 2000–2002 published in 2004 [Citation1] (thick dashed line) and the latest available cohort-based analysis for patients with five years of follow-up in 2004 (patients diagnosed in 1995–1997, thin solid line), and data for five-year follow-up for the cohort of patients diagnosed in 2000–2002 (thick solid line). Numbers within cells indicate years of follow-up since diagnosis.](/cms/asset/7e9a876a-935a-4c26-98e8-0d653e724b09/ionc_a_626444_f0003_b.gif)
For prostate cancer, which is by far the most common cancer among males in Sweden, constituting some 35% of the reported cases annually [Citation16], survival was underestimated by 4.3 percent units with the period analysis, a five-year RSR of 79.5% and 83.8% for the period and the subsequent cohort analysis, respectively. This rather large underestimation, the largest among the more common cancer sites, is most likely attributable to an increase in PSA-testing leading to cancers with less advanced stages being reported to the cancer registry, with an increase in overall prostate cancer patient survival, when stage is not taken into account. Breast cancer, which constitutes some 30% of all female cancer in Sweden [Citation16], was underestimated by 1.1 percent units, a five-year RSR of 87.0% and 88.1% for the period and the subsequent cohort analysis, respectively. As is the case with the unorganised screening for prostate cancer, it is likely that the organised breast cancer screening is leading to cancers with less advanced stages being reported to the cancer registry, with a consequent improved overall survival, when stage is not taken into account. However, since Sweden since the late 1980s, early 1990s, has had a nationwide well-established screening programme for female breast cancer [Citation17] it is likely that the impact of screening detected cancers when comparing period RSRs to the subsequent true cohort estimates is much less regarding breast than it is for prostate cancer.
Predicted RSRs for the period 2005–2009 and the latest corresponding 5-, 10-, 15- and 20-year cohort estimates
Based on a comparison of the period and cohort estimates there is evidence of improvement in relative survival for many forms of cancer during the past two decades ( and ). For some sites survival seems to have stabilised at a relatively high level, whereas other sites show a continued poor long-term survival that has remained essentially unchanged for decades. Females had a better survival than males for most of the major forms of cancer.
Table III. Cumulative and interval-specific relative survival ratios (RSR) estimated for the period 2005–2009 and the observed cumulative RSRs for the last available cohort 5-, 10-, 15-, and 20-year survival. Males less than 90 years of age at diagnosis.
Table IV. Cumulative and interval-specific relative survival ratios (RSR) estimated for the period 2005–2009 and the observed cumulative RSRs for the last available cohort 5-, 10-, 15-, and 20-year survival. Females less than 90 years of age at diagnosis.
The most common cancer sites in Sweden are prostate cancer for males and breast cancer for females, currently constituting some 30–35% of all cancers diagnosed. For these sites the interval-specific RSRs exhibit an unusual pattern (). Excess mortality for most forms of cancer is usually highest immediately following diagnosis and the level generally decreases with increasing follow-up time until the patients reach the point of statistical cure (where they as a group no longer experience excess mortality). This is illustrated for female colon cancer in , upper panel (sites chosen for illustrational purpose). In contrast, prostate and breast cancer patients experienced a constant excess mortality throughout the first 20 years following diagnosis.
Figure 4. Prostate cancer (upper panel) and breast cancer among females (lower panel). Interval-specific relative survival curves for period and cohort estimates. Patients less than 90 years of age at diagnosis.
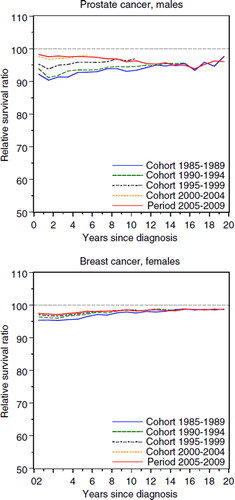
Excess mortality for prostate cancer patients was slightly lower during the first years following diagnosis. The interval-specific RSRs level off at some 96% after approximately 10 years of follow-up for both the period and cohorts analysed. Female breast cancer patients exhibited a similar pattern to that of prostate cancer patients and the interval-specific RSRs level off at some 98% after approximately five years of follow-up.
A comparison of period and cohort estimates suggests that among the more common sites the largest improvements in 10-year survival during the past decade have occurred for cancers of the prostate, kidney, non-Hodgkin lymphoma colon, and rectum for males and kidney, colon, non-Hodgkin lymphoma, and breast for females. The increase in 10-year cumulative RSR was between 3–13 percent units for males and 2–7 percent units for females.
Patients diagnosed with some forms of cancer currently have a very favourable prognosis where only a small excess mortality can be seen for the first few years following diagnosis. For seminoma testicular cancer this has been true for many years whereas non-seminoma testicular cancer for many years had a poor survival compared to seminoma [Citation18]. According to the period estimates the cumulative RSRs are now similar for both forms of testicular cancer with non-seminoma patients having 1.6 percent units lower five year RSR. However, this difference is mostly attributable to a larger excess mortality during the first year of follow-up. Patients diagnosed with neurinoma, a histologically benign tumour in the intracranial nerves of the brain, have had a good survival since the latter part of the1970s [Citation18] and based on the interval-specific RSRs only a survival disadvantage of 1.6 percent units can be seen for recently diagnosed male patients during the first year of follow-up. Virtually no survival disadvantage can be seen for female patients and for both males and females the interval-specific RSRs varies around 100% during the remainder of the follow-up period, mainly slightly above for females and slightly below for males. The increase in cumulative RSR above 100% could in part be due to random variation, but also to the increase in care that is following on a diagnosis of cancer.
There are several cancer sites for which the long-term survival continues to be poor, for example, oesophagus, liver, gall bladder (including biliary tract), pancreas, lung and acute myeloid leukaemia. Fortunately, the estimates also show some short-term survival improvements for these sites as can be seen for lung cancer among males in .
Discussion
Patients diagnosed today with a cancer for which survival is improving can expect to experience a better survival than traditional cohort-based estimates might suggest. This is no surprise, although we believe that if survival statistics are to be used by clinicians it is preferable to present figures which we believe will provide accurate predictions rather than figures we know are potentially inaccurate and expect clinicians to make ad hoc adjustments. Our follow-up of patients diagnosed 2000–2002 showed that the predictions of five-year relative survival we previously made using period analysis were close to the truth, whereas the accompanying cohort estimates, as expected, more often underestimated the true survival.
Improvements in survival may reflect a variety of factors such as increased and/or earlier diagnosis, a shift towards more favourable histopathological subtypes, or improved treatment. Regardless of the origin of the improvements, empirical evaluations based on historical data [Citation3] and the evaluation for up to five-years survival presented in the present study suggest that period analysis provides more accurate predictions of survival of recently diagnosed patients than cohort-based analysis. Most of the excess mortality experienced by cancer patients occurs during the first few years following diagnosis, on which the long-term cumulative survival heavily depend whereas later years of follow-up have a more limited impact on the cumulative estimates. Period estimates of survival during the years directly following diagnosis are based only on patients diagnosed recently, thereby allowing period analysis to respond more rapidly to changes in survival patterns.
Based on an evaluation of our study published in 2004, survival estimates were in this study presented for a period width of five years instead of three years. For both the period and the cohort analysis, combining more years in the analysis will lead to more stable estimates as an increase in the number of patients that enter the analysis at any given time of follow-up reduces the random variation which results in more accurate survival estimates. The drawback of this approach is that the estimates will be less up to date when they are averaged over five years instead of three years since patients diagnosed two years earlier are also included. We believe, however, that this to a large extent outweighs the disadvantage of potentially unstable and inaccurate estimates for the less common cancer sites. For sites with a low incidence the survival estimates might otherwise more reflect the survival of the actual patients diagnosed than that of all individuals that are under risk to acquire that particular diagnosis of cancer in the patients’ catchment area.
Outdated survival estimates can be unnecessarily discouraging to cancer patients and their relatives and may appear irrelevant and of limited use to clinicians and policy makers. Population-based estimates of cancer patient survival are of interest to many different audiences (e.g. patients, clinicians, health administrators, etiological researchers) and there is no single statistical method that is uniformly best for all. Period analysis is preferable to cohort-based analysis if the goal is to predict survival of recently diagnosed patients. Period estimates relate to a synthetic cohort, rather than a well-defined cohort of actual patients, but this is not of concern if our goal is to predict the future rather than to describe the past.
It is also important to consider both short- and long-term survival in order to obtain a complete picture of temporal trends in patient survival. There is otherwise a risk that short-term improvements will be missed if attention is directed solely, as it often is, at long-term survival at fixed intervals, such as 5-, and 10-years. Cancer sites with low and constant long-term survival, e.g. lung, pancreas and liver, should be considered at shorter follow-up intervals than the five years traditionally used. However, for short-term survival it does not matter whether cohort or period analysis is used since, depending on the years included, these estimates will essentially be the same.
Survival estimates from period-based analysis will be artificially prolonged by early detection if the introduction of screening (unorganised or organised programmes) or improvements in methods for early diagnosis introduce a lead-time bias. An example can be seen in this study regarding prostate cancer where PSA-testing has probably caused both lead-time bias and length time bias, i.e. a larger proportion of non-fatal tumours are now reported to the Cancer Registry. Age-standardised incidence of prostate cancer patients aged 50 years or older () increased on average by 5.2% annually between the years 1990–2004 to 663 cancers per 100 000, where it appears to have reached, at least a local, screening peak. The incidence then decreased sharply with 4.5% annually between 2005 and 2008 to 549 cancers per 100 000, but has increased again during 2009 [Citation16,Citation19].
Figure 5. Prostate cancer. Age-standardised incidence per 100 000 for patients age ≥ 50 years at diagnosis, the proportion of patients diagnosed with localised disease with a PSA < 20, age ≤ 75 years and age ≥ 75 years, respectively, and the proportion of patients diagnosed with metastatic disease.
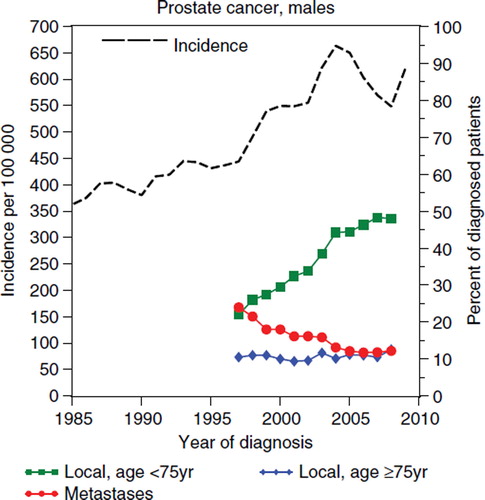
There was a six-fold increase in PSA-testing in Sweden during the 1990s [Citation20,Citation21] and the proportion of localised prostate cancers diagnosed among men below 75 years of age increased from 22% in 1997 [Citation22] to 48% in 2008 [Citation23]. During the same period the proportion of localised tumours diagnosed among men 75 years or older were stable at approximately 10%, the proportion of metastases at diagnosis decreased from 24% to 12%. The mean age at diagnosis decreased from 74 years in 1997 to 69 years in 2009. This is all consistent with what would be expected if an organised screening programme was introduced; a shift towards younger patients and earlier stages.
The period-based estimate for the 10-year cumulative RSR for prostate cancer were 50% for 1997, the year prior to the rapid increase in prostate cancer incidence in the late 1990s [Citation16], 76% for the period 2005–2009, and 79% for 2009. It is likely that this increase is mainly introduced by lead time and suggests that period estimates for recently diagnosed patients will overestimate the 10-year cumulative RSR for clinically detected prostate cancers by nearly 30 percent units, and overestimation of 58%. For PSA-detected cancers the latest period estimate is nevertheless likely to be an underestimate of the true survival. Period estimates of the five-year cumulative RSR for the period 2000–2002 underestimated the true survival for patients diagnosed in 2000–2002 with some four percent units (). The incidence of female breast cancer has increased quite steadily at 1.2% annually between 1990 and 2009, and at 0.8% between 2000 and 2009 [Citation16]. There is some evidence that breast cancer survival are also influenced by lead time and length time bias although not nearly to the same extent as for prostate cancer.
It remains to be seen if the predictions of the future long-term survival reported in this study will hold for patients diagnosed today. It looks promising, based on both previous historical evaluations of period analysis and on the evaluation shown in this article, for survival up to five-years following diagnosis.
Declaration of interest: The authors report no conflicts of interest. The authors alone are responsible for the content and writing of the paper.
References
- Talbäck M, Rosén M, Stenbeck M, Dickman PW. Cancer patient survival in Sweden at the beginning of the third millennium – predictions using period analysis. Cancer Causes Control 2004;15:967–76.
- Brenner H, Gefeller O. An alternative approach to monitoring cancer patient survival. Cancer 1996;78:2004–10.
- Talbäck M, Stenbeck M, Rosén M. Up-to-date long-term survival of cancer patients: An evaluation of period analysis on Swedish Cancer Registry data. Eur J Cancer 2004;40: 1361–72.
- Brenner H, Gefeller O, Hakulinen T. Period analysis for ‘up-to-date’ cancer survival data: Theory, empirical evaluation, computational realisation and applications. Eur J Cancer 2004; 40:326–35.
- Brenner H, Hakulinen T. Up-to-date cancer survival: Period analysis and beyond. Int J Cancer 2009;124:1384–90.
- Mattsson B, Wallgren A. Completeness of the Swedish Cancer Register. Non-notified cancer cases recorded on death certificates in 1978. Acta Radiol Oncol 1984;23:305–13.
- Barlow L, Westergren K, Holmberg L, Talbäck M. The completeness of the Swedish Cancer Register: A sample survey for year 1998. Acta Oncol 2009;48:27–33.
- Dödsorsaker 2009 (In English: Causes of Death 2009). National Board of Health and Welfare, Stockholm, Sweden, 2011.
- Dickman P, Covello E, Hills M. Estimating and modelling relative survival using Stata. [Internet]. Estimating and modelling relative survival using Stata [cited 2011 Sept 12] Available from: http://pauldickman.com/rsmodel/stata_colon/.
- Ederer F, Heise H. Instructions to IBM 650 programmers in processing survival computations. Methodological note No. 10: End Results Evaluation Section. Bethesda MD: National Cancer Institute; 1959.
- Brenner H, Arndt V, Gefeller O, Hakulinen T. An alternative approach to age adjustment of cancer survival rates. Eur J Cancer 2004;40:2317–22.
- Brenner H, Gefeller O, Hakulinen T, Arndt V. Period and periodh: Period analysis of survival date. IMBE Statistical Software Archive Network: University of Erlangen, Nürnberg. Available from: http://www.imbe.med.uni-erlangen.de/cms/software_period.html.
- Brenner H, Hakulinen T, Gefeller O. Computational realization of period analysis for monitoring cancer patient survival. Epidemiology 2002;13:611–2.
- Arndt V, Talbäck M, Gefeller O, Hakulinen T, Brenner H. Modification of SAS macros for a more efficient analysis of relative survival rates. Eur J Cancer 2004;40:778–9.
- Hakulinen T. Cancer survival corrected for heterogeneity in patient withdrawal. Biometrics 1982;38:933–42.
- Cancer Incidence in Sweden 2009. National Board of Health and Welfare, Stockholm, Sweden, 2010.
- Socialstyrelsens cancerrapport till regeringen – Lägesrapport (In English: The National Board of Health and Welfare’s Cancer repport to the Government – Progress report). National Board of Health and Welfare, Stockholm, Sweden, 2006.
- Talbäck M, Stenbeck M, Rosén M, Barlow L, Glimelius B. Cancer survival in Sweden 1960–1998 – developments across four decades. Acta Oncol 2003;42:637–59.
- Statistical database [Internet database]. National Board of Health and Welfare, Stockholm, Sweden, 2011. http://www.socialstyrelsen.se/statistik/statistikdatabas
- Adolfsson J, Marké Å. Use of PSA tests in Sweden. Scand J Urol Nephrol 2002;36(Suppl 211):7–8.
- Johansson J-E, Abrahamsson P-A, Adami H-O, . Massundersökning för prostatacancer (In English: Mass screening for prostate cancer). Swedish Council on Technology Assessment in Health Care (SBU), Stockholm, Sweden, 1995.
- Prostatacancer Primär registrering 1997–2001 (In English: Primary registration of prostate cancer 1997–2001). Regional Onkologic Center, University Hospital, Uppsala, Sweden, 2003.
- The National Prostate Cancer Register (NPCR) in Sweden 2004–2008. Regional Onkologic Center, University Hospital, Uppsala, Sweden, 2010.