
ABSTRACT
The School Librarian Investigation—Decline or Evolution? (SLIDE) project is a federally funded study of the almost 20% national decline in the number of full-time equivalents (FTEs) of school librarians between 2015 and 2019, according to the National Center for Education Statistics. In this update to the project’s original research, school librarian employment data for the 2020-2021 school year were examined for 12,537 school districts and associated with district characteristics (poverty, locale, and district enrollment) and student demographics (race and ethnicity). Data supported previous findings that access to school librarians is strongly related to race and ethnicity and further exacerbated for students living in extreme poverty, in more-isolated locales, and in the smallest districts—locales where students are less likely to have access to the educational resources available in large urban areas. In school year 2021, 3 million students in majority nonwhite districts were without any librarians; they were 54% of the 5.6 million students in all districts without any librarians during the COVID-19 pandemic. The gap between students in districts with a “library privilege” and those without librarians continues to widen.
Today’s school librarians do far more than manage collections of books and encourage a love of reading. They teach students information literacyFootnote1 and the technology skills essential to success in school, college, and workplace; they guide students in developing inquiry-based learning skills equally critical to lifelong success; and they collaborate with classroom teachers in aligning available information resources—whether physical or digital—with curriculum. Students and teachers who have access to school librarians, therefore, have a decided advantage over those who do not—a library privilege. That makes access to school librarians an educational equity issue.
A recent analysis of federal data provided by the National Center for Education Statistics (NCES) in the Common Core of Data (CCD) on school librarian employment reveals extreme inequities in access to school librarians for preK–12 public school students in the United States in relation to race and ethnicity. This article takes a deeper look at the relationship between race and ethnicity and district characteristics, including enrollment, district setting or locale, and poverty as determined by eligibility for the National School Lunch Program. For purposes of this analysis, majority nonwhite districts were compared with majority white ones, and majority Hispanic districts, with majority non-Hispanic ones.
Since the CCD includes annually collected data from all U.S. public school districts, this analysis found that inequities in access to school librarians based on race and ethnicity were often exacerbated—considerably in many cases—by student poverty levels, the locale of the district in relationship to its nearest metropolitan area, and the size of the district’s preK–12 student enrollment. Notably, staffing of librarians was comparably lacking in majority Hispanic and nonwhite districts at the highest poverty levels, particularly if those districts were also located in rural areas and had smaller enrollments.
The SLIDE project
The decades-long decline in school librarian positions and the limited data on this phenomenon motivated Kachel and Lance to propose the 2023 project named SLIDE: The School Librarian Investigation—Decline or Evolution? Their proposal, submitted through Antioch University Seattle, was funded by the Institute of Museum and Library Services (IMLS) through the Laura Bush 21st Century Librarian grant program as a Research in Service to Practice project. This mixed methods study examined national, state, and local district data to assess the inequities in librarian access for K–12 students in public schools and to learn how and why school decision-makers chose staffing patterns to deliver library, information services, and instructional technology to their schools. Overall, the SLIDE project includes (a) an analysis of NCES’s school librarian employment data at national, state, and district levels; (b) an analysis of a state survey providing the context of school librarian employment; and (c) interviews of school decision-makers that also will include an examination of job descriptions indicating the shifting or blending of the role and duties of a school librarian. This paper focuses specifically on an analysis of the quantitative employment data findings from CCD, as the interview phase of the SLIDE Project is ongoing
Literature review
While the impact of certified school librarians on student achievement is well documented, (Farmer & Phamle, Citation2021; Gretes, Citation2013; Lance & Kachel, Citation2018; Scholastic, Citation2016), this research remains largely unrecognized outside of school library circles, particularly among decision-makers and key education stakeholders (Shannon, Citation2016, p. 28). As a result, school librarians find themselves to be the primary advocates for the instructional role they play in a learning community (Church, Citation2008; McGhee & Jansen, Citation2006). When librarian positions are cut, there are often no local voices to lead advocacy efforts to maintain school librarians for students. The SLIDE findings support this fact: that when librarian positions were cut, only one out of 10 were reinstated over the 5-year span of time studied (Lance & Kachel, Citation2021, p. 73).
It is also well documented that support from administration is key to the school library’s success (Morris & Packard, Citation2007; Shannon, Citation2012), yet school principals typically receive little formal education on the roles and benefits of a school librarian (Kaplan, Citation2006; Shannon, Citation2009). Many administrators tend to perceive “traditional competencies,” such as the circulation of library materials, as the primary role of the school librarian rather than the many instructional, innovative, and impactful practices upheld by the profession as articulated in the American Association of School Librarians’ National School Library Standards (Shannon, Citation2016, p. 40). However, when administrators do understand the positive impact of a school librarian, they tend to hinge that success on the personality and interpersonal skills of the school librarian, rather than on factors within the administration’s control, such as the fostering of a collaborative school culture, promoting library services, and allowing the librarian to take on leadership roles within the learning community (Kaplan, Citation2006; Roys & Brown, Citation2004). Misunderstanding and lack of support for librarians collaborating and teaching with other educators unwittingly has reduced the librarian’s effectiveness as an essential educator and instructional partner (Kaplan, Citation2006). Thus, in times of budget cuts, the perception that librarians are “nice to have” but nonessential—performing mostly clerical work—results in position cuts or reductions (Luhtala, Citation2012; Merga, Citation2019).
In recent years, particularly during the COVID pandemic that began in early 2020, many school librarians have been assigned or reassigned to other job responsibilities or positions (Kachel & Lance, Citation2018; Lance & Kachel, Citation2022). These evolving roles vary from district to district and may include testing coordination, textbook and computing-device distribution, substitute teaching, and tech support for online learning, sometimes outside the school day. All of these assigned tasks remove librarians from their most impactful roles as instructional partners and teachers. The research tells us that to have the greatest impact on student achievement, librarians should be allotted the time, support, and opportunity to collaborate with classroom teachers to teach information literacy instruction across the curriculum; to foster a love of reading; to teach critical digital citizenship and media literacy skills; and to foster a warm, welcoming, and inclusive hub of learning for the entire school community (American Association of School Librarians [AASL], Citation2020).
With few exceptions, job loss in the field of school librarianship has largely worsened in recent decades (Franklin, Citation2018; Guarria & Wang, Citation2011; Kachel & Lance, Citation2018). These findings about school-librarian employment were first reported in detail in Perspectives on School Librarian Employment in the U.S., 2009–10 to 2018-19, a 2021 SLIDE report. While previous school library impact studies have linked library characteristics to student success (Gretes, Citation2013; Kachel, Citation2013) and found that students living in poverty were less likely to have access to a full-time school librarian and a well-resourced school library (Levin, Citation2019; Long, Citation2016; Pribesh et al., Citation2011; Traska, Citation2013), this study is the first of its kind to explore trends in school-library staffing decisions. The early phases of SLIDE revealed a connection between school-librarian losses and race, ethnicity, poverty, locale, and enrollment, positing that access to a qualified school librarian is an educational equity issue. During the interview phase of SLIDE, now ongoing, researchers will seek to understand whether the responsibilities of “the traditional school librarian” are being delegated elsewhere, or evolving or combining with other educator roles and take on a different model entirely (Kachel & Lance, Citation2018; Lewis, Citation2016).
Methodology
Annually, public school districts are required to submit staffing and other information to their states to forward to NCES to be incorporated into its Common Core of Data (CCD). These data have been collected since the 1980s; thus, definitions have not changed or been updated for various educator positions. The definition of school librarian is particularly dated.Footnote2 Notably, like CCD definitions for all educator positions, this definition ignores the issue of state certification, which is an essential element to the school librarian profession. As a result of this outdated definition and absence of certification requirements, there are inconsistencies across states and districts regarding who to report as a school librarian. For this article, 12,537 local districts were analyzed for school year 2020-2021—the most recent year of data available at that time. These data represent 47 states and the District of Columbia. Data for New York were excluded due to severe and insoluble data-quality problems at the district level, and the states of Illinois and Utah excluded themselves by not reporting data for any of their districts.
CCD collects data on school employment in full-time equivalents (FTEs), not head counts, per district, but does indicate the number of schools per district. Therefore, in the absence of specific school-level data, a district ratio of librarian FTE per school was utilized to approximate school-level data.Footnote3 For this article, the primary analysis of librarian staffing focuses on two distinct levels: districts with enough full-time librarians for every school (.75 or more librarian FTE per school)Footnote4 and districts with no librarians.
Racial and ethnic inequities
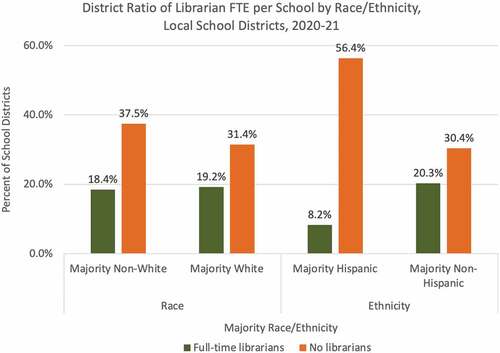
In 2021, there were noteworthy differences in access to librarians based on race (majority nonwhite versus majority white districts) and ethnicity (majority Hispanic versus majority non-Hispanic districts). Districts classified as majority nonwhite were those in which 50% or more of students were categorized as something other than white (e.g., American Indian/Alaskan Native, Asian American, Black/African American, Hawaiian Native or Pacific Islander, Hispanic, two or more races). Majority Hispanic districts were those in which 50% or more of students identified as Hispanic according to NCES’s definition.Footnote5
In 2021, almost twice as many majority Hispanic districts reported no librarians (56.4%) compared to majority non-Hispanic districts (30.4%). Conversely, only 8.2% majority Hispanic districts reported a full-time librarian in every school compared to 20.3% of majority non-Hispanic districts.
Differences associated with race were less extreme than those associated with ethnicity, though still noteworthy. In 2021, 37.5% of majority nonwhite districts reported no librarians compared with 31.4% of majority white districts. Surprisingly, the percentages of majority nonwhite and white districts with full-time librarians in every school were almost equally low at 18.4% and 19.2%, respectively (See ).
.
Poverty and racial–ethnic inequities
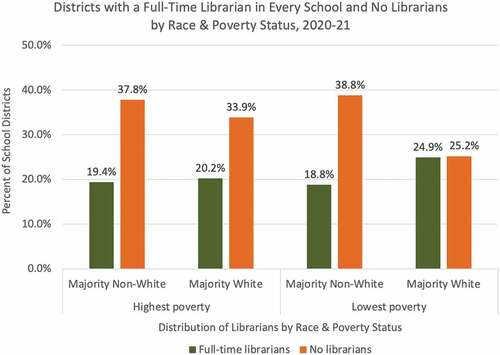
A district’s poverty status can mitigate or exacerbate the relationship between race and lack of access to school librarians. Poverty status is measured in terms of the percentage of students in a district eligible for free or reduced-price meals under the National School Lunch Program (NSLP; U.S. Dept. of Agriculture, Citation2017). For purposes of this analysis, districts categorized as “highest poverty” had 75% or more of their students eligible for NSLP; “lowest poverty,” if fewer than 30% were eligible (See ).
.
With regard to poverty, results of these analyses found:
Lowest poverty, majority nonwhite districts were more likely to be without librarians (38.8%) than lowest poverty, majority white ones (25.2%).
Highest poverty, majority nonwhite districts were also more likely to be without librarians (37.8%) than highest poverty, majority white ones (33.9%). Notably, however, the gap between majority nonwhite and majority white districts is far less for the highest poverty districts than for lowest poverty ones.
Among the lowest poverty, majority white districts, a quarter (24.9%) of districts had full-time librarians in every school and a quarter (25.2%) had no librarians. By contrast, in majority nonwhite districts, fewer than one out of five in the lowest poverty districts (18.8%) had full-time librarians in every school and about two out of five (38.8%) of those districts had no librarians. Thus, majority nonwhite districts were equally likely to lack librarians, whether they were among the highest poverty or the lowest poverty districts. This indicates that, while poverty was a powerful factor associated with inequities in librarian access, ultimately, when poverty was ruled out as an explanation for inequities, substantial differences remained that were associated with race alone.
These findings indicate that poverty status is more likely to explain the total absence of librarians in a district than having enough librarians for every school. However, for highest poverty districts, majority nonwhite districts are more likely to be without any librarians than majority white ones.
By contrast, when examining ethnicity and poverty, a district’s poverty status exacerbated the librarian access gap between majority Hispanic and non-Hispanic districts at both the highest and lowest poverty levels (See ).
.
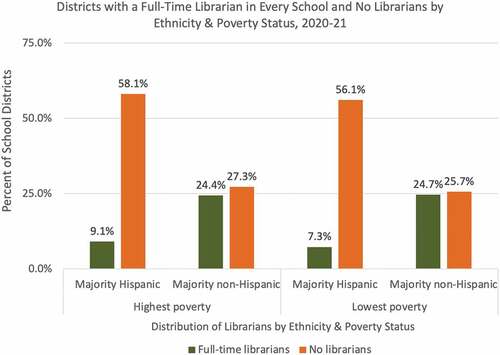
Among highest poverty districts, majority non-Hispanic districts were almost three times as likely to have a librarian as Hispanic districts (24.4% versus 9.1%, respectively).
Among the highest poverty districts, majority Hispanic ones were more than twice as likely (58.1%) to have no librarians as majority non-Hispanic ones (27.3%).
Among lowest poverty districts, non-Hispanic ones (25.7%) were more than three times as likely to have librarians as majority Hispanic ones (7.3%).
Among lowest-poverty districts, majority Hispanic ones were twice as likely (56.1%) to have no librarians as majority non-Hispanic ones (25.7%).
These findings indicate that, even when poverty status is taken into account, there are still substantial differences in access to librarians between majority Hispanic and non-Hispanic districts. Poverty levels alone, therefore, do not explain librarian-staffing differences between majority Hispanic and non-Hispanic districts. Inequities persist between majority Hispanic and non-Hispanic districts regardless of a district’s poverty status.
Locale and racial and ethnic inequities in librarian access
The National Center for Education Statistics (NCES) categorizes local school districts by locale as follows:
City: territory inside an urbanized area and a principal city; large cities having population of 250,000 or more; midsize cities having population greater than or equal to 100,000, but less than 250,000; and small cities having population less than 100,000.
Suburb: territory inside an urbanized area but outside a principal city; large suburbs being associated with large cities, midsize suburbs with midsize cities, and small suburbs with small cities.
Town: territory inside an urban cluster; fringe towns being less than or equal to 10 miles from an urbanized area; distant towns being more than 10 miles and less than or equal to 35 miles from an urbanized area; and remote towns being more than 35 miles from an urbanized area.
Rural area: territory defined as rural by the U.S. Census Bureau; fringe rural areas being less than or equal to 5 miles from an urbanized area and less than or equal to 2.5 miles from an urban cluster; distant rural areas being more than 5 miles but less than or equal to 25 miles from an urbanized area or more than 2.5 miles and less than or equal to 10 miles from an urban cluster; and remote rural areas being more than 25 miles from an urbanized area and more than 10 miles from an urban cluster (NCES, CCD, Citationn.d.a).
A district’s locale strongly influences the relationship between the racial diversity of its students and their access to school librarians (See ).
.
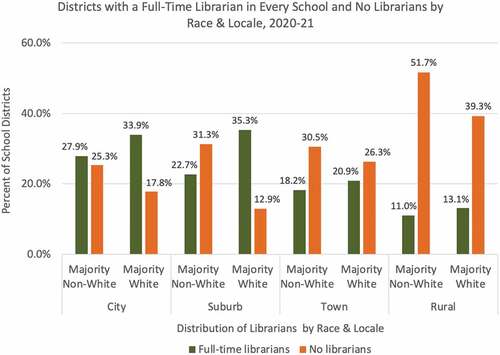
Majority nonwhite districts in cities, suburbs, and rural areas were less likely than similarly located majority white districts to have full-time librarians in every school and more likely to have no librarians. (See Figure 4 for percentages on these two statistics by locale type.)
Almost two-fifths (39.3%) of rural majority white districts were entirely without librarians —the highest percentage for majority white districts of any locale type.
By contrast, rural majority nonwhite districts were most disadvantaged overall by the fact that over half of them (51.7%) had no librarians at all.
These findings indicate that racial differences in access to librarians at both extremes—where districts had enough librarians for every school or had no librarians—were exacerbated by every district locale type except towns.
Differences in access to school librarians based on ethnicity were far more dramatic. (See ).
.
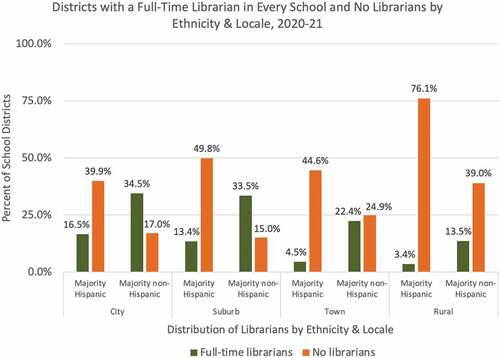
In towns, majority non-Hispanic districts were five times more likely than majority Hispanic ones to have a librarian for every school (22.4% and 4.5%, respectively).
In rural areas, majority non-Hispanic districts were four times more likely than majority Hispanic districts to have a librarian in every school (13.5% and 3.4%, respectively).
In suburbs and cities, majority non-Hispanic districts were twice as likely as majority Hispanic ones to have a librarian in every school (33.5% and 13.4%, respectively, for suburbs; 34.5% and 16.5%, respectively, for cities).
Conversely, in suburbs, majority Hispanic districts were more than three times as likely as majority non-Hispanic ones to have no librarians (49.8% and 15.0%, respectively).
And majority Hispanic districts in cities, outlying towns, and rural areas were about twice as likely as majority non-Hispanic districts to have no librarians (39.9% and 17.0%, respectively, for cities; 44.6% and 24.9%, respectively, for towns; and 76.1% and 39.0%, respectively, for rural areas).
These findings indicate that district locale increases librarian access gaps for all locale types, with the most librarian-deprived districts being majority Hispanic ones in rural areas.
Enrollment and racial and ethnic inequities
The size of a district’s enrollment influences the relationship between its student racial diversity and the availability of school librarians, mitigating it in some cases but exacerbating it in others (See ).Footnote6
.
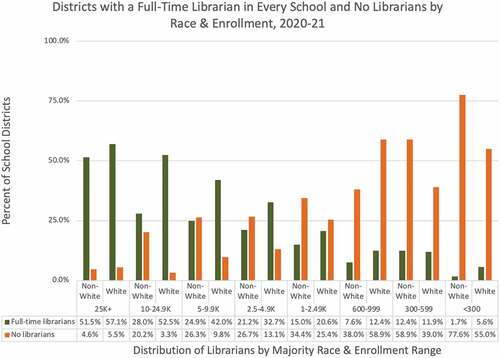
At every enrollment level, majority nonwhite districts were less likely to have full-time librarians (.75+ FTE per school) for every school and more likely to have no librarians. The lone exception was districts serving 300 to 599 students where comparable percentages of majority nonwhite and majority white districts (11.9% and 12.4%, respectively) had full-time librarians in every school.
For enrollment ranges above 2,500 students, however, gaps between majority nonwhite and majority white districts were greater—two to three times as many majority nonwhite as majority white districts had no librarians. Among districts with 25,000 or more students, the percentage of majority nonwhite districts without librarians was comparable to the percentage for majority white districts (4.6% and 5.5%, respectively). And among districts with 10,000 to 24,999 students, 20.2% of majority nonwhite districts lacked any librarians, compared to only 3.3% of majority white districts.
For smaller enrollment ranges, the percentage gap between majority nonwhite and majority white districts was proportionally less but still well into double digits. Among districts with fewer than 300 students, 77.6% of majority nonwhite districts had no librarians, compared to 55.0% for majority white ones. And among districts with 300 to 599 students, 58.9% of majority nonwhite districts lacked librarians, compared to 39.0% of majority white ones.
Overall, these findings indicate that, at both extremes of enrollment, enrollment size exacerbates racial inequalities. In larger districts, where the overall likelihood of having no librarians was relatively low, the proportional differences between majority nonwhite and white districts were greater than for smaller districts. Conversely, though, in smaller districts, where the overall probability of having no librarians was relatively high, the percentage differences between majority nonwhite and white districts were into double digits.
In examining ethnicity for different district enrollment ranges, enrollment had mixed impact on differences in librarian staffing between majority Hispanic and non-Hispanic districts. While districts with smaller enrollments were less likely to have a librarian for every school and more likely to have no librarians at all, majority Hispanic districts were dramatically more disadvantaged than majority non-Hispanic ones at all enrollment levels (See ).
.
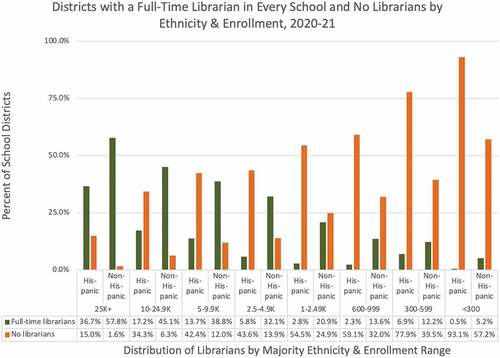
At best, regardless of enrollment levels, majority Hispanic districts were half as likely as majority non-Hispanic ones to have a full-time librarian for every school. Among districts serving 10,000 to 24,999 students, only 17.2% of majority Hispanic districts had a librarian for every school, compared with 45.1% for majority non-Hispanic ones. And among districts serving fewer than 300 students, 0.5% of majority Hispanic districts had a librarian for every school, compared with 5.2% of majority non-Hispanic ones.
For some enrollment ranges, however, the proportional gaps in the presence of a librarian in every school were even larger. Majority Hispanic districts were dramatically less likely than majority non-Hispanic ones to have a librarian in every school, if they served 300 to 599 (6.9% and 12.2%, respectively), 1,000 to 2,499 (2.8% and 20.9%, respectively), and 2,500 to 4,999 students (5.8% and 32.1%, respectively).
For districts serving 2,500 or more students, majority Hispanic districts were about four times more likely than majority non-Hispanic ones to have no librarians. For the largest districts—those with 25,000 or more students—15.0% of majority Hispanic districts lacked librarians, compared to only 1.6% for majority non-Hispanic ones.
For districts serving 300 to 2,499 students, majority Hispanic districts were about twice as likely as majority non-Hispanic ones to be without librarians. For districts serving 300 to 599 students, 77.9% of majority Hispanic districts had no librarians, compared with 39.5% of majority non-Hispanic ones.
In any event, enrollment size did not explain away librarian staffing differences between majority Hispanic and non-Hispanic districts. Instead, inequities worsened as district enrollment decreased.
Summary
Districts employ school librarians to help students develop a habit of reading and to teach them invaluable lifelong information-literacy skills. Concerningly, having a school librarian is becoming a privilege reserved for some students. Access to school librarians is strongly related to both race and ethnicity and either persists or is exacerbated when selected district characteristics—specifically poverty, locale, and enrollment—are considered. And certainly, the COVID-19 pandemic has diminished access to school librarians (Lance & Kachel, Citation2022).
While inequitable access to school librarians was dramatic enough looking at the nation as a whole and at differences between regions and states (Lance & Kachel, Citation2021), inequities associated with race and ethnicity were exacerbated considerably for students living in extreme poverty, in more-isolated locales, and in the smallest districts.
In 2021, majority Hispanic districts were less likely to have librarians if they were at the highest poverty level, located in rural areas, or had lower enrollments. Similar patterns existed for majority nonwhite districts. They were less likely to have librarians if they were at the highest poverty level, located in rural areas, or had smaller enrollments.
In 2020-2021—excluding the states of New York, Illinois, and Utah—almost 3 million students in majority nonwhite districts were without any librarians. That is 54%, more than half, of the students in all districts without any librarians during this critical period during the COVID-19 pandemic, when students were in greatest need of information literacy and research skills as they pursued school work often in isolation and/or from remote sites. The same year, majority Hispanic districts with no librarians served almost 2.1 million students. That was 37%, almost two out of five, of the students in all districts without librarians.
When compared with data from previous years—particularly recent prepandemic years—almost all of these inequities dramatically worsened. It remains to be seen whether levels will return to prepandemic levels (Lance & Kachel, Citation2022).
The SLIDE project is perhaps the most comprehensive examination to date of the employment of school librarians in the United States and ofhow the distribution of school librarians is influenced by student demographics and certain district characteristics. Privilege “exists when one group has something of value that is denied to others simply because of the groups they belong to, rather than because of anything, they have done or failed to do” (University of Central Arkansas, Citation2017). The lack of school librarians for preK–12 school students, teachers and their schools is becoming a growing issue of social justice and educational equity. This issue of “school librarian privilege” requires further examination and action to ameliorate arbitrary inequities.
Future SLIDE research
To date, no study has thoroughly examined the extent to which the traditional role of school librarian is evolving or being eliminated or the thinking behind such developments. Over the past decade, data reported to the National Center for Education Statistics (NCES) via the annual Common Core of Data (CCD) project documented an almost 20% national decline in the number of school librarians. The CCD data were used by the SLIDE project to identify districts that had gained, reduced, or eliminated school librarian positions since school year 2015-2016. From these initially identified sites, school district decision-makers—school administrators and school board members—who made staffing decisions regarding library, learning resources, and instructional technology positions were sought for confidential interviews. The next step in this study is to complete up to 100 interviews of staffing decision-makers by 2023. SLIDE researchers hope to learn what these decision-makers value and prioritize when they make decisions that impact school librarian employment, how and why school leaders choose among related staffing options, and whether library positions are being given new titles, merging with other positions, or morphing into entirely new positions—anything that might explain, even in part, the reported 20% loss of librarian positions.
Other components of the SLIDE project include a survey of state supports that may impact librarian staffing, such as state staffing mandates and the number of higher education institutions that prepare school librarians (Kachel & Lance, Contexts, Citation2021b), and a content analysis of job descriptions and position announcements from districts where interviews occur.
SIDEBAR – WEBSITE and SLIDE data tools
The SLIDE project has generated multiple reports, articles, news items, and infographics that provide national-, state-, and district-level perspectives on the broader issue of educational equity. (See the Additional Annotated Resources for publications.) An outcome of the SLIDE project is to create, maintain, and make available interactive web-based tools (https://libslide.org/data-tools/) that enable users to generate customized tables, charts, and maps of data they select. Using these tools and publications, school leaders will be able to gather evidence to make data-informed staffing decisions to improve equity of access to information and technology to their students. The tools utilize NCES data from over 13,000 U.S. public school districts from 2015–2016 to 2021–2021, with some data going back to 2009–2010. Users can customize their own searches, view maps comparing data, and download spreadsheets of selected data as follows.
Custom search
Select and examine district- or state-level data concerning employment of school librarians and other educators and administrators, in association with district characteristics (expenditures, locale, and enrollment) and student demographics (race, ethnicity, poverty).
District comparison
Compare library staffing for a selected district compared with peer districts. Peer selection options include enrollment, locale, per-pupil expenditures, number of schools, ELL students, majority nonwhite, majority Hispanic, and poverty.
District profile
View library staffing and other data for a single school district. This profile is available as a web page and as a downloadable PDF file. Also included are links to selected SLIDE reports and other relevant research.
State profile
Examine library staffing data for a single state over time and compare those trends with other educator positions inclusive of maps and line charts.
State survey
View data collected during a fall 2020 survey of all 50 states and DC utilized to create the Contexts of School Librarian Employment report (Kachel & Lance, Citation2021a, Citation2021b). The survey gathered state-specific information to provide context to the employment of school librarians. Information included state certification and employment requirements and the number of higher education institutions that prepare school librarians.
Additional annotated resources
Kachel, D. E., & Lance, K.C. (2021, January 26). Appendix to contexts of school librarian employment. SLIDE: The School Librarian Investigation – Decline or Evolution? https://libslide.org/pubs/contextsappendix.pdf
This document is the Survey Monkey report of individual state responses collected for the Contexts of school librarian employment report.
Kachel, D. E., & Lance, K.C. (2021, January 26). Contexts of school librarian employment. SLIDE: The School Librarian Investigation – Decline or Evolution?
This report summarizes responses of school library leaders or state library agencies in all 50 states and the District of Columbia to determine state support of school library programs. Questions address school library standards and guidelines, certification and staffing requirements, direct library funding and provision of statewide e-resources, and the number of higher education institutions that prepare school librarians. https://libslide.org/publications/perspectives/
Kachel, D. E., & Lance, K.C. (2021, January 27). Requirements for School Librarian Employment: A State-by-State Summary. SLIDE: The School Librarian Investigation – Decline or Evolution? https://libslide.org/pubs/requirements.pdf
This report summarizes legal requirements for school librarian staffing in the 50 states and D.C. updated to March 2021.
Lance, K. C., & Kachel, D. E. (2021, July). Perspectives on school librarian employment in the United States, 2009–10 to 2018-19. SLIDE: The School Librarian Investigation – Decline or Evolution? https://libslide.org/publications/perspectives.
This major SLIDE report provides a detailed, in-depth analysis of federal data about school librarians, library support staff, and others, examined from national, state, and district perspectives. NCES data on the employment status of school librarians from 2009-2010 through 2018-2019 for over 13,000 local school districts in the U.S. and D.C. were examined. The findings document an almost 20% loss of school librarians between 2010 and 2019. Further analysis uncovered gross inequities in access to school librarians in districts with more students living in poverty, more minority students, and more English language learners which were less likely to have librarians than districts with fewer such students. During the decade studied, employment for other types of educators increased – sometimes dramatically – while librarian employment alone declined steadily. Also, districts with the most librarians relative to schools were those that spent the most, and the least, per pupil, suggesting that school funding is not always the reason librarian positions are eliminated. Stronger librarian staffing was also found in states that had staffing mandates, whether they were enforced or not, and in states that had more institutions of higher education preparing school librarians. These findings provide solid evidence of inequities nationally, by state, and based on characteristics of local districts and their student demographics.
Lance, K. C., & Kachel, D. E. (2022). Pandemic accelerates school librarian losses and exacerbates pre-existing inequities: A SLIDE special report. SLIDE: The School Librarian Investigation – Decline or Evolution? https://libslide.org/publications/pandemic.
NCES data were examined for the 2020-2021 school year – the first full school year after districts implemented strategies to address the pandemic – to determine the impact of the pandemic on school librarian staffing. Staffing in relation to previously examined district characteristics and student demographics reported in SLIDE’s major report, Perspectives, were also examined. Findings indicated that there are now fewer school librarians than ever. The inequities of access to school librarians for students in selected states, in city and suburban districts that have the most librarians to lose, in “majority-minority” districts, and in poorer districts are more extreme than ever. In addition, inequities grew between majority Black/African-American districts and other districts. While Majority Hispanic districts showed significant losses in Perspectives, the 2020-2021 data showed little change probably because they have fewer librarians to lose that non-Hispanic districts. While both gains and losses were evident in districts across the nation, the losses exceeded the gains within various categories of districts.
Lance, K. C., & Kachel, D. E. (2023). The Status of school librarian employment at school level: Data from the National Teacher and Principal Surveys, 2015–16 and 2019-20. [Working title]: A SLIDE special report. SLIDE: The School Librarian Investigation – Decline or Evolution? https://libslide.org/publications/ Forthcoming
In summer 2022, NCES released data from the 2020-2021 National Teacher and Principal Survey (NTPS), a nationwide sample survey of teachers and principals. This survey will enable analysis of school librarian staffing at the school building level as opposed to district level data used in the SLIDE Perspectives report (Lance & Kachel, 2021). Further, these data will examine school librarian employment based on the racial/ethnic composition of individual school enrollment. This will provide a more granular level on racial/ethnic inequities in access to school librarians experienced by students of color.
Lance, K. C., & Kachel, D. E. (2023). Voices of decision-makers about employment of school librarians and other learning resources staff [Working title]. SLIDE: The School Librarian Investigation – Decline or Evolution? https://libslide.org/publications/voices Forthcoming
This report will share the decision-making processes of potentially 100 school administrators who made staffing decisions related to libraries, information resources, and technology between 2015–16 and 2021–22. Districts qualify where school librarian positions were added, some positions reduced, or all eliminated. This report will reveal staffing priorities and choices and potentially how the position of the school librarian is morphing with other educator roles to meet district goals. Confidential interviews were conducted over 2022 and continue into 2023 by trained project interviewers.
Disclosure statement
No potential conflict of interest was reported by the authors.
Correction Statement
This article has been corrected with minor changes. These changes do not impact the academic content of the article.
Additional information
Notes on contributors
Keith Curry Lance
Keith Curry Lance, Ph.D., Principal Investigator, RSL Research Group, is best known for two decades of state-level impact studies of school libraries and librarians on standards-based test scores. He was the founding Director of the Library Research Service at the Colorado State Library and was a featured speaker at the White House Conference on School Libraries in 2002. He received the 2013 American Association of School Librarians (AASL) Distinguished Service Award.
Debra E. Kachel
Debra E. Kachel, Affiliate Faculty, Antioch University Seattle, and SLIDE Project Director, has over 30 years’ experience as a school librarian. She previously taught for Drexel University, Mansfield (PA) University and McDaniel College (MD) and is active in the Advocacy Committee of the Pennsylvania School Librarians Association. She also received AASL’s 2014 Distinguished Service Award and collaborated with Lance on the Pennsylvania School Library Study.
Caitlin Gerrity
Caitlin Gerrity is an Associate Professor of Library & Information Science at Southern Utah University. She completed her MLIS at Drexel University and previously served as a K-12 teacher librarian. She currently teaches college-level research and information literacy skills and directs the School Library Endorsement Program, which prepares teacher librarians for the field. In 2019, Caitlin was also named the Librarian of the Year by the Utah Library Association.
Notes
1 Information literacy is knowing when and why you need information; where to find it; and how to evaluate, use, and communicate it in an ethical manner. (American Association of School Librarians [AASL], Citation2018, p. 277).
2 According to the NCES definition, a school librarian is “a professional staff member or supervisor assigned specific duties and school time for professional library services activities. These include selecting, acquiring, preparing, cataloging, and circulating books and other printed materials; planning the use of the library by students, teachers, and instructional staff; and guiding individuals in the use of library books and material maintained separately or as a part of an instructional materials center” (School librarian. School and District Glossary, Citationn.d.b).
3 The number of school librarian FTEs divided by the number of schools in the districts.
4 The standard of one full-time school librarian per school is established and promulgated by the American Association of School Librarians in the National School Library Standards for Learners, School Librarians, and School Libraries (AASL, Citation2018).
5 According to NCES (Citation2002), a Hispanic or Latino person is of Cuban, Mexican, Puerto Rican, South or Central American, or other Spanish culture or origin, regardless of race.
6 District enrollment ranges used in this analysis are the ones used by the National Center for Education Statistics in the annual Digest of Education Statistics (NCES, Citation2020).
References
- American Association of School Librarians. (2018) . National school library standards for learners, school librarians, and school libraries. ALA.
- American Association of School Librarians. (2020, June 29). Instructional role of the school librarian. https://www.ala.org/aasl/sites/ala.org.aasl/files/content/advocacy/statements/docs/AASL_Position_Statement_Instructional_Role.pdf
- Church, A. P. (2008). The instructional role of the library media specialist as perceived by elementary school principals. School Library Media Research, 11. http://www.ala.org/ala/mgrps/divs/aasl/aaslpubsandjournals/slmrb/slmrcontents/volume11/chur_ch.cfm
- Farmer, L. S. J., & Phamle, S. (2021). Transitioning to college: Impact of high school librarians. The Journal of Academic Librarianship, 47(1), 102262. https://doi.org/10.1016/j.acalib.2020.102262
- Franklin, L. (2018). Tactical advocacy: How one school district regained optimal staffing for school libraries. Teacher Librarian, 45(4), 20–23.
- Gretes, F. (2013, August 12). School library impact studies: A review of findings and guide to sources. Gretes Research Services. https://massteacher.org/-/media/massteacher/files/employment-licensure/librarytaskforce/wd-28-summary-library-impact-studies.pdf?la=en
- Guarria, C. I., & Wang, Z. (2011). The economic crisis and its effect on libraries. New Library World, 112(5/6), 199–214. https://doi.org/10.1108/03074801111136248
- Kachel, D. E. (2013). School library research summarized: A graduate class project. Mansfield University. https://keithcurrylance.com/wp-content/uploads/2013/07/MU-LibAdvoBklt2013.pdf
- Kachel, D. E., & Lance, K. C. (2018). Changing times: School librarian staffing status. Teacher Librarian, 45(4), 14–19.
- Kachel, D. E., & Lance, K. C. (2021a, January 26). Appendix to contexts of school librarian employment. SLIDE: The School Librarian Investigation—Decline or Evolution?
- Kachel, D. E., & Lance, K. C. (2021b, January 26). Contexts of school librarian employment. SLIDE: The School Librarian Investigation—Decline or Evolution? https://libslide.org/pubs/contexts.pdf
- Kaplan, A. G. (2006). Benign neglect: Principals’ knowledge of and attitudes towards school library media specialists [ Doctoral dissertation]. University of Delaware.
- Lance, K. C., & Kachel, D. E. (2018). Why school librarians matter: What years of research tell us. Phi Delta Kappan, 99(7), 15–20. https://doi.org/10.1177/0031721718767854
- Lance, K. C., & Kachel, D. E. (2021, July). Perspectives on school librarian employment in the United States, 2009-10 to 2018-19. SLIDE: The School Librarian Investigation—Decline or Evolution? https://libslide.org/publications/perspectives.
- Lance, K. C., & Kachel, D. E. (2022). Pandemic accelerates school librarian losses and exacerbates pre-existing inequities. (A SLIDE special report). SLIDE: The School Librarian Investigation—Decline or Evolution? https://libslide.org/publications/pandemic
- Levin, K. (2019, August 9). Amid a literacy crisis, Michigan’s school librarians have all but disappeared. Chalkbeat. https://chalkbeat.org/posts/detroit/2019/08/08/michigan-school-librarian-shortage/
- Lewis, M. (2016). Professional learning facilitators in 1:1 program implementation: Technology coaches or school librarians? School Libraries Worldwide, 22(2), 13–23. https://doi.org/10.29173/slw6913
- Long, C. (2016, November 2). Study: Access to school library resources forms along racial lines. NEA Today. http://neatoday.org/2016/11/02/race-and-school-library-access/
- Luhtala, M. (2012). Rocking your library world: Strategies for success in a tough economy. Knowledge Quest, 40(3), 14–19.
- McGhee, M. W., & Jansen, B. A. (2006). The principal component: Bringing your administrator on board. Library Media Connection, 24(4), 34–35.
- Merga, M. K. (2019). Do librarians feel that their profession is valued in contemporary schools? Journal of the Australian Library and Information Association, 68(1), 18–37. https://doi.org/10.1080/24750158.2018.1557979
- Morris, B. J., & Packard, A. (2007). The principal’s support of classroom teacher-media specialist collaboration. School Libraries Worldwide, 13(1), 36. https://doi.org/10.29173/slw6984
- NCES. (2002, October 1). Statistical standards glossary. https://nces.ed.gov/statprog/2002/glossary.asp
- NCES. (2020). Digest of education statistics. https://nces.ed.gov/programs/digest/d20/tables/dt20_214.20.asp
- NCES. CCD. (n.d.a). Locale, urban-centric. School and district glossary. https://nces.ed.gov/ccd/commonfiles/glossary.asp
- NCES. CCD. (n.d.b). School librarian. School and district glossary https://nces.ed.gov/ccd/commonfiles/glossary.asp
- Pribesh, S., Gavigan, K., & Dickinson, G. (2011). The access gap: Poverty and characteristics of school library media centers. The Library Quarterly, 81(2), 143–160. https://doi.org/10.1086/658868
- Roys, N. K., & Brown, M. E. (2004). The ideal candidate for school library media specialist: Views from school administrators, library school faculty, and MLS students. School Library Media Research, 7. http://www.ala.org/aasl/aaslpubsandjournals/slmrb/slmrcontents/volume72004/candidate
- Scholastic. (2016). School libraries work! A compendium of research supporting the effectiveness of school libraries. www.scholastic.com/slw2016
- Shannon, D. M. (2009). Principals’ perceptions of school librarians. School Libraries Worldwide, 15(2), 1. https://doi.org/10.29173/slw6790
- Shannon, D. M. (2012). Perceptions of school library programs and school librarians: Perspectives of supportive school administrators. Teacher Librarian, 39(3), 17.
- Shannon, D. M. (2016). Principals’ perspectives of school librarians. In M. A. Mardis (Ed.), Librarians and educators collaborating for success: The international perspective (pp. 28–45). Libraries Unlimited and International Association of School Librarians.
- Traska, M. R. (2013). The VOID in charter schools. American libraries, 44(6), 26–30.
- University of Central Arkansas. (2017). Privilege—What does it mean? https://uca.edu/training/files/2017/11/Privilege-What-Does-It-Mean-Handout.pdf
- U.S. Dept. of Agriculture. (2017, November). National school lunch program (NSLP) fact sheet. https://fns-prod.azureedge.us/sites/default/files/resource-files/NSLPFactSheet.pdf