
Abstract
Objective
To assess total and allergic rhinitis (AR)-related healthcare costs among AR patients residing in the United States with a focus on patients persisting with AIT.
Methods
AR patients were identified in the IBM MarketScan database between 1 January 2014 to 31 March 2017. Patients receiving allergy immunotherapy (AIT) were identified with relevant billing codes (earliest AIT claim = index date); non-AIT patients were identified with claims containing a diagnosis code for AR (earliest AR claim = index date). AIT patients reaching 25+ injection claims were analyzed as a separate maintenance cohort. All patients were required to have continuous enrollment for 12 months preceding and following index.
Results
A total of 2,334,530 AR patients were included; 103,207 had at least 1 AIT claim, with 45,279 (43.9%) of these patients reaching maintenance, and 24,640 AIT patients (23.9%) never presenting a single injection claim. Compared to non-AIT patients, patients initiating AIT presented higher rates of baseline comorbidities, including asthma (30.1% vs. 7.5%) and conjunctivitis (21.7% vs. 4.4%). During the follow-up period, patients reaching the maintenance phase of AIT incurred lower total costs than the overall AIT cohort ($10,431±$16,606 vs. $11,612±$24,797), and also presented lower follow-up hospitalization costs ($698±$7,248 vs. $1,281±$12,991) and total medical costs ($7950±$13,844 vs. $8989±$22,019).
Conclusions
Continued efforts are needed to increase patient awareness of available options and adherence to AIT, along with reducing wastage. Despite AIT patients presenting fairly progressed disease at the time of treatment initiation, this therapy remains an economical treatment option, as it was not accompanied by substantial increases in overall healthcare expenditure, and may promote positive societal impacts beyond the direct medical costs.
The prevalence of allergic diseases has increased over the past 50 years and affects between 10–30% of the world population.
Allergic rhinitis (AR) poses a significant economic burden in the form of both direct and indirect costs
Allergy immunotherapy (AIT) is the only treatment option able to modify the underlying course of the disease.
What is known on this topic
Specific all-cause and AR-related healthcare costs decreased following the initiation of AIT among patients diagnosed with AR, with the largest decreases observed among AIT patients reaching the maintenance phase of treatment, while non-AIT patients showed increases in all categories assessed over a similar follow-up period.
Cost decreases among AIT patients were observed despite increased levels of comorbidities compared to non-AIT patients, as the AIT cohort presented elevated rates of atopic dermatitis (7.1% vs. 2.7%), conjunctivitis (21.7% vs. 4.4%), asthma (30.1% vs. 7.5%), and chronic sinusitis (22.6% vs. 4.9%).
An analysis of patients’ index subcutaneous AIT consultation revealed substantial variability in the initial treatment costs, with nearly 20% of paid amounts exceeding $1,000; given nearly 1 in 4 AIT patients who get AIT mixed never came back for their first injection, this highlights an opportunity to target frontloaded billing practices and the timing of mixing/injection as an area to minimize healthcare waste.
What this study adds
Introduction
Allergic rhinitis (AR), also known as hay fever, is a condition in which inflammatory processes stimulated by environmental allergens result in sneezing, airflow obstruction, nasal pruritus, and clear nasal dischargeCitation1. Allergic diseases have increased in prevalence across the globe over the past half century, affecting between 10–30% of the world populationCitation2, with sensitization rates to common allergens in school-aged children approaching 50%Citation3, As a chronic disease, AR is associated with significant direct costs in the form of disease management, indirect costs in the form of decreases in work productivity, and “hidden” costs associated with the management of comorbidities common to patients with ARCitation4. As such, AR poses a significant economic burden to society, particularly if treatment protocols are not followedCitation5.
Societal estimates of the medical costs attributed to AR in the United States (U.S.) have consistently returned values between approximately $3 and $4 billion dollars annuallyCitation6–9. A previous analysis of medical and pharmacy claims from a U.S. managed care plan demonstrated that AR patients incurred over $650 annually in direct AR-related costs, which were evenly dispersed between medical and pharmacy services, and which were elevated among patients with specific AR-related comorbiditiesCitation10. Asthma, atopic dermatitis (eczema), allergic conjunctivitis, and various sleep disorders are just a few of the comorbidities commonly associated with an AR diagnosisCitation11–17, and recent evidence has highlighted the substantial economic burden of both asthma, particularly among those with severe diseaseCitation18, and atopic dermatitisCitation19. As such, AR is seldom an isolated disorder, and the associated sequela contributing to these “hidden” costs should be taken into consideration when assessing the true burden of this disease.
Allergen avoidance, pharmacotherapy, and immunotherapy are the primary options when considering a disease management approachCitation20. Though pharmacotherapy can suppress symptoms of AR, allergy immunotherapy (AIT) is the only therapy that can modify the underlying course of diseaseCitation21. AIT is typically prescribed for the most severe AR, and persistence with treatment has been associated with reduced high-cost venue service use and AR-related expenditureCitation5. Additionally, a recent review has demonstrated that AIT is a cost-effective option in the management of AR compared with standard drug treatmentCitation22.
However, there remains a dearth of up to date, real-world evidence studies focused on the costs of AR, particularly among the subset of patients prescribed AIT. Further, as adherence and persistence rates to AIT remain less than optimalCitation23–26, it will be critical to evaluate the relationship between treatment compliance/non-compliance, outcomes, and potentially healthcare wastage. Therefore, the purpose of this exploratory study was to better understand the total and AR-related healthcare costs among a large, nationally representative sample of AR patients residing in the United States, with a focus on patients prescribed AIT.
Methods
Study design and data source
This observational, retrospective study used de-identified healthcare claims from the IBM MarketScan Commercial Database spanning the period of 1 January 2014, through 31 March 2017 (study period) to evaluate the healthcare cost profiles of patient diagnosed with AR in the United States. The database comprises enrollment and demographic information, as well as inpatient medical, outpatient medical, and outpatient pharmacy claims data collected from employees, dependents, retirees, and members of >300 large self-insured U.S. employers and >25 U.S. health plans. The database includes employer and health plan sourced data from approximately 140 million individuals from 1995 to 2017.
All database records were de-identified and fully compliant with the US Health Insurance Portability and Accountability Act (HIPAA); this compliance with HIPAA regulation meant that patient consent and Institutional Review Board approval to conduct this study were unnecessary.
Patient selection and cohort assignment
To be eligible for study inclusion, patients were required to meet the following criteria:
The presence of ≥ 1 medical or pharmacy claim for AIT, and if an absence of AIT claims, ≥ 1 claim with a diagnosis of AR (ICD-9-CM 477.x or ICD-10-CM J30.x) between 1 January 2014, and 31 March 2017
Current Procedural Terminology (CPT) codes for subcutaneous AIT (SCIT) included 95115; 95117; 95120; 95125; 95144; 95165; 95180; and 95199Citation27
The earliest service date for either an AIT or AR claim served as the index date
At least 12 months of continuous enrollment with medical and pharmacy benefits for 12 months preceding the index date
At least 12 months of continuous enrollment with medical and pharmacy benefits for 12 months following the index date
Additionally, for patients in the AIT cohort, the 12-month pre-index period was required to be absent of any AIT treatment, and patients were excluded if they presented any claims for venom allergies at any time during the measurement window. As the build-up phase of SCIT may entail 1–2 shots per week for 3–6 months, based on clinician recommendation, AIT patients reaching the maintenance phase of treatment were operationally defined in the current study as those presenting 25+ AIT injection claims (CPT codes 95115 and 95117) and were analyzed as a stand-alone cohort. Review of the frequency distribution of patients meeting this conservative definition corresponding to a once-weekly shot regimen for 6 months confirmed this threshold. As such, three main cohorts comprised the primary study comparisons, and included all AIT patients, AIT patients reaching the maintenance phase of treatment (25+ injection claims), and non-AIT patients. Additionally, for the analysis of healthcare wastage, the proportion of patients who discontinued AIT after a single visit was also presented.
Measures
Sample characteristics
Patient demographic characteristics were assessed on the index date and included age, sex, geographic region of residence (Northeast, North-Central, South, West, and unknown), urban or rural residency, and index year. Patient clinical characteristics were assessed during the 12-month baseline, and included the Deyo-Charlson comorbidity index (a claims-based overall measure of health)Citation28, the presence of comorbid conditions of interest (asthma, atopic dermatitis, conjunctivitis, depression, eustachian tube disorder, food allergy, headache, heartburn/reflux/GERD, migraine, otitis media, pneumonia, skin rash [including pruritus], eczema, sleep apnea, sleep disturbance, nasal polyps, chronic sinusitis, bronchitis, and any upper respiratory tract infection), the use of specific prescription medication classes (antihistamines, decongestants, intranasal corticosteroids, and nasal sprays), and the frequency of specific surgeries (polypectomy, septoplasty, sinus surgey, turbinectomy, and tympanostomy).
Outcomes
All-cause and AR/AR comorbidity-specific healthcare costs were assessed during each the 12-month baseline and 12-month follow-up period, and were reported by the following service categories: inpatient, emergency room (ER), physician office, laboratory, other outpatient services, outpatient prescriptions, and surgical procedures. AR/AR comorbidity-related healthcare costs included all inpatient medical claims with any of the following diagnosis codes in the primary position or any position on outpatient claims: AR, asthma, atopic dermatitis, conjunctivitis, eosinophilic esophagitis, eustachian tube disorder, food allergy, headache, migraine, otitis media, skin rash (including pruritus), eczema, sleep apnea, sleep disturbance, bronchitis, any upper respiratory tract infection, nasal polyps, or chronic sinusitis. Additionally, all pharmacy claims indicated for AR or AR-related treatment, and any of the five surgeries listed above (polypectomy, septoplasty, sinus surgey, turbinectomy, and tympanostomy) also contributed to disease-related costs.
As medical coding practices for the reimbursement of AIT, in particular SCIT, are known to vary, the distribution of paid amounts appearing on the initial, index SCIT claim were also examined as a separate outcome given the known issues with AIT adherenceCitation23–26. Costs were presented for the eight distinct non-venom AIT procedure codes in use at the time of the analyses, and these visit costs were segmented into categories of the total amount claimed ($0–$99, $100–$299, $300–$499, $500–$999, $1000+). For all analyses of cost metrics, dollar amounts were inflated to 2018 USD (the final year of study data) using the medical component of the Consumer Price IndexCitation29.
Statistical analysis
As this was an exploratory study, only descriptive statistics were reported for demographics, clinical characteristics, and healthcare cost measures for three cohorts: all AIT patients, AIT patients reaching the maintenance phase of treatment, and non-AIT patients. Continuous variables were summarized using means and standard deviations (SD). Categorical variables were reported using counts and percentages.
Results
A total of 2,334,530 AR patients qualified for the current study; 103,207 patients presented ≥1 AIT claim (either for preparation or administration), with 45,279 (43.9%) of these AIT patients presenting 25+ AIT injection claims (maintenance). A total of 17,757 AIT patients (17.2%) only presented a single AIT claim of any type, while 24,640 AIT patients (23.9%) only presented without any injection claims (i.e. had AIT mixed but did not receive it). The remaining 2,231,323 AR patients did not receive AIT treatment.
Groups were similar demographically, with mean patient ages in the early 30 s, and a relatively uniform dispersion between early and middle adulthood (). A greater proportion of patients receiving AIT were female compared to non-AIT patients (58.2% vs. 56.4%), and patients primarily resided in urban areas of the southern United States. During the baseline year, discordant rates of a number of comorbid conditions were observed between AIT and non-AIT cohorts, with a higher proportion of AIT patients presenting claims for atopic dermatitis (7.1% vs. 2.7%), conjunctivitis (21.7% vs. 4.4%), asthma (30.1% vs. 7.5%), chronic sinusitis (22.6% vs. 4.9%), and upper respiratory tract infections (60.3% vs. 34.2%; ). Additionally, a higher proportion of AIT patients filled baseline prescriptions for decongestants (28.9% vs. 6.2%), nasal sprays (44.3% vs. 11.1%), antihistamines (16.8% vs. 4.7%), and intranasal corticosteroids (36.9% vs. 11.3%), with a higher proportion also presenting a baseline AR-related surgical procedure (4.1% vs. 0.9%) compared to non-AIT patients.
Table 1. Demographic characteristics by AIT cohorts.
Table 2. Baseline clinical characteristics by AIT cohorts.
presents all-cause and AR/AR comorbidity-related healthcare cost metrics during each of the baseline and follow-up periods. In the year leading up to treatment initiation, the AIT cohort presented greater baseline all-cause total healthcare costs compared to non-AIT patients ($9,418±$20,566 vs. $5,213±$19,503), along with greater total AR-related costs ($2,482±$5,118 vs. $518±$2,252). The majority of costs were derived from medical expenditure as opposed to pharmacy expenditure, which was consistent for both all-cause and AR-related cost metrics. Across all service categories, AIT patients presented greater mean baseline costs compared to non-AIT patients, with the subset of patients who eventually reached the maintenance phase of treatment (25+ injections) presenting a slightly lower mean baseline cost compared to the overall AIT cohort ($8,447±$15,467 vs. $9,418±$20,566).
Table 3. All-cause and AR-related healthcare costs by AIT cohorts in the baseline and follow-up periods.
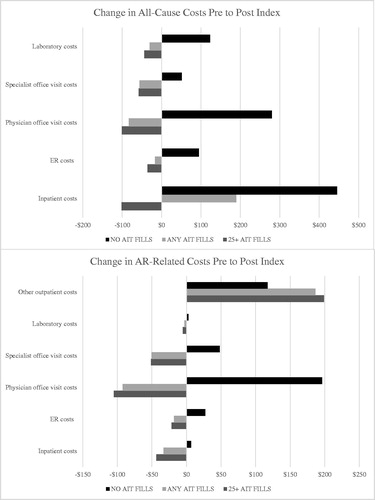
Similar cost patterns emerged during the follow-up period, with the AIT cohort presenting greater mean all-cause total healthcare costs compared to non-AIT patients ($11,612±$24,797 vs. $7815±$27,041), and with patients reaching the maintenance phase of AIT presenting total mean costs values lower than the overall AIT cohort ($10,431±$16,606). Compared to the full AIT cohort, AIT maintenance patients presented lower mean follow-up hospitalization costs ($698±$7248 vs. $1281±$12,991), emergency room costs ($96±$513 vs. $125±$687), pharmacy costs ($2480±$7198 vs. $2622±$8674), and total medical costs ($7950±$13,844 vs. $8989±$22,019). Follow-up AR/AR comorbidity-related costs were naturally highest among AIT patients reaching the maintenance phase of treatment ($4380±$4909), as these patients incurred greater costs for their extended period of AIT treatment. In assessing the change in costs from baseline to follow-up, AIT patients presented reductions in nearly all service categories assessed with the exception of “other” outpatient services, where AIT treatment costs are captured. These results were largely driven by the subset of patients reaching the maintenance phase of treatment (). The non-AIT group showed increases in all categories assessed.
Figure 1. All-cause and AR-related cost differences baseline to follow-up by AIT cohorts.
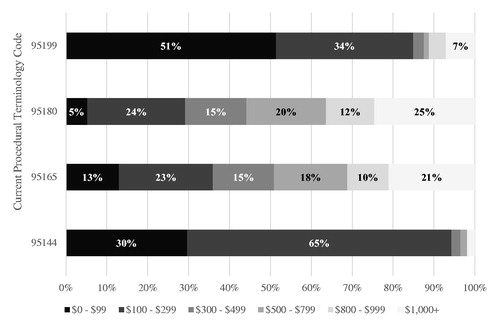
As less than half of AIT patients reached the maintenance phase of treatment, with 17% only presenting a single AIT claim of any type, and 23.9% never presenting a single AIT injection claim, analyses of the initial SCIT claim were undertaken to quantify potential AIT-related healthcare wastage. The cost associated with the index claim for SCIT varied greatly, with a mean value of $674±$832. Fifty-five percent of index SCIT claims carried a paid amount of less than $500, though 20% of these claims were observed with cost values in excess of $1000. presents the procedure codes with the largest variance in costs for the index SCIT claim. Procedure code 95165 (preparation and provision of antigens for allergen immunotherapy)Citation27 was used in 78% of the first claims, and carried an average cost of $748±$849 per claim, with 21% of the paid amounts on these claims exceeding $1000. Among patients presenting a single AIT claim, 30.4% of these sole visits were associated with costs in excess of $1000, with 12.8% in excess of $2000 As such, patients presenting with a single AIT claim managed to incur nearly half the costs associated with AIT compared to patients presenting at least 25 injections ($976±$1367 vs. $2150±$1205).
Figure 2. Cost distribution of index SCIT claims by select Current Procedural Terminology codes.
Discussion
This study presents a real-world examination of the cost profiles of patients diagnosed with AR in the United States, with a focus on those patients prescribed AIT. The AIT cohort presented higher rates of numerous baseline allergy-related comorbidities compared to non-AIT patients, including asthma (30.1% vs. 7.5%), chronic sinusitis (22.6% vs. 4.9%), and upper respiratory tract infections (60.3% vs. 34.2%), suggesting those patients most severely impacted by the disease were most likely to initiate AIT. These translated into higher baseline and all-cause costs for the AIT cohort compared to non-AIT. However, from the year prior to AIT initiation to the year following, patients in the AIT cohort presented cost decreases in the majority of service categories assessed, including inpatient hospital and ER costs, while the non-AIT group showed increases in all categories assessed. AIT patients reaching the maintenance phase of treatment were observed to present the largest reductions in expenditure from baseline to follow-up
Total annual healthcare costs were relatively low for the full AIT and non-AIT cohorts ($11,612±$24,797 vs. $7815±$27,04) compared to other chronic diseases in which long-term maintenance treatment may be indicatedCitation30,Citation31. The lack of additional healthcare costs associated with prolonged use of AIT is noteworthy, as the maintenance group actually incurred lower annual healthcare costs than the AIT group as a whole ($10,431±$16,606 vs. $11,612±$24,797). For most therapeutic classes, adherence and persistence is often associated with significantly increased medical and/or pharmacy costs in the short term, which are not consistently offset by reductions in other healthcare spendCitation32, and has long been cited by patients as one of the reasons for medication non-adherenceCitation33. As such, results demonstrate that despite AIT patients presenting fairly progressed disease at the time of AIT initiation based on their increased levels of allergy-related comorbidities compared to non-AIT patients, AIT remains an economical treatment option and is not expected to be accompanied by notable increases in overall healthcare expenditure.
In the current study, less than half of AIT patients reached the maintenance phase of treatment, which may be partially explained by the fact that nearly a quarter of patients never presented a single injection claim. The sub-analysis of the initial, index SCIT claims revealed a curious pattern of variables costs, particularly when juxtaposed against this observed low rate of AIT persistence. Medical procedure coding practices for the reimbursement of AIT may vary, partly driven by the discrepancies in accepted code usage across health insurance plans. Present results demonstrated substantial variability in the initial treatment costs for SCIT, along with a high mean cost, and with nearly 20% of paid amounts exceeding $1000. The observed spread in claimed amounts may be reflective of certain physicians’ willingness and ability to bill for allergen extracts, which would be administered over multiple successive office visits. This up front-billing may contribute to healthcare waste, particularly as almost 1 in 4 patients never actually received a single AIT injection. Sublingual AIT (SLIT) tablets, which have been FDA approved since 2014Citation34, may present a better option to promote persistence and adherence for some proportion of the AR population and comes with less up front billing. A number of therapy-related factors have been shown to correlate negatively with treatment adherence, including the route of administration and complexity of the regimenCitation35. As SLIT is taken at home orally once a day, this may present a more convenient option for select patients. Though the direct comparison of adherence rates between SLIT and SCIT have been variableCitation36,Citation37, these can often be traced to the inherent difficulties comparing two routes of administration, often leading to bias grounded in differences in how adherence is defined and thresholds for compliance are set. Regardless, improved patient treatment matching efforts and patient education on AIT maintenance treatment in general may be warranted, in which the timing and proportion of AR patients identified for candidates for SCIT or SLIT is maximized.
As AR has also been shown to have significant impacts on quality of life and work productivity, there is more than a direct economic benefit to be realized when the disease is treated timely and appropriately. Studies have reported the direct impact of AR on mood, anxiety, depression, social life, sleeping, cognitive function, school performance, and overall quality of lifeCitation38,Citation39, with specific clinical, immunological, and functional parameters of the disease directly tied to quality of life indicesCitation40. Further, results of a systematic review demonstrate that 35% of patients with AR report impairment on the job, also with a direct relationship to symptom severityCitation41,Citation42. The total indirect cost estimates of AR vary considerably from 0.1 billion to 9.7 billion USD annually, with per-person costs of $593Citation9,Citation43. Improving the overall quality of life for these patients, along with the promotion of increased productivity, will result in significant societal cost savings beyond direct medical expenditure, which will be critical as the increasing trend in the prevalence of AR is likely to continue due to a variety of environmental and lifestyle-based causesCitation44,Citation45]. Thus, it may be advantageous for patients to initiate AIT earlier in the course of their disease, which could hinder the development of a more severe disease and minimize the onset of allergy-related comorbidities.
Limitations
Studying AR in administrative claims data does come with some limitations. First, AR can often be managed without intervention of a physician (e.g. over the counter medications), meaning there will be a period of time where AR patients do not generate any claims with an AR diagnosis until the disease reached more severe levels. As such, the true length of disease for patients in the current sample is unknown. Additionally, the current study required a minimum of 2 years of continuous commercial health coverage. Therefore, results of this analysis may not be generalizable to AR patients who change or lose insurance, to those with Medicare/Medicaid insurance, and to the uninsured. Also, though patients were followed for two years, the long-term clinical outcomes of AR will likely require an extended follow-up window, as AIT will require multiple years before its full therapeutic benefit is realized. Additionally, administrative claims data are subject to data coding limitations and data entry error, which may result in missing or erroneous data. Finally, patient receiving SLIT tablet prescriptions were also included in the analyses, and may differ in some ways from those receiving SCIT. Analyses focused solely on SLIT tablet patients may be warranted as a follow-up to the current investigation.
Conclusion
In summary, this study presents the results of a real-world examination of the direct costs associated with AR in the United States, particularly among those treated with AIT, which remains the only available treatment option which can induce allergen-specific immune tolerance. Results demonstrate that despite AIT patients presenting fairly progressed disease at the time of treatment initiation, this therapy remains an economical treatment option, as it was not accompanied by increases in overall healthcare expenditure. In fact, from baseline to follow-up, patients receiving AIT presented cost decreases in the majority of service categories assessed, including inpatient hospital and ER costs, while the non-AIT group showed increases in all categories assessed. The observed increase in the allergy-related comorbidity load at the onset of AIT suggest these patients are delaying this therapy until their disease is severe, while analyses focused on patients’ initial AIT claim revealed substantial variability in costs for these visits, highlighting an area of healthcare wastage for patients who do not persist with therapy. Taken together, continued efforts are needed to increase patient awareness of available options and adherence to AIT to improve patient treatment matching efforts, including use of SLIT tablets. Given the known indirect costs of AR and the toll this disease can take on general quality of life, the full societal impact of optimal disease management approaches will extend beyond the direct medical costs.
Transparency
Declaration of funding
This work was supported by ALK-Abelló.
Declaration of financial/other relationships
KR, DW, MA and EH were employed by ALK-Abelló during the execution of this study. JT is employed by IBM Watson Health as a consultant and received funding from ALK-Abelló to conduct this study. Peer reviewers on this manuscript have no relevant financial or other relationships to disclose.
Previous presentation
A preliminary analysis of select data appearing in the current manuscript was presented at the AMCP 2020 annual meeting, April 21-24.
Acknowledgements
Lisa Elliott is greatly acknowledged for her assistance with the development of various elements of the initial study design.
References
- Khan DA. Allergic rhinitis and asthma: epidemiology and common pathophysiology. Allergy Asthma Proc. 2014 Sep-Oct;35:357–361.
- Mims JW. Epidemiology of allergic rhinitis. Int Forum Allergy Rhinol. 2014; 4 Suppl(2) :S18–S20.
- World Health Organization. White Book on Allergy 2011–2012 Executive Summary Milwaukee, WI2012 [December, 12, 2019. Available from: https://www.worldallergy.org/UserFiles/file/WAO-White-Book-on-Allergy_web.pdf.
- Blaiss MS. Allergic rhinitis: direct and indirect costs. Allergy Asthma Proc. 2010; 31:375–380.
- Allen-Ramey F, Mao J, Blauer-Peterson C, et al. Healthcare costs for allergic rhinitis patients on allergy immunotherapy: a retrospective observational study. Curr Med Res Opin. 2017; 33:2039–2047.
- Law AW, Reed SD, Sundy JS, et al. Direct costs of allergic rhinitis in the United States: estimates from the 1996 Medical Expenditure Panel Survey. J Allergy Clin Immunol. 2003; 111:296–300.
- Meltzer EO, Bukstein DA. The economic impact of allergic rhinitis and current guidelines for treatment. Ann Allergy Asthma Immunol. 2011;106:S12–S6.
- Mudarri DH. Valuing the economic costs of allergic rhinitis, acute bronchitis, and asthma from exposure to indoor dampness and mold in the US. J Environ Public Health. 2016;2016:2386596.
- Reed SD, Lee TA, McCrory DC. The economic burden of allergic rhinitis: a critical evaluation of the literature. Pharmacoeconomics. 2004;22:345–361.
- Dalal AA, Stanford R, Henry H, et al. Economic burden of rhinitis in managed care: a retrospective claims data analysis. Ann Allergy Asthma Immunol. 2008;101:23–29.
- Shaaban R, Zureik M, Soussan D, et al. Rhinitis and onset of asthma: a longitudinal population-based study. Lancet. 2008;372:1049–1057.
- Guerra S, Sherrill DL, Martinez FD, et al. Rhinitis as an independent risk factor for adult-onset asthma. J Allergy Clin Immunol. 2002;109:419–425.
- Hopper JL, Bui QM, Erbas B, et al. Does eczema in infancy cause hay fever, asthma, or both in childhood? Insights from a novel regression model of sibling data. J Allergy Clin Immunol. 2012; 130:1117–1122.e1.
- Bielory L. Allergic conjunctivitis and the impact of allergic rhinitis. Curr Allergy Asthma Rep. 2010;10:122–134.
- Hadley JA, Derebery MJ, Marple BF. Comorbidities and allergic rhinitis: not just a runny nose. J Fam Pract. 2012;61:S11–S15.
- Celakovska J, Bukac J. Food allergy in patients suffering from atopic dermatitis – association with concomitant allergic diseases. Food Agr Immunol. 2015;26:325–339.
- Čelakovská J, Ettlerová K, Ettler K, et al. Food allergy, asthma bronchiale, and rhinitis in atopic dermatitis patients with total immunoglobulin E under and above 200 IU/ml. Food Agricult Immunol. 2015;26:671–681.
- Settipane RA, Kreindler JL, Chung Y, et al. Evaluating direct costs and productivity losses of patients with asthma receiving GINA 4/5 therapy in the United States. Ann Allergy Asthma Immunol. 2019; 123:564–572 e3.
- Adamson AS. The economics burden of atopic dermatitis. Adv Exp Med Biol. 2017;1027:79–92.
- May JR, Dolen WK. Management of allergic rhinitis: a review for the community pharmacist. Clin Ther. 2017;39:2410–2419.
- Burks AW, Calderon MA, Casale T, et al. Update on allergy immunotherapy: American Academy of Allergy, Asthma & Immunology/European Academy of Allergy and Clinical Immunology/PRACTALL consensus report. J Allergy Clin Immunol. 2013;131:1288–1296 e3.
- Cox LS, Murphey A, Hankin C. The cost-effectiveness of allergen immunotherapy compared with pharmacotherapy for treatment of allergic rhinitis and asthma. Immunol Allergy Clin North Am. 2020;40:69–85.
- Tinkelman D, Smith F, Cole WQ, 3rd, et al. Compliance with an allergen immunotherapy regime. Ann Allergy Asthma Immunol. 1995;74:241–246.
- Silva D, Pereira A, Santos N, et al. Costs of treatment affect compliance to specific subcutaneous immunotherapy. Eur Ann Allergy Clin Immunol. 2014;46:87–94.
- Hsu NM, Reisacher WR. A comparison of attrition rates in patients undergoing sublingual immunotherapy vs subcutaneous immunotherapy. Int Forum Allergy Rhinol. 2012;2:280–284.
- Cohn JR, Pizzi A. Determinants of patient compliance with allergen immunotherapy. J Allergy Clin Immunol. 1993;91:734–737.
- American Medical Association. CPT 2019 Professional Edition. 5th revised ed. Chicago (IL): American Medical Association; 2019.
- Deyo RA, Cherkin DC, Ciol MA. Adapting a clinical comorbidity index for use with ICD-9-CM administrative databases. J Clin Epidemiol. 1992;45:613–619.
- United States Bureau of Labor Statistics. Consumer Price Index for All Urban Consumers: Medical care in U.S. city average, all customers, not seasonally adjusted Washington; 2019 [2019 December 19]. Available from: https://www.bls.gov/cpi/
- Chapel JM, Ritchey MD, Zhang D, et al. Prevalence and medical costs of chronic diseases among adult medicaid beneficiaries. Am J Prev Med. 2017;53:S143–S154.
- Yu H, MacIsaac D, Wong JJ, et al. Market share and costs of biologic therapies for inflammatory bowel disease in the USA. Aliment Pharmacol Ther. 2018;47:364–370.
- Gillespie CW, Morin PE, Tucker JM, et al. Medication adherence, health care utilization, and spending among privately insured adults with chronic conditions in the United States, 2010-2016. Am J Med. 2020;133:690–704 e19.
- Mojtabai R, Olfson M. Medication costs, adherence, and health outcomes among medicare beneficiaries. Health Aff (Millwood)). 2003;22:220–229.
- ALK-Abelló A/S. Grastek (timothy grass pollen allergen extract) [package insert]. U.S. Food and Drug Administration 2014. Available from: https://www.fda.gov/media/88510/download
- Jin J, Sklar GE, Min Sen Oh V, et al. Factors affecting therapeutic compliance: a review from the patient's perspective. Ther Clin Risk Manag. 2008;4:269–286.
- Vogelberg C, Bruggenjurgen B, Richter H, et al. Real-world adherence and evidence of subcutaneous and sublingual immunotherapy in grass and tree pollen-induced allergic rhinitis and asthma. Patient Prefer Adherence. 2020;14:817–827.
- Borg M, Lokke A, Hilberg O. Compliance in subcutaneous and sublingual allergen immunotherapy: a nationwide study. Respir Med. 2020;170:106039.
- Meltzer EO, Gross GN, Katial R, et al. Allergic rhinitis substantially impacts patient quality of life: findings from the Nasal Allergy Survey Assessing Limitations. J Fam Pract. 2012;61:S5–S10.
- Ozdoganoglu T, Songu M, Inancli HM. Quality of life in allergic rhinitis. Ther Adv Respir Dis. 2012; 6:25–39.
- Ciprandi G, Klersy C, Cirillo I, et al. Quality of life in allergic rhinitis: relationship with clinical, immunological, and functional aspects. Clin Exp Allergy. 2007;37:1528–1535.
- Vandenplas O, Vinnikov D, Blanc PD, et al. Impact of rhinitis on work productivity: a systematic review. J Allergy Clin Immunol Pract. 2018;6:1274–1286 e9.
- Maoua M, Maalel OE, Kacem I, et al. Quality of life and work productivity impairment of patients with allergic occupational rhinitis. Tanaffos. 2019;18:58–65.
- Simoens S, Laekeman G. Pharmacotherapy of allergic rhinitis: a pharmaco-economic approach. Allergy. 2009;64:85–95.
- Akinbami LJ, Simon AE, Schoendorf KC. Trends in allergy prevalence among children aged 0-17 years by asthma status, United States, 2001-2013. J Asthma. 2016;53:356–362.
- Cingi C, Bayar Muluk N, Scadding GK. Will every child have allergic rhinitis soon? Int J Pediatr Otorhinolaryngol. 2019;118:53–58.