
 ?Mathematical formulae have been encoded as MathML and are displayed in this HTML version using MathJax in order to improve their display. Uncheck the box to turn MathJax off. This feature requires Javascript. Click on a formula to zoom.
ABSTRACT
The aim of this study was to evaluate genetic diversity within and between lines at the Norwegian live poultry gene bank as well as assessing the conservation value in an international context. Eight lines including the national breed, Jærhøns, were genotyped with the 600K Affymetrix® Axiom® Chicken Genotyping Array. The white egg layers were generally more inbred than the brown layers. Comparative analyses were carried out with 72 international populations of different origins. The lines that were last bred for commercial production in Norway, Norbrid, are clearly separated from the rest of the international set and more closely related to the current commercial lines. The brown egg layer Norbrid 7 has the highest relative contribution to genetic diversity. The Norwegian genebank lines are of conservation value in a national and international perspective, as they all add genetic diversity to the global set.
Introduction
The first signs of domestication of the chicken, originating from the jungle fowl (Gallus gallus), are nearly 8000 years old (Fumihito et al. Citation1996) and during the last century, man has created a wide variety of chicken breeds for different purposes. The isolation of populations and the development of breed-specific standards have led to a decrease in genetic diversity within breeds. However, the number of different breeds of chicken and phenotypic variation existing suggests that substantial genetic variation may still be present within the species. Since the 1990s, there has been a drastic reduction in the number of breeding companies supplying the global poultry market with genetic material and today, most of the world’s commercial egg production is based on genetics from only a few large companies (Muir et al. Citation2008). Hence, the evaluation of existing genetic diversity and the establishment of conservation priorities in chicken are of great importance.
In the 1960s, there were 23 different poultry breeding stations in Norway and a total of 26 different lines of egg layers. From 1969 to 1973, a national project was carried out to compare the lines for a number of production traits. In the following years, several breeding stations were shut down and only the most productive lines were continued. In 1973, the Norwegian live poultry gene bank was established. The initial purpose of the gene bank was to be a security back-up in case of disease or accidents at the breeding stations. The gene bank was also responsible for conserving the only national breed remaining, the Norwegian landrace Jærhøne. In 1994, the European Economic Area Agreement opened for import of livestock for egg production in Norway. The Norwegian egg-laying lines were soon outcompeted by imported lines from international breeding companies, and the Norwegian Poultry Breeding Association ended their breeding work in 1995. Today, the aim of the gene bank is to conserve the previously active breeding as well as other breeds of conservation value (Sæther et al. Citation2018).
Small or native poultry breeds can be of cultural and historical value, but they may also be a genetic resource for future poultry breeding and food production. Quantifying the conservation value of the genetic material in the gene bank is of importance in order to evaluate the conservation priorities and management of genetic diversity in the gene bank. This study includes the national Norwegian breed, Jærhøne, as well as seven other genetic lines from the Norwegian live poultry gene bank which were previously bred for commercial egg production in Norway. The results will aid in the discussion of the conservation value of the eight lines in a national perspective, as well as the future of the gene bank. The results may also be valuable in the evaluation of chicken genetic diversity in an international perspective. Comparative analyses were carried out with 72 populations of different origins, including two commercial lines. All genetic lines are genotyped with the high-density Affymetrix® Axiom® array for chicken, including more than 580,000 single nucleotide polymorphisms (SNPs) (Kranis et al. Citation2013). The aim of the study was to evaluate genetic diversity within and between the eight genetic lines of laying hens from the live poultry gene bank relative to existing international genetic resources as well as quantifying conservation values in single lines in terms of relative contributions to genetic diversity.
Material and methods
Genetic lines
Eight genetic lines of Norwegian egg layers from the live poultry gene bank at Hvam Agricultural College in Norway were included in the study. Jærhøns (JH) is the national Norwegian chicken breed and only line left from the Norwegian landrace. Roko 1 is the oldest, closed commercial breeding line in Norway and the only line left of the Rokohoens (Rokohøns, RK) lines. Norbrid 1 (NB1) and Norbrid 4 (NB4) were the maternal and paternal lines, respectively, in the hybrid Norbrid 41, which was the most commonly used commercial white egg layer in Norway until 1994. Norbrid 7 (NB7) and Norbrid 8 (NB8) were the maternal and paternal lines, respectively, in the most common brown egg layer hybrid, Norbrid 78. The Barred Plymouth Rock (Tverrstripet Plymouth Rock, TPR) line and the Rhode Island Red (RIR) line both came to the genebank from closing breeding stations in Norway around 1980. The lines have, since their introduction to the live genebank, been bred as closed lines on a rotation plan with 23–30 families of 4–6 individuals per family each generation. There has been no systematic documentation of traits and selection has been minimal, only leaving out dysfunctional and unfertile animals and concentrating on maintaining typical breed signatures and the existing phenotypic variation. The genotypes in this study are from the generation born in 2012. There is only one new generation per year, meaning there have been seven more generations born in the genebank when this paper was written, following the same rotation plan. Additional information on the chicken lines can be found in the Supplementary Material S1. The number of samples genotyped from each line is listed in .
Table 1. Number of genotyped individuals after quality control.
DNA extraction and genotyping
Blood samples were collected from the 150 individuals from the gene bank in 2011 and DNA was extracted in 2012. Blood samples (approximately 2 ml) were obtained from the wing vein with a 21ga, 1.5 in the needle. Blood was stored at −20°C in sodium heparin tubes. One drop of thawed blood was transferred to FTA Elute Micro Card (GE Healthcare, Piscataway, USA) and allowed to dry. DNA was extracted from the dried blood spot on the FTA card following the manufacturer’s instructions. The quality and concentration of the DNA were tested at Biobank AS, Norway in 2017. The samples were normalized to 10 ng/µL and 50 µL. Blood samples from commercial Lohmann hybrids were collected in 2017 and DNA extraction was carried out at BioBank AS, Hamar, Norway. All blood samples were collected according to Norwegian animal welfare regulations.
Genotyping was carried out at the Centre for Integrative Genetics (CIGENE, Arboretveien 6, 1433 Ås, Norway) with the Affymetrix® Axiom® Chicken Genotyping Array. The high-density SNP Array consists of 580,961 SNPs evenly distributed along the chicken genome and segregating in a wide variety of chicken breeds and populations (Kranis et al. Citation2013). The array will be referred to as the 600 K SNP array. In addition, 38 hens from the two most common commercial white and brown egg layer hybrids in Norway were included in the study; Lohmann LSL–classic and Lohmann Brown-classic, referred to as Lohmann white, and Lohmann brown, respectively. Five samples in total, one each from the lines Norbrid 8, Norbrid 4, Barred Plymouth Rock, Lohmann brown and Norbrid 7, failed quality controls in the genotyping process and were removed from subsequent analyses.
International reference data
A data set for comparative analyses was available from the Synbreed project (Malomane et al. Citation2019). The data consisted of two individuals per line, one male and one female, from 70 different lines of chicken. The genotyping was carried out with the same 600 K SNP array. Genetic lines in this data set ranged from fancy breeds to traditional breeds with Asian and European origin all sampled in Germany, as well as two wild types, Gallus gallus gallus and Gallus gallus spadiceus taken from the AVIANDIV collection (https://aviandiv.fli.de/). An overview of the populations in the data set and their origin is provided in .
Table 2. An overview of the genetic lines in the Synbreed data set (Weigend et al. Citation2014).
SNP quality control and filtering
PLINK 1.9 (Chang et al. Citation2015) was used for SNP filtering and LD-pruning. Initial filtering was carried out on a data set consisting of all Norwegian genebank individuals plus the two Lohmann hybrids amounting to 187 individuals (), as they had a sufficient number of individuals per line for the filtering. Forty-four SNPs had duplicate probe sets reading the same SNP, as they were originally mapped to different locations. For each SNP with duplicate probe sets, 1 random probe set was sampled and the others were removed. Within each line, SNPs and samples with missing call rates above 10% were removed and a Hardy Weinberg equilibrium (HWE) exact test, using the mid p-value (Graffelman and Moreno Citation2013), was performed. SNPs deviating significantly from HWE (p < 0.001) were excluded. The whole data set was subsequently filtered again for missing sample call rates above 10% and missing SNP call rates above 9% to exclude SNPs that had missing call rates above 10% within lines from the whole data set. SNPs with minor allele counts lower than 1 were removed from the data set. Only autosomal SNPs were used in the analyses, thus leading to a data set consisting of 448,723 SNPs and 187 individuals (). This data set, excluding the Lohmann lines, is referred to as the ‘Full Genebank' data set ().
Table 3. Genotyping quality controls performed in PLINK1.9. Filtering was carried out on the lines with >2 individuals per line, i.e. lines from the Norwegian genebank plus the commercial Lohmann lines.
Table 4. Number of lines, individuals and SNPs in the final data sets used in the different analyses.
For the international data set, the SNPs that did not pass the filtering in the Genebank plus Lohmann data set were removed and a final filtering step was carried out for missing call rates above 10%. This yielded a data set of 327 individuals from 80 lines and 448,718 SNPs, referred to as the ‘Full international' data set (). For principal component analysis (PCA) the full international data set was reduced so that all lines had two individuals per line and the SNPs were pruned to a set of SNPs that are in approximate linkage equilibrium with each other, to avoid the strong influence of unequal sampling sizes and SNP clusters. For linkage disequilibrium (LD) pruning, a sliding window size of 50 SNPs, a shift of 5 SNPs per step and an r2 threshold of 0.2 was chosen, so that SNPs in pair-wise comparison within the window that had a squared correlation above 0.2 were greedily pruned. This data set, referred to as ‘LD-pruned 2 per line’, encompassed 133,118 SNPs and 160 individuals. For analysis of genetic structure, an LD-pruned version of the ‘Full Genebank' data set plus the two Lohmann lines was constructed with the same LD-pruning settings, yielding a data set of 42,016 SNPs and 187 individuals. This data set is referred to as ‘LD-pruned Genebank + Lohmann' ().
Genomic relationships
Genomic relationships were estimated with the software Gghat (Theo H. E. Meuwissen, personal communication), based on the following formula presented by VanRaden (Citation2008):
, where M is the matrix with genotype scores, number of alleles of a reference allele (0, 1 or 2) for each individual at each locus, with dimension n (number of individuals) by m (number of loci). P is the corresponding matrix with the expected number of reference alleles, 2 pi. The diagonal of G contains the genomic inbreeding coefficients plus 1, i.e. the genomic inbreeding coefficient F for individual j is measured as:
Genomic relationships were initially estimated using average reference allele frequencies across populations. However, this was abandoned as the results were heavily influenced by the distribution of types of breeds included in the analysis. In the final analysis, reference allele frequencies (pi) were set to 0.5 across all markers.
The heat maps presenting the genomic relationship matrices are created in R (R Core Team Citation2018) with the Heatmaply package (Galili et al. Citation2018). The heatmaply function calculates a distance matrix from the G-matrix following Euclidean distance. The dendrogram clustering follows complete linkage agglomerative hierarchical clustering. The branches are rotated to find the optimal ordering of rows and columns so that the sum of distances between each adjacent sample is minimized (Galili Citation2015).
Contributions to genetic diversity
The core set method as suggested by Eding et al. (Citation2002) was followed to measure the contribution of a genetic line to genetic diversity. The average, minimized coancestry in a set S is calculated as:where G is the n × n matrix containing within and between line average genomic relationships for n lines in set S. Contributions c is an n-dimensional vector that contains the relative contributions of each line to the core set. Contributions are optimized to minimize f(S), referred to as f(S)min. The vector is estimated as:
The core set is constructed so that no lines get negative contributions. The line with the most negative contribution is removed from the core set and the contribution is set to zero. This is repeated until all contributions are equal to or greater than zero. The vector c is restricted so that the elements sum to one.
As the genetic variance within set S is proportional to , the genetic diversity Div(S) is defined as:
Contributions are thus optimized to maximize diversity.
If l is a single line in set S, and is the set of lines where l is excluded
Relative genetic diversity lost if this line is lost from set S is then:
Analysis of genetic structure
Analysis of PCA and Fst values was carried out using R (R Core Team Citation2018) and LD-pruned data sets were employed in order to minimize the effect of ascertainment bias (Malomane et al. Citation2018). PCA was run on the ‘LD-pruned 2 per line’ data set using the R package SNPRelate v.1.12.2 (Zheng et al. Citation2012). Fixation index (Fst) values as a measure of population differentiation, along with 95% confidence intervals and p-values (10,000 bootstraps) between the Genebank and Lohmann lines, were calculated according to Weir and Clark Cockerham (Citation1984) using the R package StAMPP v1.5.1 (Pembleton, Cogan, and Forster Citation2013) based on the ‘LD-pruned Genebank + Lohmann' data set. Subsequently, Splitstree4 v4.14.6 (Huson and Bryant Citation2006) was used to construct a NeighborNet based on the pair-wise population Fst values using ordinary least squares to determine branch length (Bryant and Moulton Citation2002) and visualized using the equal angle method. To investigate population structure, individual ancestries were estimated using ADMIXTURE v1.3 for the ‘LD-pruned Genebank + Lohmann' data set. ADMIXTURE’s cross-validation procedure with default settings was used to identify the number of assumed populations (K) for which the model has the best predictive accuracy. We performed 50 replicate runs for K = 1 to K = 12, with the default optimization method, a block relaxation algorithm, and the default termination criterion of stopping when the log-likelihood increases by less than ε = 10−4 between iterations. CLUMPAK (Kopelman et al. Citation2015) with default settings was used to summarize and visualize the obtained ancestry estimates.
Effective population sizes (Ne) were estimated in SNeP version 1.1 (Barbato et al. Citation2015) for the ‘Full Genebank’ data set. SNeP enables estimation of historical Ne from linkage disequilibrium (LD) with SNP data following the formula by Corbin et al. (Citation2012). SNeP was run with the Haldane recombination rate modifier. Only the markers on chromosome 1–10 were used in this analysis, as the rest of the chromosomes are microchromosomes that have higher recombination rates and lower LD and may not correctly portray Ne derived from LD (Megens et al. Citation2009).
Data availability
The data that support the findings of this study are available from the corresponding author, CB, upon reasonable request.
Results
Genomic relationships
The heatmap with genomic relationships within and between the Norwegian lines () shows two main clusters; Norbrid 7, Norbrid 8, Red Rhode Island and Barred Plymouth Rock, who all lay brown or tinted eggs, forms one cluster and the white egg layers Norbrid 1, Norbrid 4, Rokohøns and Jærhøns forms another cluster. The genomic relationship estimates between the white egg layers, ranging from 0.34 to 0.43, are higher on average than the genomic relationship estimates between the brown egg layers, ranging from 0.24 to 0.38. The mean inbreeding is highest in Jærhøns and the observed heterozygosity is highest in Norbrid 7 ().
Figure 1. Heatmap presenting the 8 × 8 genomic relationship matrix with average genomic relationships within and between the lines at the Norwegian gene bank. A lighter shade reflects higher relationship estimates. The ordering of the lines follows the clustering in the dendrogram.
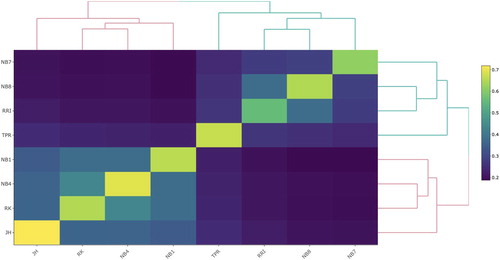
Table 5. Means and standard deviations of the genomic inbreeding coefficient (F) and observed heterozygosity (Ho) within the genetic lines at the genebank.
The heatmap with the genomic relationships within and between the lines in the international data set shows two clear clusters (), where in the first main cluster to the left, all the lines are from breeds which have their roots in chickens that came to Europe from Asia about 3000 years ago (Malomane et al. Citation2019), hereafter referred to as breeds of European origin. Here, most of the lines are white egg layers. Within the first main cluster the four white egg layers from the Norwegian genebank. Norbrid 1, Norbrid 4 and Rokohoens are clustering together with another leghorn line from the Synbreed data set (Malomane et al. Citation2019), Ler11, as well as the Lohmann white egg layer. Jærhøns is in a bigger cluster with other European lines. The second main cluster, to the right, consists of mainly brown egg layers of Asian origin. The three brown egg layers Norbrid 7, Norbrid 8 and Red Rhode Island from the Norwegian genebank are clustering with the Lohmann brown in the small cluster to the right (purple). The Barred Plymouth rock line from the Norwegian genebank is in a bigger (blue) cluster with breeds of Asian origin, including the red jungle fowl ().
Figure 2. Graphic presentation of the matrix containing genomic relationships within and between lines in the International data set. Colour is dependent on the genomic relationship estimate, where a lighter colour towards yellow reflects a higher relationship estimate. The ordering of the lines is decided by the clustering in the dendrogram.
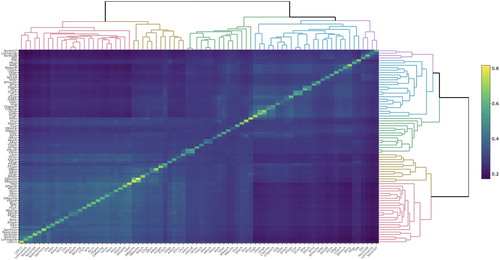
Table 6. Relative loss of genetic diversity when a line is lost from the genebank data set and priority ranking for conservation of genetic diversity.
Contributions to genetic diversity
When comparing the genetic diversity in the gene bank set with all eight lines to the diversity when one line is excluded (), the highest loss in genetic diversity is when Norbrid 7 is lost. Losing Norbrid 4 leads to the lowest relative loss in genetic diversity. When the diversity in the core set constructed from the lines in the international data set excluding the genebank lines was compared to the diversity in the set where one genebank line was added, Norbrid 7 has the highest contribution to genetic diversity. Jærhøns is ranked with the lowest contribution to genetic diversity in this context (). When the contribution to genetic diversity from the genebank lines was measured in the same core set, but excluding the commercial Lohmann lines, Norbrid 8 shifted from being ranked second lowest, to having the second-highest contribution to genetic diversity, after Norbrid 7. Jærhøns has the lowest ranking in this context as well ().
Table 7. The relative gain in genetic diversity when a gene bank line is added to the core set consisting of the international set excluding the genebank lines.
Table 8. The Relative gain in genetic diversity when a gene bank line is added to the core set consisting of the international set excluding the Lohmann and genebank lines.
Table 9. Pair-wise Fst values between 10 chicken lines based on the LD-pruned Genebank + Lohmann data set.
Genetic structure
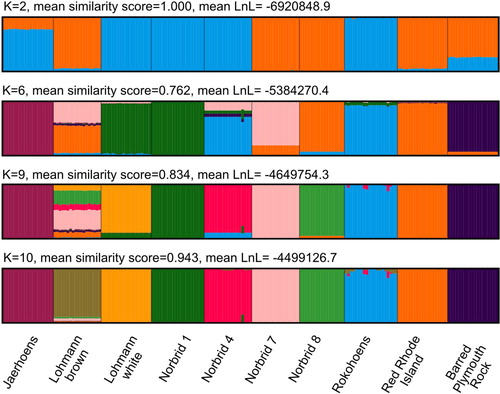
When estimating individual ancestries, a single solution was found among the 50 replicates for K = 2, K = 6, K = 9 and K = 10 (mean similarity score, respectively: 1.00, 0.762, 0.834, 0.943; mean LnL, respectively: −6,920,848.9, −5,384,270.4, −4,649,754.3, −4,499,126.7). For K = 2 to K = 10, almost all individuals of each line, have roughly the same ancestry proportions, such that there are characteristic line-level ancestries. At K = 2, there is roughly a separation of brown from white egg layers. Individuals of the white egg layer Jærhøns have about 22% brown egg layer ancestry and the brown egg layer Barred Plymouth Rock about 26% white egg layer ancestry. At K = 6 and K = 9, there is no obvious biological explanation for the observed ancestries and the mean similarity scores are lower than for K = 2 and K = 10. The cross-validation procedure identified K = 10 as the model with the best predictive accuracy. In this case, the individuals cluster according to the line (). There are a few individuals that have ancestry from more than one cluster. For example, there is one Norbrid 4 individual that has 14% Norbrid 1 ancestry. Similarly, there are six Rokohoens individuals that have some proportion (1–13%) of Norbrid 4 ancestry in addition to very small proportions of Lohmann brown ancestry. Some of these cases could be explained by misidentification of animals in the henhouse and subsequent breeding with these individuals.
Figure 3. Individual ancestry estimates for the eight Norwegian genebank lines and the two commercial crossbred layer lines based on an LD-pruned data set for K=2, 6, 9 and 10. Mean similarity score and mean Log-Likelihood value of the 50 replicate runs is given. Each bar represents an individual and genetic lines, labelled at the bottom, are separated by black lines. Colours correspond to the 2, 6, 9 or 10 different presumed ancestries.
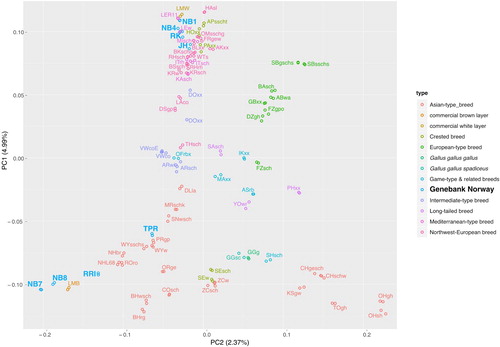
In PCA, the two individuals per line generally clustered together as expected. According to a scree plot the first three components, explaining 9.34% of the total variance in the data, were informative and should be retained (S2). The first two principal components explaining 7.36% of the total variance in the data were plotted against each other in . The brown egg layers Norbrid 7 and Norbrid 8 clustered with the commercial brown egg layer Lohmann brown and were somewhat separated from the other lines on PC2. The white egg layers Norbrid 1 and Norbrid 4 clustered together with the commercial white egg layer Lohmann white, Rokohoens and two Leghorn lines. This cluster was further separated from other lines on PC3, which explains an additional 1.98% of the total variance in the data (see S3). The national breed, Jærhøns, clustered together with other Northwest-European breeds, such as Brakel silver.
Figure 4. Plot of principal component (PC) 1 against PC 2 based on an LD-pruned data set for two individuals of 80 genetic lines. Individuals are coloured according to the type of their breed/line. The Norwegian genebank lines are marked in a separate light blue colour.
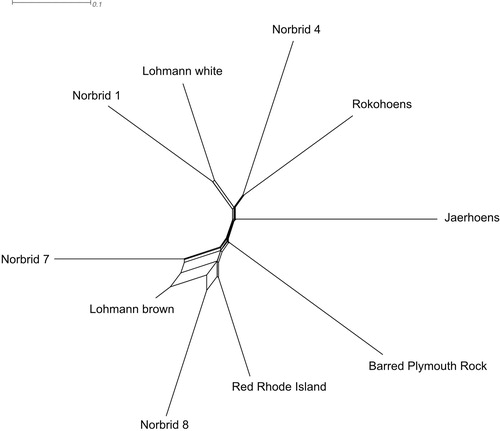
Fst values between the eight genebank lines and the two commercial layers ranged from 0.231 between Norbrid 7 and Lohmann brown and 0.534 between Barred Plymouth Rock and Jærhøns () clearly indicating population differentiation due to genetic substructure. A phylogenetic network based on the Fst values shows that the brown and white egg layers are clearly separated from one another (). The commercial egg layers (Lohmann hybrids) cluster together with the former Norwegian commercial layer lines (Norbrid 1, Norbrid 4, Norbrid 7 and Norbrid 8) with some reticulation, demonstrating that the underlying evolutionary history is not treelike.
Figure 5. NeighborNet of the eight Norwegian genebank lines and the two commercial crossbred layer lines based on population (line) level Fst values. The main split separates white from brown egg layers.
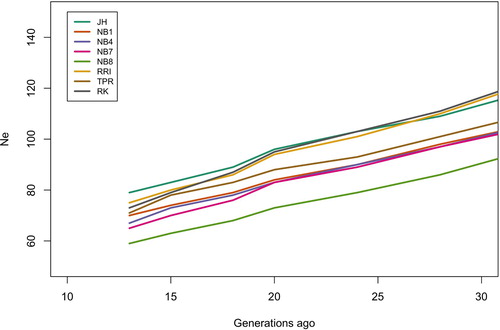
The effective population size estimate was highest in Jaerhoens (). The explanation for this could be that more families have been kept at the genebank for Jaerhoens (30) than for the other lines (23) and therefore the increase in inbreeding is lower. The lowest estimated historical Ne was found for Norbrid 8. The brown egg layers Red Rhode Island and Barred Plymouth Rock had a higher estimated Ne than Jaerhoens 30 generations ago, with a shift at approximately 25 generations ago. The most recent estimates of Ne, 13 generations ago, range from 59 in Norbrid 8–79 in Jaerhoens ().
Discussion
Genomic relationships
A clear genetic distinction between the brown and white egg layers was found in this study, which is in agreement with other studies (Hillel et al. Citation2003; Weigend et al. Citation2014; Malomane et al. Citation2019). Even though brown and white egg layers are bred with similar breeding goals and have similar production qualities, they are clearly genetically distinct. Norbrid 7 is a brown egg layer with white plumage colour that phenotypically is very similar to Norbrid 1, Norbrid 4 and Rokohoens (S5, S6, S7 and S10), but is genetically closer related to many other lines in the study like Silkies black and white and Toutenkou black-breasted red. These are in turn very different to Norbrid 7 when it comes to size, shape and plumage, but also have brown or tinted eggshell colour.
The average inbreeding coefficients F in the Norwegian gene bank lines are high (0.54–0.70). There is probably a slight overestimation due to setting the base allele frequencies to 0.5 when setting up the G-matrix, but this made inbreeding coefficients comparable across lines. A simulation study by Forutan et al (Citation2018) found that estimates of genomic relationships with fixed allele frequencies (p = 0.5) slightly overestimated inbreeding, but that the correlation with true inbreeding was much higher (close to one), than if base allele frequencies were estimated based on the current population. It was important in this study to compare lines to each other. It is also likely that these lines are highly inbred. Both the rather high levels of inbreeding in chicken populations in general and the lower inbreeding in brown egg layers than in white egg layers has also been found in other studies (Hillel et al. Citation2003; Granevitze et al. Citation2007; Muir et al. Citation2008; Groeneveld et al. Citation2010; Weigend et al. Citation2014; Abebe, Mikko, and Johansson Citation2015). The Norwegian landrace was almost extinct at the beginning of the 1900s and the breed is now known as Jærhøns is based on just a few individuals, explaining the high inbreeding in this population. However, a higher number of individuals have been kept at the gene bank for Jærhøns than for the other lines, 30 and 23 families, respectively, each generation, which may explain the higher Ne in Jærhøns than the other gene bank lines ( and 7).
Figure 6. Effective population size estimates 13 generations ago, the most recent generation possible to estimate, for all gene bank lines.
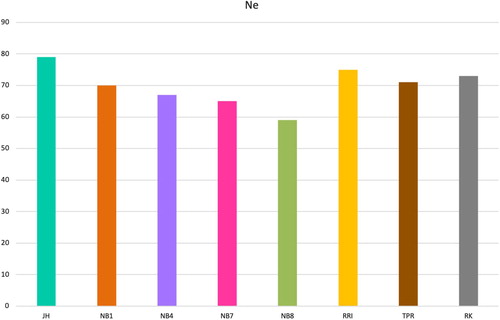
Figure 7. Historical effective population size levels from 30 to 13 generations ago for all the gene bank lines.
Contributions to genetic diversity
Norbrid 7 is should be prioritized for the conservation of genetic diversity both from a national and international perspective, with the highest contribution to genetic diversity in all three scenarios in the analysis of contributions to genetic diversity (). In the scenarios including the international dataset, the ranking is not affected by the relationship between the Norwegian lines, as only one by one line is added to a set excluding the other Norwegian lines.
Norbrid 1, Norbrid 4 and Rokohoens are closely related, explaining why losing one of these lines does not lead to much loss in diversity, as long as the other two lines are still retained in the national scenario (). Norbrid 1 should be prioritized for conservation if only one of the leghorn lines is kept. However, rather than only keeping Norbrid 1, one could also argue that the three Leghorn lines could be merged into one line. This would conserve more genetic diversity than if two lines were lost. However, if possible, all lines should be kept as this also conserves unique genotypes and allele combinations within lines (Eding et al. Citation2002).
Jærhøns is the most inbred of the Norwegian lines and therefore has a low contribution to genetic diversity in a national perspective, and in an international context, it will have a lower contribution to genetic diversity since it is more closely related to the other European lines than any of the other Norwegian lines. However, Jærhøns has a cultural value and should thus have a high priority for conservation in Norway when basing decisions on more criteria (Sæther et al. Citation2018).
When Norwegian lines are added to the core set including the commercial Lohmann lines, Norbrid 8 is ranked number 7, but this ranking jumps up to 2 when the Lohmann lines are excluded. This shows the impact of what is defined as the safe set in these prioritization analyses. One could argue that the commercial breeds are not likely to go extinct, since they are numerous and bred by large resourceful companies. However, if for some reason these breeding programs decide to shut down, the genetic material will not necessarily be available to the public. Especially considering that egg layers and broilers kept by farmers around the world are hybrids of two generations of crossing between pure lines that are hidden from the public (Muir et al. Citation2008). Commercial populations are often overlooked as genetic recourses as they are not threatened by extinction, but national authorities have little to no control over what happens to the commercial populations. This is especially true for chicken, for which most countries do not have a national breeding program. Therefore, having old commercial poultry lines as back-up for unforeseen changes in the global meat production structure may be as important as conserving national landraces.
Perspectives
This study looked at mean genetic diversity across the genome. It may also be of interest to look at diversity in specific areas of the genome. A study on Finnish landrace chicken found substantial diversity in a cluster of genes involved in immune response (Fulton et al. Citation2017). Retaining diversity at such loci could prove valuable in the future as disease and parasite pressures change over time, possibly due to climate change. One could also look at regions around QTLs associated with traits that have undergone strong selection, e.g. in a study by Kerje et al. (Citation2003), a major QTL was found that explained a large part of the differences in body weight and egg weight between the Red Jungle Fowl and the White Leghorn breed. There may be reduced diversity in such areas due to hitch-hiking effects (Smith and Haigh Citation1974). However, one could also argue that conservation decisions should in fact be based on diversity across the genome, as one of the arguments for conserving genetic diversity is that we do not know what traits may be important or desirable in the future.
The prioritization of lines for conservation in this study is purely based on genetic diversity. When making decisions on which lines to prioritize for conservation, there are other parameters that may be equally important. Ruane (Citation2000) suggested the following key criteria for prioritizing between breeds for conservation on a national level: degree of endangerment, presence of traits of current economic value, presence of traits of current scientific value, agro-ecological value in a special landscape, cultural-historical value, as well as genetic uniqueness. Jærhøns also have a historical and cultural value, and although not contributing significantly to overall genetic diversity, may be prioritized for conservation based on other criteria. The results of this study give a first insight into the genetic uniqueness of the Norwegian gene bank lines in a national as well as international context.
Supplemental Material
Download PDF (352.8 KB)Acknowledgements
This work was supported by the Norwegian Genetic Resource Centre. Thanks goes to Mette N. Bjerkestrand at the Live Poultry Genebank and The Lohmann farmers and vet who took samples. We also thank Enrico Razzetti for the use of the server dirtydigitalfields for Fst bootstrapping.
Disclosure statement
No potential conflict of interest was reported by the author(s).
Additional information
Funding
References
- Abebe, A. S., Mikko, S. & Johansson, A. M. (2015). Genetic diversity of five local Swedish chicken breeds detected by microsatellite markers. PLoS ONE 10(4), e0120580. doi: 10.1371/journal.pone.0120580
- Barbato, M., Orozco-terWengel, P., Tapio, M. & Bruford, M. W. (2015). SNep: A tool to estimate trends in recent effective population size trajectories using genome-wide SNP data. Frontiers in Genetics 6(March), doi: 10.3389/fgene.2015.00109
- Bryant D., & Moulton V. (2002). Neighbornet: An agglomerative method for the construction of planar phylogenetic networks. In R. Guigó & D. Gusfield (eds.) Algorithms in Bioinformatics. WABI 2002. Lecture Notes in Computer Science, vol 2452. (Berlin, Heidelberg, Springer).
- Chang, C. C., Chow, C. C., Tellier, L. C., Vattikuti, S., Purcell, S. M. & Lee, J. J. (2015). Second-generation PLINK: Rising to the challenge of larger and richer datasets. GigaScience 4(February), 7. doi: 10.1186/s13742-015-0047-8
- Corbin, L. J., Liu, A. Y. H., Bishop, S. C. & Woolliams, J. A. (2012). Estimation of historical effective population size using linkage disequilibria with marker data: Estimation of effective population size. Journal of Animal Breeding and Genetics 129(4), 257–270. doi: 10.1111/j.1439-0388.2012.01003.x
- Eding, H., Crooijmans, R. P. M. A., Groenen, M. A. M. & Meuwissen, T. H. E. (2002). Assessing the contribution of breeds to genetic diversity in conservation Schemes. Genetics Selection Evolution 34(5), 613–633. doi:10.1051/gse:2002027 doi: 10.1186/1297-9686-34-5-613
- Forutan, M., Mahyari, S. A., Baes, C., Melzer, N., Schenkel, F. S. & Sargolzaei, M. (2018). Inbreeding and runs of Homozygosity before and after genomic selection in North American Holstein Cattle. BMC Genomics 19(1), 98. doi: 10.1186/s12864-018-4453-z
- Fulton, J. E., Berres, M. E., Kantanen, J. & Honkatukia, M. (2017). MHC-B variability within the Finnish landrace chicken conservation program. Poultry Science 96(9), 3026–3030. doi: 10.3382/ps/pex102
- Fumihito, A., Miyake, T., Takada, M., Shingu, R., Endo, T., Gojobori, T., Kondo, N. & Ohno, S. (1996). Monophyletic origin and unique dispersal patterns of domestic fowls. Proceedings of the National Academy of Sciences 93(13), 6792–6795. doi: 10.1073/pnas.93.13.6792
- Galili, T. (2015). Dendextend: An R package for visualizing, adjusting and comparing trees of hierarchical clustering. Bioinformatics 31(22), 3718–3720. doi: 10.1093/bioinformatics/btv428
- Galili, T., O’Callaghan, A., Sidi, J. & Sievert, C. (2018). Heatmaply: An R package for creating interactive cluster heatmaps for online publishing. Bioinformatics 34(9), 1600–1602. doi: 10.1093/bioinformatics/btx657
- Graffelman, J. & Moreno, V. (2013). The mid P-value in exact tests for Hardy-Weinberg equilibrium. Statistical Applications in Genetics and Molecular Biology 12(4), 433–448. doi: 10.1515/sagmb-2012-0039
- Granevitze, Z., Hillel, J., Chen, G. H., Cuc, N. T. K., Feldman, M., Eding, H. & Weigend, S. (2007). Genetic diversity within chicken populations from different continents and management histories: Genetic diversity within chicken populations. Animal Genetics 38(6), 576–583. doi: 10.1111/j.1365-2052.2007.01650.x
- Groeneveld, L. F., Lenstra, J. A., Eding, H., Toro, M. A., Scherf, B., Pilling, D., Negrini, R., et al. (2010). Genetic diversity in farm animals – a review. Animal Genetics 41(May), 6–31. doi: 10.1111/j.1365-2052.2010.02038.x
- Hillel, J., Groenen, M. A. M., Tixier-Boichard, M., Korol, A. B., David, L., Kirzhner, V. M., Burke, T., et al. (2003). Biodiversity of 52 chicken populations assessed by microsatellite typing of DNA pools. Genetics Selection Evolution 35(5), 533–557. doi:10.1051/gse:2003038 doi: 10.1186/1297-9686-35-6-533
- Huson, D. H. & Bryant, D. (2006). Application of phylogenetic networks in evolutionary studies. Molecular Biology and Evolution 23(2), 254–267. doi: 10.1093/molbev/msj030
- Kerje, S., Carlborg, Ö, Jacobsson, L., Schütz, K., Hartmann, C., Jensen, P. & Andersson, L. (2003). The twofold difference in adult size between the red junglefowl and white Leghorn chickens is largely explained by a limited number of QTLs. Animal Genetics 34(4), 264–274. doi: 10.1046/j.1365-2052.2003.01000.x
- Kopelman, N. M., Mayzel, J., Jakobsson, M., Rosenberg, N. A. & Mayrose, I. (2015). Clumpak: A program for identifying clustering modes and packaging population structure inferences across K. Molecular Ecology Resources 15(5), 1179–1191. doi: 10.1111/1755-0998.12387
- Kranis, A., Gheyas, A. A., Boschiero, C., Turner, F., Yu, L., Talbot, R., Pirani, A., et al. (2013). Development of a high density 600 K SNP genotyping array for chicken. BMC Genomics 14, 59. doi: 10.1186/1471-2164-14-59
- Malomane, D. K., Reimer, C., Weigend, S., Weigend, A., Sharifi, A. R. & Simianer, H. (2018). Efficiency of different strategies to mitigate ascertainment bias when using SNP panels in diversity studies. BMC Genomics 19(1), 22. doi: 10.1186/s12864-017-4416-9
- Malomane, D. K., Simianer, H., Weigend, A., Reimer, C., Schmitt, A. O. & Weigend, S. (2019). The SYNBREED chicken diversity panel: A global resource to assess chicken diversity at high genomic resolution. BMC Genomics 20, 1. doi: 10.1186/s12864-019-5727-9
- Megens, H.-J., Crooijmans, R. P., Bastiaansen, J. W., Kerstens, H. H., Coster, A., Jalving, R., Vereijken, A., et al. (2009). Comparison of linkage disequilibrium and haplotype diversity on macro- and microchromosomes in chicken. BMC Genetics 10, 1. doi: 10.1186/1471-2156-10-86
- Muir, W. M., Wong, G. K.-S., Zhang, Y., Wang, J., Groenen, M. A., Crooijmans, R. P., Megens, H.-J., et al. (2008). Genome-wide assessment of worldwide chicken SNP genetic diversity indicates significant absence of rare alleles in commercial breeds. Proceedings of the National Academy of Sciences 105(45), 17312–17317. doi: 10.1073/pnas.0806569105
- Pembleton, L. W., Cogan, N. O. I. & Forster, J. W. (2013). StAMPP: An R package for calculation of genetic differentiation and structure of mixed-ploidy level populations. Molecular Ecology Resources 13(5), 946–952. doi: 10.1111/1755-0998.12129
- R Core Team. (2018). R: A Language and Environment for Statistical Computing (Vienna, Austria: R Foundation for Statistical Computing). Available at: https://www.R-project.org/.
- Ruane, J. (2000). A framework for prioritizing domestic animal breeds for conservation purposes at the national level: A Norwegian case study. Conservation Biology 14(5), 1385–1393. doi: 10.1046/j.1523-1739.2000.99276.x
- Sæther, N., Berg, P., Groeneveld, L. F., Brekke, C. & Kathle, J. (2018). Strategiplan for Genbank for verpehøns 2018-2027. Nibio Rapport 28. Nibio – Norsk Genressurssenter. Available at: https://nibio.brage.unit.no/nibio-xmlui/bitstream/handle/11250/2488879/NIBIO_RAPPORT_2018_4_28.pdf?sequence=1&isAllowed=y.
- Smith, J. M. & Haigh, J. (1974). The hitch-hiking effect of a favourable gene. Genetical Research 23(01), 23–35. doi:10.1017/S0016672300014634
- VanRaden, P. M. (2008). Efficient methods to compute genomic predictions. Journal of Dairy Science 91(11), 4414–4423. doi: 10.3168/jds.2007-0980
- Weigend, S., Janßen-Tapken, U., Erbe, M., Baulain, U., Weigend, A., Sölkner, J. & Simianer, H. (2014). Genome-wide analyses of genetic diversity and phylogenetic relationships in the Synbreed Chicken Diversity Panel. In Proceedings XIV (Stavanger), pp. 164–176.
- Weir, B. S. & Clark Cockerham, C. (1984). Estimating F-Statistics for the analysis of population structure. Evolution 38(6), 1358–1370. doi: 10.2307/2408641
- Zheng, X., Levine, D., Shen, J., Gogarten, S. M., Laurie, C. & Weir, B. S. (2012). A high-performance computing toolset for relatedness and principal component analysis of SNP data. Bioinformatics 28(24), 3326–3328. doi: 10.1093/bioinformatics/bts606