
ABSTRACT
To enable the taste evaluation of many food samples at a time as well as the comparison of taste evaluation data acquired at different times, a standardization method for taste intensities was developed by a combination of a taste sensor system and a standard solution prepared with taste substances. In the case of tomato juices, citric acid, sucrose, and monosodium glutamate were used as standard taste substances for sourness, sweetness, and umami taste, respectively. Each standard point of the taste intensities was determined using only one standard solution including these standard substances. The taste intensity was described as a value on a scale based on discrimination thresholds of human gustation, where intensities of sourness, sweetness, and umami taste of the tomato juices were classified into multiple levels. Organoleptic evaluation supported these results. Validation for the present standardization method revealed that this approach has enough precision for practical tomato taste evaluation.
GRAPHICAL ABSTRACT
Graphical Abstract
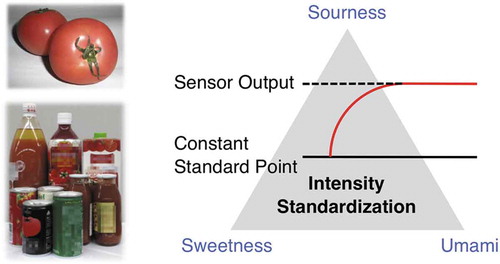
A standard solution prepared with pure chemicals constantly provides high-precision taste sensor outputs.
Taste is one of the most important factors determining food quality and it is a useful communication tool among agricultural producers, food manufacturers, retailers, and consumers. Even though taste is evaluated by the human gustatory sense, it is unrealistic to evaluate a large number of food samples by gustation due to fatigue in the panelists. In recent years, situations requiring taste evaluation for many food samples have increased, for example, to obtain big data important for constructing the supply chain [Citation1]. Furthermore, it is also difficult to compare taste evaluation scores reported by different panel members. Use of a taste sensor or an electronic tongue system is effective as an approach to resolve these problems [Citation2]. For example, a taste sensor system developed by the Toko group is commercially available, which detects intensities of the five basic tastes (sourness, saltiness, bitterness, sweetness, and umami) and astringency as electrical potential changes. This taste sensor system has been widely applied to evaluations of various foods and drinks such as mineral water [Citation3], coffee [Citation4,Citation5], tea [Citation6–10], milk [Citation11], wine [Citation12], beer [Citation13], rice wine [Citation14–16], rice [Citation17], and meat [Citation18,Citation19].
Furthermore, human sensory tests are inadequate for comparing data obtained at different times with each other. However, even the taste sensor approach cannot resolve this problem as long as the tests are conducted in the usual manner, in which a standard point (i.e. a zero point) of sensor outputs is set using food and drink standard samples arbitrarily chosen by each measurer. It is impossible for even the same measurer to prepare an identical standard sample for all taste sensor measurements. If sensor outputs are based on different standard points, there is understandably no logic in comparing them. Previously, to overcome this weakness, we proposed standardization of sensor outputs for evaluating astringent, umami, and bitter taste intensities of teas using standard solutions prepared with the pure chemicals, epigallocatechin-3-O-gallate, monosodium glutamate, and ethyl gallate, respectively [Citation6–10]. These standardized sensor outputs were comparable to one another. In the present study, we further advance this approach toward evaluating sour, sweet, and umami taste intensities of tomato, which is an important agricultural product distributed, marketed, and consumed throughout the world. Significant progress was made in the composition of the standard solutions. In our previous standardization method, the standard solutions for the tea tastes were independently prepared for each taste. Thus, the taste sensor measurements needed to be conducted separately for each taste. In contrast, the new approach standardizes the three taste intensities using only one solution including all standard substances. This manner appears to be the most ideal type of standard solutions due to its efficiency and wide applicability. To our knowledge, this standardization method has not been reported and this is therefore the first challenge for acceptance of this method.
Materials and methods
Materials and apparatuses
Tomato juice and fruit samples were obtained from sellers. Tomato fruit samples including cultivars such as Momotaro York, Zeitaku tomato, and Endeavour RZ were also provided from the Institute of Vegetable and Floriculture Science (NARO) and Niigata Agro-Food University. In addition, these fruit samples differed in cultivation methods (hydroponic and soil cultures) and degree of ripeness. Citric acid monohydrate (purity > 99.5%, Kanto Chemical Co., Inc., Tokyo, Japan), tripotassium citrate monohydrate (purity > 99%, Fujifilm Wako Pure Chemical Corporation, Osaka, Japan), L-glutamic acid monopotassium monohydrate (purity > 97%, Alfa Aesar, Lancashire, UK), and D-(+)-glucose (purity > 98%, Tokyo Chemical Industry Co., Ltd., Tokyo, Japan) were purchased from commercial suppliers. Reagent solutions for taste sensor measurements were purchased from Intelligent Sensor Technology, Inc. (Insent, Kanagawa, Japan).
Taste sensor measurements were conducted with the taste sensing system TS-5000Z (Insent). Brix, electric conductivity, and pH values were measured with a PAL-J (ATAGO Co., Ltd., Tokyo, Japan), a conductivity meter B-771 (HORIBA, Ltd., Kyoto, Japan), and pH meter B-712 (HORIBA, Ltd., Kyoto, Japan), respectively. Ultrapure water was obtained from a Milli-Q Advantage A10 system (Merck KGaA, Darmstadt, Germany).
Preparation of tomato juice samples for taste sensor measurements
Samples for the acid taste measurements were prepared by diluting original tomato juices 2 times with ultrapure water. Samples for the umami taste measurements were prepared by diluting the sample solutions for the acid taste 20 times with aqueous solution including 10 mM potassium chloride (KCl) and 0.10 mM tartaric acid. These dilution processes were necessary to place the sensor outputs into appropriate ranges according to technical information from the Insent web page for users [Citation20]. The sweet taste measurements were conducted using the original juices without dilution. Tomato juices from fruits were prepared by blending them in food processor followed by filtration through disposable non-woven cloth.
Preparation of standard solutions for taste sensor measurements
To a 0.100 M citric acid solution (37.0 mL), 0.100 M tripotassium citrate (13.0 mL) was added, and the solution was diluted to 100 mL with ultrapure water. To this citric acid/tripotassium citrate aq. solution (22 mL), monopotassium glutamate monohydrate (0.234 g) and glucose (1.59 g) were added, and the resulting solution was diluted to 50.0 mL with ultrapure water. This solution was used as a standard solution for the sweet taste measurements. Standard solutions for acid and umami taste measurements were prepared by diluting the original standard solution in the same manner as the corresponding sample solutions.
Measurement of the taste intensity by the taste sensor system
Intensities of sourness, umami taste, and sweetness of sample solutions were measured by the TS-5000Z taste sensor system fitted with sourness, umami, and sweetness sensor probes (CA0, AAE, and GL1 sensors, respectively) and a reference probe. Each taste sensor probe consisted of a lipid/polymer membrane, an Ag/AgCl electrode, and an internal cavity filled with a 3.33 M KCl aqueous solution saturated with AgCl. Each lipid/polymer membrane was prepared with a different chemical composition [Citation21]. The reference probe consisted of a liquid junction made with ceramics, an Ag/AgCl electrode, and an internal cavity filled with a 3.33 M KCl aqueous solution saturated with AgCl.
The sensor measurements were carried out automatically at 25°C. The sensor probe and the reference probe were dipped into the sample solution or the standard solution for 30 s to detect the membrane potential change. The sourness and umami sensor probes were then washed in 30% aqueous ethanol including 0.1 M hydrochloric acid for 90 s, followed by washing in 30 mM KCl aqueous solution including 0.30 mM tartaric acid for 120 s two times. The sweetness sensor probe was washed in 30% aqueous ethanol including 0.01 M potassium hydroxide and 0.1 M KCl for 90 s, followed by washing in 30 mM KCl aqueous solution including 0.30 mM tartaric acid for 120 s two times. The sensor measurements were conducted in order from the standard solution to each tomato juice sample. This procedure was repeated four times.
The taste intensity of the tomato juice sample was defined as an electric potential difference between the tomato juice sample and the standard solution. The sensor output was given by averaging three measured values except the first measurement, which was conducted for stabilizing the sensor response.
Estimated intensity of taste (EIT)
The intensity of taste feeling is proportional to the logarithm of concentration of a taste substance according to Weber-Fechner’s law [Citation22]. In general, humans can discriminate a difference in ca. 1.2 × concentration of a taste substance for the four basic tastes (sourness, sweetness, saltiness, and bitterness) [Citation23]. On the other hand, the discrimination threshold for umami taste is roughly twice as much as the other basic tastes [Citation24]. Therefore, the sensor outputs (electrical potential values) were converted into taste intensity values on a scale where one unit is the sensor output difference corresponding to a 20% concentration difference in taste substances for sourness and sweetness [Citation21], and a 44% concentration difference for umami taste. According to the typical usage of the TS-5000Z taste sensor system, tartaric acid for sourness, monosodium glutamate for umami taste, and glucose for sweetness were used as taste substances. In this paper, these taste intensity values are described as EITsou for sourness, EITuma for umami taste, and EITswe for sweetness, which are calculated by multiplying the sensor outputs by 0.3316, –0.1575, and 0.2351, respectively.
Validation
The precision of the evaluation results by the taste sensor system was assessed by the method of Mizukami et al. according to the International Conference on Harmonization guidelines [Citation25]. To investigate the intraday variations of the measurement results, sample solutions were prepared in triplicate, and these samples were measured on the same day. The relative standard deviation (RSD) was calculated on the basis of the three results. The interday variations were assessed by measuring on three different days with freshly prepared sample solutions in triplicate. The results of the three samples on each day were treated as single data points. The RSD was calculated between days.
Human sensory test for tomato juice samples
Sourness, sweetness, and umami taste intensities of tomato juice samples were evaluated by 10 panelists (9 women and 1 man; ages 21–58 years), who had participated in descriptive sensory analysis of tomato for at least 20 h. Before the human sensory test for the tomato juices, these panelists had reached agreement about 19 sensory attributes for tomato including sourness, sweetness, and umami taste [Citation26]. Sourness, sweetness, and umami taste were defined as basic sensations elicited by carboxylic acids (e.g. acetic acid), some saccharides (e.g. sucrose), and some amino acids or nucleotides (e.g. monosodium glutamate or guanylic acid), respectively. The panel members reached a consensus about the timing for rating each attribute during tasting as follows. Sourness is perceptible just after injection. Umami taste is perceptible for a few seconds after injection and persists after swallowing. On the other hand, sweetness is perceptible soon after injection and until after swallowing.
Samples of 15 mL were prepared in plastic cups with three-digit random codes. For evaluating each taste, the six samples were concurrently provided to each panelist. The tests were conducted sequentially from the most left sample. The panelists were permitted to check their evaluation results again using the remaining samples after rating all tomato juices. The drinking amount was left to the discretion of each panelist. Taste intensity of the sample was rated by marking on a 150 mm non-scaled line with terms indicating taste intensities (weak or strong) at both ends. Evaluation scores were given as the distance from the left end to the mark on the line. The panelists rinsed their mouths with commercially available bottled water before evaluating each sample. The human sensory tests were conducted at individually isolated booths under red light at 23–24°C. A score for each tomato juice was given by averaging the scores by all panelists.
This sensory test is approved for use of human subjects by the institutional review board of the Food Research Institute, NARO.
Human sensory test for umami taste of tomato fruit samples
The umami taste intensities were evaluated by 9 panelists (8 women and 1 man; ages 40–58 years), who were trained in accordance with ISO 8586 guidelines (International Organization for Standardization, 2012) to have abilities to discriminate and describe tomato fruits and tomato products. Furthermore, these panelists had participated in descriptive sensory analysis of tomato for at least 40 h, and had reached agreement about 19 sensory attributes for tomato including umami taste [Citation26]. The definition of umami taste is the same as that for tomato juices.
A tomato sample was cut through the equatorial plane after washing with tap water and wiping with a paper towel, and then the portion including the apex was radially cut into 4–6 pieces. The evaluation was conducted at individually isolated booths under red light at 23–24°C. Two pieces in a white dish with a three-digit random code were sequentially provided as a sample to each panelist. Both pieces were consumed before proceeding to the evaluation for the next sample. The panelists rinsed their mouths with commercially available bottled water before evaluating each sample and were required to put a piece of the samples on their tongue with the equatorial plane down and to compress it between their tongue and palate before mastication. Scoring of umami taste intensity was identical to that for tomato juices described above. A score for each tomato group was given by averaging the scores by all panelists.
This sensory test is approved for use of human subjects by the institutional review board of the Food Research Institute, NARO.
Results and discussion
A standard solution for the sourness, sweetness, and umami taste intensities of tomatoes
Sourness, sweetness, and umami taste were selected as major factors characterizing tomato taste. Therefore, the standard solution consisted of 22.0 mM citric acid for sourness, 177 mM glucose for sweetness, and 23.0 mM monosodium glutamate for umami taste. These concentrations come from 2 × 10 mM citric acid, 83 mM glucose, 94 mM fructose, 17 mM glutamic acid, and 6.0 mM aspartic acid included in a typical tomato fruit [Citation27]. However, this does not mean simply mixing the needed taste substances because it is also necessary to adjust electrical conductivity and pH in the mixed solution to a similar level to those in the tomato samples due to their effects on the sensor electrodes. Electrical conductivity, pH, and Brix values of this standard solution are 3.2 mS/cm, 4.3, and 4.0, respectively. These pH and Brix values are similar to those of commercially available tomato juices and juices prepared from tomato fruits, which had pH 3.8–4.4, Brix 4.5–10.9 for the 38 commercially available juice samples and pH 3.9–4.4, Brix 2.9–10.8 for the 46 fruit samples. On the other hand, the electrical conductivity value of the standard solution is slightly lower than those of the commercially available juice and fruit samples, 5.1–8.8 mS/cm and 4.3–7.3 mS/cm, respectively. However, given the results described below, this difference is not practically a critical problem.
Standardization of the sourness, sweetness, and umami taste intensities
To develop a standardization method of taste intensities using a taste sensor system, reliability of the sensor outputs must be confirmed by human sensory tests because evaluation results by a taste sensor do not always correspond to those by human sense. If tomato fruits themselves are used as samples in the present study, it is difficult to compare sensor outputs with results of organoleptic evaluation using the same samples because there is not enough sample to conduct both taste sensor measurements and human sensory tests. To avoid this problem, commercially available tomato juices were used as samples instead of tomato fruits. Salt-additive tomato juices were not chosen as samples, because the present standardization methods would be applied to evaluation of tomato fruit tastes.
Human taste response is affected by food temperature [Citation28–30]. The taste sensor system may detect this phenomenon in some cases [Citation31]. However, since the present study is aimed at standardizing taste intensities, 25°C was adopted as a measurement temperature in order to prevent a change in the sample concentration during the sensor measurement due to condensation at a low temperature or vaporization of the solvent at a high temperature. In addition, sensing at a high temperature is unsuitable for a standardization method because deterioration of sample quality usually accelerates at higher temperatures.
Sourness, sweetness, and umami taste intensities of the 38 commercially available tomato juices were standardized using the aforementioned standard solution. As shown in , these EIT values were found in the range from – 2.2 to 4.8 for sourness, from 3.4 to 10.8 for sweetness, and from 0.1 to 2.6 for umami taste. The EITsou and EITswe values are over a wide range (7.0 and 7.4, respectively), while EITuma remains in a narrower range of 2.5. This suggests that there is little difference in umami taste intensity among these juice samples. The same tendency was also found in umami taste of the tomato fruit samples, where the EITuma ranges from – 0.58 to 1.47.
Figure 1. EIT values of 38 tomato juices: (a) sourness, (b) sweetness, and (c) umami taste

Validation
The precision of the evaluation results obtained using the taste sensor system was assessed by the RSD of the sensor outputs (electrical potential changes). The RSD values were 1.1% (intraday) and 2.1% (interday) for the sourness sensor outputs, 2.7% (intraday) and 5.5% (interday) for the sweetness sensor outputs, and 1.7% (intraday) and 2.9% (interday) for the umami taste sensor outputs. Electric potential differences of one unit in the EITsou, EITswe, and EITuma scales are 3.01, 4.25, and 6.35 mV, respectively. Therefore, these results show that the EITsou, EITswe, and EITuma values ensure enough precision because they are within one unit on the EIT scale.
Correlation between the EIT values and the human gustatory sense
The EIT values were compared with the results based on human sense. Groups of six samples were prepared for each sourness, sweetness, and umami taste. The EITsou values correlated highly with human sense ( (a), linear correlation coefficient = 0.92). The EITswe values also showed comparatively good correlation with human sense ( (b), linear correlation coefficient = 0.74). On the other hand, it was difficult to assess the EITuma values from the organoleptic evaluation results because (c) shows that the panelists were unable to sufficiently discriminate umami taste intensities of the samples. As shown in , a similar tendency was also found in the human sensory tests for the tomato fruit samples. However, these results of the human sensory tests appear to be related to the small EITuma ranges of both tomato juice and fruit samples. Due to the small difference in the umami taste intensities of the samples, there is a possibility that the organoleptic scores for all samples converged within a narrow range. This suggests that the results of the human sensory test concerning umami taste also support the validity of the EITuma values. Therefore, the taste sensor might possibly provide a certain level of indication for the slight umami taste difference in tomato that humans cannot accurately discriminate.
Figure 2. Relationship between EIT values and organoleptic scores in the commercially available tomato juice samples: (a) sourness, (b) sweetness, and (c) umami taste. The error bars indicate standard deviations. The numbers indicated in the graphs correspond to the sample numbers shown in Figure 1

Figure 3. Organoleptic scores of umami taste intensities of tomato fruit samples. The error bars indicate standard deviations

In conclusion, this study demonstrated a method for standardizing sourness, sweetness, and umami taste intensities of tomato juices using a taste sensor system, in which the standard point was established by a standard solution prepared from the three taste substances corresponding to each taste, not by a food arbitrarily chosen as a standard sample. Since this method constantly provides sensor outputs based on the same standard point, it enables the comparison of many evaluation data regardless of the time when the data were obtained. In most taste sensor measurements, multiple sensor probes are simultaneously used to give the corresponding plural taste information. Therefore, use of a standard solution including all needed standard substances reduces effort and expense for the measurements. We believe that this standardization approach can be applied to evaluate various other food tastes or studies on tastes due to its efficiency and wide applicability.
Author contributions
N. H. conceived the project and wrote the manuscript. N. H. and T. U. designed and conducted the taste sensor experiments, and analyzed the data. F. H. and Y. N. performed the human sensory tests. T. K. and H. I. analyzed the taste sensor data.
Acknowledgments
We acknowledge Hiroko Tsutsumi (NARO) for sample preparation, Yuka Nakano (NARO), and Tiejun Zhao (Niigata Agro-Food University) for provision of tomato fruit samples, and the panelists for the human sensory tests.
Disclosure statement
No potential conflict of interest was reported by the authors.
Additional information
Funding
References
- Guojin J, Hu L, Tan KH. A study on decision-making of food supply chain based on big data. J Syst Sci Syst Eng. 2017;26(2):183–198.
- Ha D, Sun Q, Su K, et al. Recent achievements in electronic tongue and bioelectronic tongue as taste sensors. Sens Actuator B-Chem. 2015;207:1136–1146.
- Taniguchi A, Naito Y, Maeda N, et al. Development of a monitoring system for water quality using a taste sensor. Sens Mater. 1999;11:437–446.
- Ishiwaki T. Application of taste sensor to blending of coffee. In: Toko K, editor. Biochemical Sensors: mimicking Gustatory and Olfactory Senses. Singapore: Pan Stanford Publishing; 2013. p. 83–90.
- Fukunaga T, Toko K, Mori S, et al. Quantification of taste of coffee using sensor with global selectivity. Sens Mater. 1996;8:47–56.
- Hayashi N, Chen R, Ikezaki H, et al. Techniques for universal evaluation of astringency of green tea infusion by the use of a taste sensor system. Biosci Biotechnol Biochem. 2006;70(3):626–631.
- Hayashi N, Chen R, Ikezaki H, et al. Evaluation of the astringency of black tea by a taste sensor system: scope and limitation. Biosci Biotechnol Biochem. 2007;71(2):587–589.
- Hayashi N, Chen R, Ikezak H, et al. Evaluation of the umami taste intensity of green tea by a taste sensor. J Agric Food Chem. 2008;56(16):7384–7387.
- Hayashi N, Ujihara T, Chen R, et al. Objective evaluation methods for the bitter and astringent taste intensities of black and oolong teas by a taste sensor. Food Res Int. 2013;53(2):816–821.
- Ujihara T, Hayashi N, Ikezaki H. Objective evaluation of astringent and umami Taste intensities of matcha using a taste sensor system. Food Sci Technol Res. 2013;19(6):1099–1105.
- Mizota Y, Matsui H, Ikeda M, et al. Flavor evaluation of UHT reconstituted milk processed by direct and indirect heat treatment using sensors. Sens Mater. 2008;20:243–253.
- Fujita A, Isogai A, Endo M, et al. Effects of sulfur dioxide on formation of Fishy off-order and undesirable taste in wine consumed with seafood. J Agric Food Chem. 2010;58(7):4414–4420.
- Toko K, Tahara Y. Beer analysis using an electronic tongue. In: MLR M, editor. Electronic Noses and Tongues in Food Science. Amsterdam: Elsevier; 2016. p. 161–170.
- Arikawa Y, Toko K, Ikezaki H, et al. Analysis of sake mash using multichannel taste sensor. J Ferment Bioeng. 1996;82(4):371–376.
- Hashizume K, Ito T, Shimohashi M, et al. Ferulic acid and ethyl ferulate in sake: comparison of levels between sake and mirin and analysis of their sensory properties. Food Sci Technol Res. 2013;19(4):705–709.
- Wei Z, Wang J, Cui S, et al. Determination of the flavours and marked ages of rice wines using a taste sensing system combined with the Weber–Fechner law and chemometric methods. Anal Methods. 2016;8(33):6361–6371.
- Tran TU, Suzuki K, Okadome H, et al. Analysis of the tastes of brown rice and milled rice with different milling yields using a taste sensing system. Food Chem. 2004;88(4):557–566.
- Chikuni K, Oe M, Sasaki K, et al. Effects of muscle type on beef taste-traits assessed by an electric sensing system. Anim Sci J. 2010;81(5):600–605.
- Nodake K, Numata M, Kosai K, et al. Evaluation of changes in the taste of cooked meat products during curing using an artificial taste sensor. Anim Sci J. 2013;84(8):613–621.
- Information about an umami taste sensor (AAE sensor) problem [Internet]. Atsugi (Japan): Intelligent Sensor Technology, Inc. [cited 2020 Jun 25]. Available from: https://sites.google.com/a/insent.co.jp/sample-top/aae-sensor
- Kobayashi Y, Habara M, Ikezaki H, et al. Advanced taste sensors based on artificial lipids with global selectivity to basic taste qualities and high correlation to sensory scores. Sensors. 2010;10(4):3411–3443.
- Schutz HG, Pilgrim FJ. Differential sensitivity in gustation. J Exp Psychol. 1957;54(1):41–48.
- Pfaffmann C. The sense of taste. In: Field J, editor. Handbook of Physiology. Vol. 1. Washington DC: American Physiological Society; 1959. p. 507–533.
- Yamaguchi S, Kimizuka A. Psychometric studies on the taste of monosodium glutamate. In: Filer LJ, Garattini S, Kare MR, et al., editors. Glutamic Acid: advances in Biochemistry and Physiology. New York: Raven Press; 1979. p. 35–54.
- Mizukami Y, Sawai Y, Yamaguchi Y. Simultaneous analysis of catechins, gallic acid, strictinin, and purine alkaloids in green tea by using catechol as an internal standard. J Agric Food Chem. 2007;55(13):4957–4964.
- Hayakawa F, Ando A, Kazami Y, et al. Multiple evaluation of flavor and texture in tomatoes produced under long-term hydroponic culture that identifies the differences among cultivars and harvest periods. J Jpn Soc Food Sci Technol (Nippon Shokuhin Kagaku Kogaku Kaishi). 2019;66(11):408–419.
- Standard Table of Food Composition in Japan-2015. (seventh revised version) [Internet]. Tokyo (Japan): Ministry of education, culture, sports, science, and technology-Japan; 2015 [cited 2020 Jun 25]. Available from: https://www.mext.go.jp/en/policy/science_technology/policy/title01/detail01/1374030.htm.
- McBurney DH, Collings VB, Glanz LM. Temperature dependence of human taste responses. Physiol Behav. 1973;11(1):89–94.
- Green BG, Alvarado C, Andrew K, et al. The effect of temperature on umami taste. Chem Senses. 2016;41(6):537–545.
- Ben-Arie R, Sonego L. Temperature affects astringency removal and recurrence in persimmon. J Food Sci. 1993;58(6):1397–1400.
- Ikezaki H. Visualization of taste to connect the world: principle and application of taste sensor. Jpn J Sens Eval. 2017;21:2–13.