
 ?Mathematical formulae have been encoded as MathML and are displayed in this HTML version using MathJax in order to improve their display. Uncheck the box to turn MathJax off. This feature requires Javascript. Click on a formula to zoom.
ABSTRACT
Diversity in retail and facilities is essential for creating proximity environments. Most analyses have focused on either built environment predictors or the balance between diversity and social vulnerability and tourism, but little is known of their interrelationship. Using georeferenced data of retail and facilities in Barcelona (Spain), the study shows that diversity is positively associated with compact and dense environments, but negatively related to social vulnerability and tourist accommodation. Five clusters were studied based on retail diversity, urban vulnerability, and tourist intensity. Some areas may be endangered by the overrepresentation of specific activities. These insights can inform activity diversification policies.
Introduction
Creating vital and liveable cities has become a priority in the urban agenda. In particular, the concept of urban diversity has been labelled by some authors as a crucial feature for the sustainability and resilience of cities. Thriving urban spaces require a certain diversity of retail and facilities in a proximate environment to ensure access to a wide range of daily activities by means of active modes of transportation. The availability of a diverse environment of retail and facilities close to home allows for shorter trips, and enables walking and biking for utilitarian transportation, thereby reducing car dependency. At the social level, urban environments that host a diversity of retail and facilities (i.e., health centres, sport centres, cultural centres, schools, etc.) also contribute to the creation of more democratic and equitable cities (Connolly Citation2018), as the location of a diversity of functions throughout the city ensures equitable access to a range of activities for all individuals (Miralles-Guasch and Marquet Citation2013).
In recent years, a number of initiatives have sought to promote diversity of retail and facility infrastructure, under different branding; the ‘X-minute city’ in cities like Paris, Barcelona, Portland, or Melbourne (Moreno et al. Citation2021; Victoria State Government Citation2020), the ‘Close-knit city’ in Gothenburg (City of Gothenburg Citation2014), the so-called ׅ‘care blocks’ in Bogotá (Gobierno de Bogotá Citation2021) and ‘superblocks’ in Barcelona (Àrea Ecologia Urbana, and Barcelona Regional Citation2023). All these initiatives share the common goal of improving daily lives of individuals, by improving access to daily activities within a proximity radius, thereby increasing convenience and saving time.
The interest in the diversity of retail and facility activities has been also reflected in the academic literature, considering that a significant body of research exists on the subject. Traditionally, the diversity has been studied using land-use-based indicators at the city, district, or neighbourhood levels (Dovey and Pafka Citation2017). While these contributions are valuable to understand city-level patterns, they are limited in their ability to clearly depict how diversity refers to these patterns, and what type of specific activities they are composed of. In fact, according to the principles of Jane Jacobs, the proper scale with which to understand diversity is at the neighbourhood and street levels (Perrone Citation2019). In this sense, in recent years several studies have aimed to understand how this diversity operates at a more detailed scale, which at the same time has been supported by the increase in the availability of georeferenced data (Kang Citation2020; He et al. Citation2018; Wang and Niu Citation2019).
One of the ways in which diversity has been studied at the street-level scale is through the use of georeferenced point data on urban retail and day-to-day facilities and services (Yoshimura, Kumakoshi, et al. Citation2021). Such an approach has been employed in a considerable number of previous studies, which have focused on investigating the factors associated with diversity of activities, by examining their relationship with certain built environment characteristics (Cui et al. Citation2016). Overall, it is often observed that higher levels of retail and facility diversity are correlated with higher population density, closer proximity to public transportation, central areas, and larger cities, although variations in these relationships may be observed depending on the specific urban context (Kumakoshi, Koizumi, and Yoshimura Citation2021;Yoshimura, Santi, et al. Citation2021).
Other researchers have explored the ways in which retail and facility diversity are associated with specific socioeconomic characteristics and social phenomena (Anguelovski Citation2015; Fernández-Escobar et al. Citation2022; Reese Citation2019; Shenjing Citation2015), with particular emphasis on the impact of socioeconomic vulnerabilities of neighbourhoods, and the presence of tourism as one of the most affecting factors. The common goal here has been understanding whether retail diversity is affected by underlying dynamics of gentrification/vulnerability, or whether the touristification of areas has a detrimental effect on the diversity of available retail. Regarding the socioeconomic dimension, for instance, some studies indicate that area median income (AMI) levels are a key factor in accessing a healthy food supply (Bridle-Fitzpatrick Citation2015; Londoño-Cañola et al. Citation2023). With regards to tourism, it is acknowledged that it influences local retail dynamics and the location of activities in many cities, as previous studies have demonstrated a transformation of commercial structures to satisfy the needs of tourists (Ananian, Perras, and Borde Citation2018; Blázquez-Salom et al. Citation2019).
Despite the relevance of these contributions, two issues that require additional investigation are identified. One such gap in the literature corresponds to the lack of attention paid to the combined effects of both the built environment and socioeconomic factors on retail and facility diversity levels. While some studies have examined these dimensions separately, the relationship between these two combined dimensions and their influence on different levels of diversity remains largely understudied. A second gap in the literature refers to the relationship between socioeconomic vulnerability and tourism with the spatial distribution of retail and facility activities. Previous studies have focused primarily on specific retail categories or facilities, mostly regarding food retail (Garcia, Garcia-Sierra, and Domene Citation2020; Goossensen et al. Citation2023; Gómez-Varo, Delclòs-Alió, and Miralles-Guasch Citation2021) and leisure activities (Cui et al. Citation2016), while there is limited evidence on the broader landscape of retail and facility activities in urban areas.
Addressing these gaps in the literature is crucial for developing a more nuanced understanding of the factors that drive diversity of retail and facilities in urban areas, and informing policies that promote inclusive and equitable urban environments. As the significance of diverse retail and facility environments for urban well-being and social sustainability becomes more evident, it becomes increasingly important to understand how these diversity dynamics interact with other underlying dynamics in the city. Therefore, this paper aims to investigate two main research questions: 1) What built environment characteristics and social factors are related with higher diversity of retail activities and facilities? 2) Which types of specific retail and facilities are found in contexts with different diversity levels, socioeconomic vulnerability, and tourism presence levels.
Methods
Study area
This study is set in the urban area of the City of Barcelona (situated in the province of Barcelona, Catalonia region, NE Spain). As study area the city conurbation is selected, defined as the municipalities that share an urban continuum, which includes the Municipality of Barcelona as well nine surrounding municipalities (). With an area of 190 km2 and a population of approximately 2.5 million (1.6 million of whom reside in the City of Barcelona), the conurbation of Barcelona is one of the largest metropolitan areas in Southern Europe. Barcelona presents an interesting urban context, with which to explore the topic of diversity due to its compact and dense urban form, as well as a widely extended and decentralized commercial retail and infrastructure network. Additionally, the City of Barcelona serves as a global reference for issues related to tourism, which have been argued to impact the city’s uses, infrastructure, and commercial networks (Frago Citation2021). The concentration of particular activities in specific areas, leading to a decrease in diversity, has been a topic of ongoing debate in the city in recent years, and continues to be relevant today (Betevé Citation2023). In this regard, the Barcelona City Council has enacted policies to regulate tourist activity, including the implementation of the Special Urban Plan for Tourist Accommodation (PEUAT), that limits new hotel licences within the city centre and prohibits new licences for tourist apartments, with the primary objectives of prioritizing the right to housing for local residents, and maintaining a balanced mix of social uses (Ajuntament de Barcelona Citation2017b).
Figure 1. Study area: the conurbation of Barcelona and its different urban shapes.
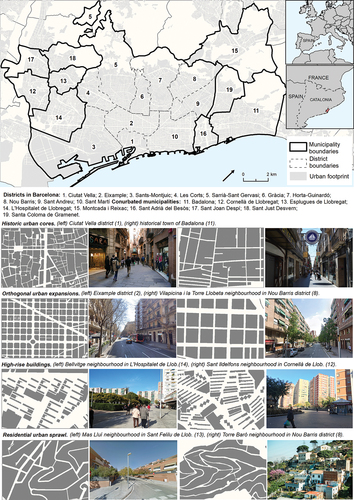
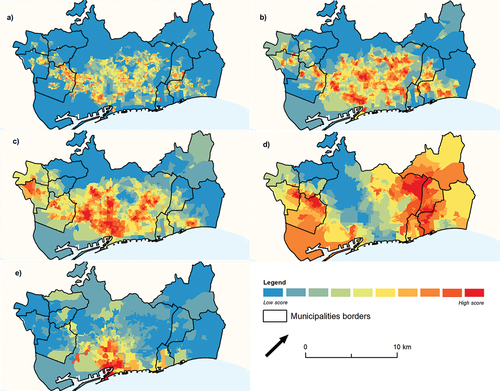
The conurbation of Barcelona is characterized by a significant heterogeneity in both its built environment as well as in its socioeconomic characteristics (). Its urban form features a diversity of urban structures, such as historical towns, orthogonal expansions, high-rise housing projects, and residential urban sprawl areas. This results in different levels of population density () and contact opportunity (). In terms of mobility, the conurbation of Barcelona is well-connected by a highly frequent public transportation system with varying levels of accessibility (). The conurbation also presents a socioeconomically diverse composition, with a population that has a varying socioeconomic status and various levels of vulnerability (). These urban realities partially interact in space with tourist flows, which tend to concentrate in the historical neighbourhoods of the city centre, but are also increasingly spreading to less central areas ().
Figure 2. Built environment and socioeconomic characteristics of the study area: a) population density, b) contact opportunity, c) accessibility, d) urban vulnerability, e) concentration of tourist accommodations.
For the analysis, census tracts as spatial units were used. However, for the visual representation of the data, the study area was divided into 19 subareas that are approximately equal in size and correspond to the districts within the City of Barcelona and its surrounding municipalities.
Outcomes: retail and facility data
To analyse diversity, data from retail venues and day-to-day facilities were used. The study utilizes the ground-level retail inventory of the City of Barcelona (Opendata BCN Citation2019), which has been used extensively in previous studies (Anguera-Torrell and Cerdan Citation2021; Crosas and Gómez-Escoda Citation2020; Garcia, Garcia-Sierra, and Domene Citation2020; Gomez-Escoda, Crosas Armengol, and Berra-Sandin Citation2022; Goossensen et al. Citation2023; Londoño-Cañola et al. Citation2023; Morcuende and Lloberas Citation2022). However, a methodological gap does exist in the City of Barcelona, as previous research has only considered the administrative city boundaries and does not take into account the actual city, which includes the adjacent municipalities. In order to fill this gap, various databases were merged to cover the conurbation of Barcelona. For the adjacent municipalities, the Census of Commercial Establishments of Catalonia was used (Camerdata Citation2020). Additionally, this study also uses the facility dataset of the Metropolitan Area of Barcelona (AMB Citation2019) to obtain the location of day-to-day facilities such as health providers, cultural venues, and education centres, which were not present in the Camerdata (Citation2020) dataset. To merge the three databases, there were only activities that were comparable across all municipalities in the conurbation were considered, resulting in a total of 17 categories: health and social assistance, education, food retail, convenience goods (non-food), personal services, personal equipment, household equipment, repairing, cleaning and maintenance services, cultural facilities, sports, leisure, restaurant and bars, finance, real estate, motor vehicle goods and services, and others. The reclassification of these categories drew inspiration from previous works conducted within the Barcelona context (Porta et al. Citation2012; Yoshimura, Kumakoshi, et al. Citation2021). For further information on the disaggregated categories of retail venues and facilities, refer to Table S1 in the supplemental data online.
This data diversity was measured by means of the Commercial and Facility Mix (CFMIX) index (), which is an adaptation of traditional measures of entropy, such as those used to describe land-use mix (Frank et al. Citation2010). This indicator was calculated at the census tract level, based on the 17 categories, extracted from the retail and facility activities datasets, and described by the following expression:
Table 1. Summary of the data.
where pi refers to the proportion of the activity type i in the census tract considering all activities, and n is the total number of activity types. The proportion of each retail and facility activity per census tract was calculated (), as follows:
Where n refers to the number of venues of a certain type of activity, and N refers to the total number of venues.
Covariates: built environment and socioeconomic characteristics
To analyse the factors that influence diversity, the study collected data on the characteristics of the built environment, as well as the socioeconomic characteristics of the spatial units in the study area. Considering the different spatial resolution of each variable, they were rescaled at the census tract level using the Spatial Join tool of ArcGisPro software (ESRI), under different calculation rules ().
As built environment characteristics the commercial ratio, population density, accessibility and an indicator of contact opportunity were included. The commercial ratio was calculated using the Municipal cadastre (2017), originally provided at a building level, indicating the proportion of commercial use within the total built surface area. The net population density indicates the number of inhabitants per km2, which was extracted from the Georeferenced population of the Catalonia database (2016) and calculated for a quadtree grid, with a maximum resolution of 62.5 m and a minimum threshold of 17 inhabitants. Based on the previous work of Gómez-Varo, Delclòs-Alió, and Miralles-Guasch (Citation2022) on the assessment of urban vitality in Barcelona, accessibility and contact opportunity indicators were extracted. They have been originally calculated for a 100 × 100 m grid and are expressed in z-score values. The accessibility indicator is composed of variables about spatial access to the public transport network, as well as pedestrian-oriented street design (i.e., street lightning, traffic-calmed areas). The contact opportunity indicator measures street network characteristics (i.e., intersections, presence of meeting points) and microelements of the built environment (i.e., the presence of benches) that encourage human interactions.
Regarding the area-level socioeconomic characteristics, a measure of urban vulnerability and the proportion of tourist accommodation in each census tract were included. The Index of Urban Vulnerability (IUV), developed by the Institute of Regional and Metropolitan Studies of Barcelona (Antón-Alonso and Porcel Citation2021), was utilized to gauge urban vulnerability. The IUV comprises measures of social and residential exclusion and their related effects. It expresses values on a scale of 1 to 10 (from less to more vulnerable) and was initially calculated for the spatial unit of Metropolitan Statistical Areas (MSA), which are considered sub-city territorial units of reference in the metropolitan area of Barcelona. A housing-related indicator was employed as as a proxy to assess tourism pressure, considering its significant impact on urban fabric in terms of housing market inflation and the influx of floating population into neighbourhoods (Cocola-Gant Citation2018). Specifically, the variable ‘proportion of tourist accommodation’, which represents the percentage of tourist accommodation units in relation to the total number of housing units, was utilized. This variable was derived from georeferenced data sourced from the measurement of the number of tourist dwellings in Spain and their capacity (INE Citation2020). The original calculations were performed at the census tract level.
The distribution of all variables after their calculation at a census tract level is found in Table S2 in the supplemental data online
Analysis
The analysis undertaken in this research followed three main steps. The first step of the analysis aimed to understand the association between retail and facility diversity and the characteristics of the built environment, as well as area-level socioeconomic factors. To do this, Diversity was used as the dependent variable, and built environment and socio-economic characteristics were used as independent variables. The explanatory variables were scaled prior to regression modelling. Given the nature of the dependent variable, which was bounded between 0 and 1 and had a concentration of values at the extremes, the analysis uses a generalized linear model with a binomial distribution and a logistic link function.
For the second step, the study examines what the diversity was composed of, in terms of the proportion of the different retail and facility activities within neighbourhoods, and in relation to different levels of diversity and socioeconomic realities. Census tracts were classified based on their diversity score (CMIX), their vulnerability score, and the proportion of tourist accommodation, by means of a Multivariate Analysis Cluster. To do so, the ArcGisPro tool was employed, which is based on the K-Means algorithm to create clusters with similar features. This tool was used to generate a mean centre for each group. The number of clusters was determined by applying the silhouette method to the data, which produced an F-statistic score that indicated 4 as the optimal number of clusters (F-statistic = 0.453), as shown in Table S3 in the supplemental data online. However, 5 clusters (F-statistic = 0.425) were selected since it was observed that some census tracts had extremely high values for the proportion of tourist accommodation. An additional cluster allowed to distinguish these areas where the proportion of tourist accommodation was significantly higher. Furthermore, the results did not vary significantly in comparison to the score for 4 clusters.
Finally, the third step aimed to explore the specific retail and facility activities of each cluster. To do so, the mean of the proportion of each activity type was calculated per cluster group and compared these metrics using an ANOVA test. Data analysis was conducted using SPSS software (IBM).
Results
The association between diversity, built environment, and socioeconomic characteristics
Initially, an analysis was conducted to examine how areas with high diversity scores are associated with specific built environment and socioeconomic attributes (). Regarding the variables of built environment, a strong positive relationship was found between diversity and contact opportunity (0.901), commercial ratio (0.743), and population density (0.161). With regards to accessibility, the analysis revealed a positive association with diversity (β = 0.224); however, the effect was weak and not statistically significant. In terms of the socioeconomic variables, the results showed that urban vulnerability (β = −0.128) and presence of tourist accommodation (β = −0.111) were negatively associated with diversity. Of the two, only urban vulnerability exhibited a statistically significant relationship with diversity.
Table 2. Generalized linear model regression (binomial distribution and a logistic link) of the retail and facility mix score.
Territorial clustering based on diversity levels and socioeconomic characteristics
Based on the diversity, vulnerability, and proportion of tourist accommodation scores of the census tracts within the study area (n = 1666), 5 distinct clusters were obtained ( and ). To further develop the analysis, the mean proportion of each activity type was calculated in relation to the total activities for the study area overall, and these values were compared across different cluster types using an ANOVA test with a p-value indicator ().
Figure 3. Clusters according to diversity, vulnerability, and proportion of tourist accommodation scores.
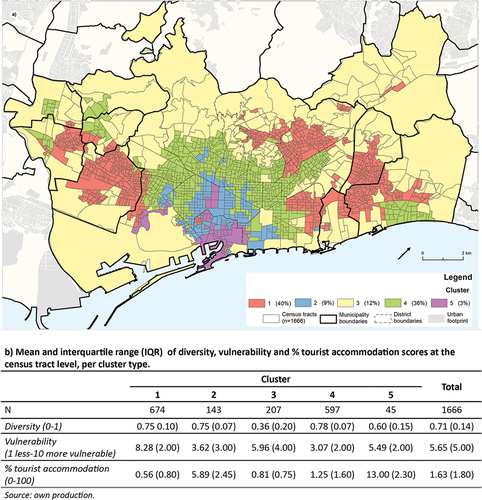
Table 3. Summary of clusters.
Table 4. Proportion (%) of retail and facility activities, per cluster.
Overall, the Barcelona conurbation exhibits a high diversity score (0.71), an intermediate level of vulnerability (5.65), and a low presence of tourist accommodation (1.63). The study area is characterized primarily by the presence of restaurants and bars (21.49%), convenience food retail services (15.42%), and personal services (10.17%). A group of activity types, including education (6.54%), health and social assistance (6.1%), convenience goods (5.47%), and household equipment (5.13%), follow with a proportion in the range of 5–7%, representing basic services and equipment. The remaining categories have a proportion in the range of 1–4%. However, the score variables and the proportion of activity types vary depending on the cluster, as explained below.
First, covering the 40% of the census tracts (n = 674), Cluster 1 presents high values of diversity (0.75) and vulnerability (8.28), and a low proportion of tourist accommodation (0.56). Regarding the proportion of each retail and facility activity, Cluster 1 is characterized by higher percentages than the overall mean in the categories of convenience food retail (18.44%), personal services (11.17%), cleaning services (2.79%), and real estate agencies (4.3%). In contrast, personal equipment (4.71%), sports (0.91), and leisure (1.76%) have relatively lower values than the overall mean. Census tracts of this cluster are mainly placed in conurbated municipalities, while they are also represented in some peripheral areas of Barcelona. They correspond to adjacent towns of L’Hospitalet de Llobregat (14), Cornellà de Llobregat (12), Santa Coloma de Gramenet (19), and the Northwestern parts of Sant Adrià del Besòs (16) and Badalona (11). Regarding the spots within the City of Barcelona, they are mostly located in the peripheral neighbourhoods of the east of Sant Martí (10), Horta-Guinardó (7) and Nou Barris (8), although a small group of 3 census tracts were also found in the historical area of Barcelona, in the Raval neighbourhood of the Ciutat Vella district (1).
Second, composed by 9% of the census tracts (n = 143), cluster 2 is defined by high values of diversity (0.75), but low values of vulnerability (3.62) and a moderate proportion of tourist accommodation (5.89). This cluster stands out for the categories that have a proportion higher than the overall mean. These categories include bars and restaurants (29.07%), leisure (4.12%), personal equipment (8.44%), and household equipment (5.73%). However, the remaining categories have values that fall below the overall mean, and among them, health and social assistance (4.56%), education (4.14%), repairing (2.78%), and cleaning services (0.38%) are notable. This cluster covers the most part of the central neighbourhoods of the Eixample district (2), the western parts of the historical core of Ciutat Vella district (1), and the historical cores of Sants-Montjuïc district (3) and Poble Nou neighbourhood in Sant Martí district (10).
Cluster 3, representing 12% of the census tracts (n = 207), conversely, has a low score on diversity, and presents moderate vulnerability (5.96) and low presence of tourist accommodations (0.81). Regarding the weight of the different activity types in this cluster, those types with a prominent proportion above the overall mean include basic services such as health and social assistance (8.42%) and education (12.74%), as well as cultural and sport facilities (7.02% and 2.86%, respectively), and real estate agencies (5.15%). Conversely, notable below the overall mean are the proportion of convenience food retail (11.23%), personal services, and equipment (5.38% and 2.71%, respectively), and the leisure category (1.19%). The census tracts of this cluster mainly correspond to the limiting areas of the conurbation, bordering natural boundaries such as the mountains and rivers, although some spots are also found within the urban fabric. They correspond to certain spaces on the seafront, and locations where large transport infrastructures are found, as well as some industrial areas and large parks.
Cluster 4 covers 36% of the census tracts (n = 597) and is characterized by high values of diversity, low values of vulnerability (3.07), and a moderate proportion of tourist accommodation (1.25). This cluster covers areas found mostly in the City of Barcelona, forming a ring that starts in the limiting census tracts of Eixample district (2) and expands to certain areas of its contiguous districts, such as Les Corts (4), Sarrià-Sant Gervasi (5), Gràcia (6), Horta-Guinardó (7), and some areas of Sant Andreu (9), and Sant Martí (10). Additionally, census tracts belonging to this cluster were also found in the coastal areas of Badalona (11), in the central part of Sant Joan Despí (17) and Sant Just Desvern (18), and in some neighbourhoods of Cornellà de Llobregat (12) and Sant Feliu de Llobregat (13). In this cluster the proportion of retail and facility types is fairly aligned with the overall values. The categories that surpass the general mean percentage include health and social assistance (7.07%), personal services and equipment (11.6% and 6.64%, respectively), leisure (3.15%), and banks (3.29%). On the other hand, categories with a lower mean percentage are cultural facilities (2.35%).
Finally, Cluster 5 covers only 3% of census tracts (n = 45) and presents moderate values of diversity (0.60) and vulnerability (5.49), and an extremely high proportion of tourist accommodation (13.00). Cluster 5 exhibits the most differentiated percentages in terms of activity distribution compared to the overall percentage. Undoubtedly, the category that stands out the most, in terms of percentages above the global average, is restaurants and bars (37.63%), which is significantly higher than the other clusters. However, there are also higher percentages in personal equipment (11.95%), cultural facilities (4.02%), and leisure (3.47%). Categories that are notably below the average include health and social assistance (3.11%), convenience food retail (11.94%), personal services (6.7%), household equipment (2.69%), repair services (1.75%), cleaning services (0.42%), and real estate agencies (0.35%). The census tracts of this cluster correspond to very particular areas located in the historical town of Ciutat Vella (1), including Barceloneta (the seafront neighbourhood), and also some tracts situated in the central streets of Eixample district (2) and Poblesec neighbourhood of Sants-Montjuïc district (3).
Discussion
Higher retail and facility diversity levels are generally found in denser areas that promote contact opportunity, such as those characterized by high levels of residential activity and density of intersections. This is consistent with the central theory of Jane Jacobs (Citation1961) on the ‘conditions for diversity’, which include population density and short-distance blocks with numerous intersections (Mohareb et al. Citation2016). The findings also suggest that a higher density of commercial activities is associated with a greater diversity of other types of activities, contrary to earlier findings. For example, in Tokyo, areas with high commercial density often exhibit low diversity scores (Kumakoshi, Koizumi, and Yoshimura Citation2021). In addition, accessibility (i.e., the presence of walkable and well-connected environments with public transportation) has also been found to be positively associated with greater diversity levels.
Results suggest that diversity is negatively associated with urban vulnerability and the relative presence of tourist activity in Barcelona. Specifically in this case study, socially disadvantaged neighbourhoods tend to have less diverse retail and amenity landscapes. This contradicts previous research using Jane Jacobs' approach to built environment determinants of vitality, to establish that the potential for urban vitality was not relegated to central, privileged areas of the city but rather extended to peripheral and often vulnerable neighbourhoods (Delclòs-Alió and Miralles-Guasch Citation2018; Gómez-Varo, Delclòs-Alió, and Miralles-Guasch Citation2022). While prior studies suggested that the vulnerability of the population does not influence the potential for urban vitality when examined as a whole, these results suggest that urban vulnerability might share a negative relationship with diversity, meaning that in areas with high vulnerability (i.e., areas with high levels of poverty, ageing, high presence of low-income immigration, residential degradation, high residential concentration, and low residential attraction) a significant drop is found in retail diversity levels along with facility-diversity levels. Additionally, these findings evidence that higher touristic activity is also negatively associated with diversity of retail and facilities. This is consistent with earlier research that points to the specialization of certain activities and the resulting loss of urban diversity (Anguera-Torrell and Cerdan Citation2021).
Beyond these general trends, however, these results point to the existence of different pathways in the specialization of urban areas with regards to the triad of vulnerability, touristification, and diversity. As an example, areas in Cluster 1 are mainly located in peripheral areas, which correspond to urban cores located far from the city centre and conurbated municipalities. These areas are characterized by socially disadvantaged populations – presenting a high score in the Index of Urban Vulnerability – and have limited tourist activity. However, they maintain high retail and amenity diversity. These areas were mainly developed in the 1960 to 1970s to house working-class migrant populations. The retail trade in these areas is primarily residential-oriented, with the most prevalent types of stores being basic personal services, local restaurants, and a limited selection of leisure and entertainment retail options, such as clothing. These areas were originally designed, and to an extent still are, ‘dormitory cities’, which are monofunctional urban areas by design that have later developed retail and facility-environments which are closely linked with daily needs and social reproduction (Duarte and Cerda Troncoso Citation2017). These have been accompanied by a regional concentration of non-essential retail in central areas forming agglomeration economies (Trullén i Thomas Citation2002), and the emergence in peripheral metropolitan enclaves of shopping malls that concentrate leisure and non-essential activities (Codina et al. Citation2019). The lack of leisure and non-essential retail and facilities within the urban fabric of these areas is suggested to have a negative impact on neighbourhood proximity dynamics for achieving the goal of a 15-minute city neighbourhood, rendering them as places with limited activities and opportunities, ‘nowhere to go’ or ‘nothing to do but sit’ (Christian et al. Citation2017). Consequently, leisure activities can be limited mainly to visiting bars (Gómez-Varo et al. Citation2023), which could be problematic in terms of public health concerns.
High-diversity areas are also found in socially advantaged neighbourhoods – with the presence of middle-high class population and high residential attraction – that could classify into two groups based on the presence of tourist accommodation. First, those neighbourhoods with socially privileged population and a scarce relative presence of tourist activity, where primary retail and services are found, such as food retail, as well as less essential activities such as those performed in leisure or cultural facilities (cluster 4). This may suggest that the combination of a low vulnerability with a low presence of tourism leads to a greater balance in the distribution of different retail activities and amenities. These are areas forming a ring around the central areas of the Barcelona urban layout, as well as some central neighbourhoods in adjacent municipalities. Residents living in these areas display a greater degree of satisfaction with their neighbourhood compared with other city inhabitants (Ajuntament de Barcelona Citation2021), which could be attributable to their ability to self-select their residence location because of their privileged situation. This may be of relevance for urban practice aiming to democratize the wellbeing and happiness of residents, which could be achieved by a well-balanced and diverse retail and facility activities within the neighbourhoods.
Second, there are sections where the presence of tourism is greater, and where the most prominent activities are restaurant and bars, leisure retail, and personal and household equipment (clothing and furniture) (cluster 2). These areas correspond to the central parts of the Eixample urban layout, the westernmost part of the historic district, where a large portion of commercial activity from major brands is concentrated, particularly on certain shopping streets, in combination with existing traditional retail. This cluster also includes the old historic cores such as Sants, Gracia, and Poble Nou, that were independent before the annexation of Barcelona, and whose diversity is explained by their long tradition of proximity dynamics, facilitated by their compact urban form with narrow streets and squares, and their connection to central Barcelona (Masip-Tresserra Citation2016). These areas have recently become scenarios for the extension of tourist destinations in the city. As proposed by Judd and Fainstein (Citation1999), historical urban designs have an advantage in generating placemaking. This is because urban tourism overlays onto the structure of old streets and buildings, and visitors actively seek to immerse themselves in traditional neighbourhoods through the retail landscape and the vibrant everyday activities (Mansilla and Milano Citation2019). However, paradoxically, the presence of a tourist-based floating population has affected the retail network, leading to a loss of traditional diversity (Milano, González-Reverté, and Benet Mòdico Citation2023). As a result, there is a growing demand for urban policies regulating land uses to prevent dynamics of monopolization of certain activities, such as bar terraces and tourist accommodations. Lower diversity levels can be found in areas with a greater presence of tourist accommodation, where almost 40% of retail activities are dedicated to hospitality, food and beverage services (cluster 5). These specific areas can be found in places in very particular locations, such as the old town fabric and the seafront neighbourhood of La Barceloneta, which, as previous studies have largely shown, have undergone processes of urban renewal that have contributed to the gentrification and touristification of the neighbourhoods, resulting in changes in the commercial structure and daily activities of the areas (Pascual-Molinas and Ribera-Fumaz Citation2008). This phenomenon, defined as overtourism, has been identified in many tourist cities around the world, bringing with it the thematization of neighbourhoods and the homogenization of urban landscapes, leading to significant losses in city diversity and serious consequences for urban life, such as displacement of population, neighbourhood discontent and lack of everyday services (Sánchez-Ledesma et al. Citation2020).
Despite the contributions of this paper to the understanding of diversity of retail and facility activities, the present study has some methodological limitations. First, merging two databases from different sources, which were systematized using different methodologies, resulted in the exclusion of some categories and the recategorization of certain businesses. While this reduced the specificity of activity types, it allowed for an analysis of diversity beyond Barcelona’s administrative boundaries, incorporating the metropolitan area and neighbouring municipalities. Second, there is a limitation regarding the timeframe of the databases. Although the databases used are quite recent (from 2019 and 2020), it is noteworthy that, as suggested by previous works (Frago Citation2021; Morcuende and Lloberas Citation2022), the effects of the pandemic and the virtualization of commercial activity may have led to the recent disappearance of the street retail sector. Third, the database used lacked qualitative information that would have been relevant for analysing the diversity of activities, such as the price range of these commercial establishments, the age of the businesses, the type of clientele they serve, and the inclusion of brands and major retailers, among other characteristics. Incorporating these variables would provide valuable insights into the diversity of activities, as suggested by other researchers who have explored commercial diversity by considering a broader range of factors (Dolega et al. Citation2019). For instance, a commercial activity could meet the needs of both the local population and the floating population, as suggested by some studies on the gourmetization of certain everyday services (Gonzalez Citation2018). Therefore, further analysis is necessary to incorporate such information into the assessment of diversity. In this sense, future research should also consider additional indicators beyond variables used as proxies to approximate different socioeconomic and tourist realities. For example, the proportion of tourist accommodation may not capture the full impact of tourism on commercial activity, particularly in peripheral neighbourhoods with tourist attractions where daily floating populations may have a significant effect on diversity (Antunes et al. Citation2020). Further, to approach socioeconomic characteristics, some authors are using other variables such as housing prices (Ren, Yuanli, and You Citation2021). Finally, there is an inherent limitation in aggregating the data on retail and facility activities at the level of census tracts, and utilizing them as the spatial unit of analysis. These limitations are related to a classical methodological issue in geography studies known as the Modifiable Areal Unit Problem (MAUP), which suggests that the chosen spatial partitioning of the census tracts may influence the results (Jelinski and Jianguo Citation1996).
Policy and research implications
Overall, these research findings aim to contribute to the ongoing debate around social vulnerability, tourism management, and the significance of diverse retail and infrastructure. Policymakers widely acknowledge the importance of protecting and promoting diversity in retail and activities within neighbourhoods, recognizing it as a crucial element that shapes urban landscapes and fosters social cohesion. Notably, recent measures implemented in global cities like Paris to revitalize the local economy have been viewed positively (Mairie de Paris Citation2018). For instance, initiatives aimed at facilitating locally-driven fair trade projects, using vacant commercial spaces, and integrating them into neighbourhood regeneration processes have emerged. Similarly, in Barcelona, the ‘Strategy for reinforcement and projection of commerce in Barcelona 2017–2019’ has been implemented (Ajuntament de Barcelona Citation2017a), acknowledging the essential role of commerce as an economic activity, while also emphasizing its significance in social integration and equal opportunities. However, as some authors have noted, it remains uncertain whether these initiatives effectively contribute to the establishment of proximity-based businesses (Fresnillo Citation2018). In order to pursue environmental and social sustainability, proximity should extend beyond mere physical proximity to residential areas, and encompass relational proximity to the local community, characterized by trust, neighbourliness, and the creation of communal networks (Sansone and Colamatteo Citation2017). To address this, further research should undertake a more qualitative analysis of the diversity of retail and infrastructures.
The findings of this paper are also relevant to the policies being implemented in numerous cities worldwide that affect the retail and infrastructure landscape. These policies involve transformative planning strategies that propose changes in urban design, aimed at creating peaceful environments and making them more walkable. The literature suggests that pedestrianized designs help enhance retail diversity and prosperity, although this has primarily been tested in specific central streets (Kang Citation2016; Yoshimura, Santi, et al. Citation2021). In Barcelona, similar traffic interventions have been implemented in recent years, notably the Superblocks Project. This project involves a traffic calming intervention that creates pacified interior roads, establishing a local network accessible by active modes of transportation, with retail establishments on the ground floors. Critical questions have been raised by authors such as Anguelovski, Honey-Rosés, and Marquet (Citation2023) regarding the equity implications of these interventions. They propose that when these implementations are confined to particular areas, they exclusively benefit the middle – and high-income population. To ensure that these interventions have a positive influence on socially disadvantaged groups, they should be implemented at the city scale.
Therefore, it is important for future research to assess the specific impact of all these policies on the intricate relationship between retail and infrastructure diversity, social vulnerability, and tourism. For instance, it is necessary to examine the influence of retail diversity on the delicate balance between tourist activities and local needs. Additionally, further investigation is needed to determine whether diverse commercial activities can be effectively planned through targeted local policies, or if they predominantly emerge from broader urban dynamics that go beyond the scope of land use planning and urban design. Furthermore, it is crucial to explore whether retail and infrastructure diversity also affect social vulnerability and the presence of tourism in the city, potentially contributing to the mitigation of vulnerability and preventing excessive tourism-driven transformations in specific urban spaces.
Moreover, it is worth considering that these targeted initiatives on retail and infrastructure may not be enough to reverse the loss of diversity or maintain it over time. Additional policies need to address global trends impacting retail, such as tourist pressure or the lack of affordable residential housing, which are closely interconnected in the context of Barcelona. These factors have a significant impact on the city’s commercial landscape and, consequently, on diversity and neighbourhood life, as previously highlighted by some scholars (Fresnillo Citation2018).
Conclusion
The aim of this study was to provide a comprehensive understanding of retail and facilities diversity and its spatial distribution in relation with social vulnerability and tourism, in the particular context of Barcelona (Spain). First, the objective was to understand the effects of both the built environment and socioeconomic factors on the distribution and intensity of diversity levels, which were examined through a regression analysis. While the previous literature had investigated these dimensions separately, the combined relationship between these two dimensions on different degrees of diversity has not been well-studied. Second, the aim was to investigate how diversity is shaped and affected by different levels of social vulnerability and tourist activity. Cluster analysis was used to identify different balances and pathways towards equilibrium between retail diversity, tourist activity intensity, and social vulnerability.
These findings suggest that more diverse retail and facility environments tend to concentrate in dense and compact urban environments. These conditions of the built environment tend to promote the necessary contact opportunities, population density and residential activity necessary for a wide variety of business to thrive. These results also find, however, that retail and facility diversity is negatively associated with urban vulnerability and the presence of tourist activity.
Overall, these results show that diversity cannot be considered a uniform and unique characteristic across the city, but rather it is differently manifested in the retail and facility network, fluctuating based on local conditions of the built environment but also on city-level dynamics of vulnerability and touristic activity. At the local level, this study also contributes to identifying areas where diversity may be threatened by the overrepresentation of certain activities, thus offering insights for the development of urban policies that ensure activity diversification and promote inclusive and equitable urban environments.
Finally, the insights from this study open the potential for new questions within current debates about the role of targeted interventions in land use and urban design, to ensure the diversity of retail and infrastructure. Future research should prioritize assessing the specific effects of these policies on the intricate relationship between retail, infrastructure diversity, social vulnerability, and tourism.
Supplemental Material
Download PDF (150.4 KB)Disclosure statement
No potential conflict of interest was reported by the author(s).
Supplementary data
Supplemental data for this article can be accessed online at https://doi.org/10.1080/13574809.2023.2245761.
Correction Statement
This article was originally published with errors, which have now been corrected in the online version. Please see Correction (http://dx.doi.org/10.1080/13574809.2023.2257952)
Additional information
Funding
References
- Ajuntament de Barcelona. 2017a. “Government Measure: Strategy for Reinforcement and Projection of Commerce in Barcelona 2017-2019.” https://ajuntament.barcelona.cat/comerc/sites/default/files/arxius/government_measure_0.pdf.
- Ajuntament de Barcelona. 2017b. “PEUAT. Special Tourist Accommodation Plan.” https://ajuntament.barcelona.cat/pla-allotjaments-turistics/en.
- Ajuntament de Barcelona. 2021. “Enquesta de Serveis Municipals 2021. Resum de Resultats.” https://ajuntament.barcelona.cat/premsa/wp-content/uploads/2021/10/r21007_ESM_Informe_Premsa_v1_0.pdf.
- AMB. 2019. ”Visor d’equipaments.” https://www.amb.cat/web/territori/urbanisme/cartografia/visor-equipaments
- Ananian, P., A. Perras, and M.-A. Borde. 2018. “Living in Old Montreal: Residents’ Perceptions of the Effects of Urban Development and Tourism Development on Local Amenities.” Canadian Geographies/Les Géographies Canadiennes 62 (4): 535–550. https://doi.org/10.1111/cag.12484.
- Anguelovski, I. 2015. “Healthy Food Stores, Greenlining and Food Gentrification: Contesting New Forms of Privilege, Displacement and Locally Unwanted Land Uses in Racially Mixed Neighborhoods.” International Journal of Urban and Regional Research 39 (6): 1209–1230. https://doi.org/10.1111/1468-2427.12299.
- Anguelovski, I., J. Honey-Rosés, and O. Marquet. 2023. “Equity Concerns in Transformative Planning: Barcelona’s Superblocks under Scrutiny.” Cities & Health 1–9. https://doi.org/10.1080/23748834.2023.2207929.
- Anguera-Torrell, O., and A. Cerdan. 2021. “Which Commercial Sectors Coagglomerate with the Accommodation Industry? Evidence from Barcelona.” Cities 112 (May): 103112. https://doi.org/10.1016/j.cities.2021.103112.
- Antón-Alonso, F., and S. Porcel. 2021. “La Vulnerabilitat Urbana a Barcelona: Persistència, Concentració i Complexitat.” Papers: Regió Metropolitana de Barcelona: Territori, Estratègies, Planejament 63: 50–67.
- Antunes, B., H. March, and J. J. T. Connolly. 2020. “Spatializing Gentrification in Situ: A Critical Cartography of Resident Perceptions of Neighbourhood Change in Vallcarca, Barcelona.” Cities 97: 102521–102521. https://doi.org/10.1016/j.cities.2019.102521
- Àrea Ecologia Urbana, and Barcelona Regional. 2023. “Superilla Barcelona : Barcelona 2015-2023.” Ajuntament de Barcelona. https://bcnroc.ajuntament.barcelona.cat/jspui/bitstream/11703/129164/1/br_superilles.pdf.
- Betevé. 2023. “Què regula el Pla d’Usos de l’Eixample? Què s’hi podrà obrir?”. https://beteve.cat/politica/que-regula-pla-usos-eixample-barcelona/
- Blázquez-Salom, M., A. Blanco-Romero, J. Gual-Carbonell, and I. Murray. 2019. “Tourist Gentrification of Retail Shops in Palma (Majorca).” In Overtourism: Excesses, Discontents and Measures in Travel and Tourism, edited by C. Milano, J. M. Cheer, and M. Novelli,39–69. Wallingford, UK: CABI Books. https://doi.org/10.1079/9781786399823.0039.
- Bridle-Fitzpatrick, S. 2015. “Food Deserts or Food Swamps?: A Mixed-Methods Study of Local Food Environments in A Mexican City.” Social Science & Medicine 142 (October): 202–213. https://doi.org/10.1016/j.socscimed.2015.08.010.
- Camerdata. 2020. “Camerdata | Fichero de Empreas Españolas.” https://www.camerdata.es/formulario-empresas-espanolas.
- Christian, H., S. R. Zubrick, M. Knuiman, A. Nathan, S. Foster, K. Villanueva, and B. Giles-Corti. 2017. “Nowhere to Go and Nothing to Do but Sit? Youth Screen Time and the Association with Access to Neighborhood Destinations.” Environment and Behavior 49 (1): 84–108. https://doi.org/10.1177/0013916515606189.
- City of Gothenburg, Arby. 2014. “Gothenburg 2035. Transport Strategy for a Close-Knit City.” https://goteborg.se/wps/wcm/connect/6c603463-f0b8-4fc9-9cd4-c1e934b41969/Trafikstrategi_eng_140821_web.pdf?MOD=AJPERES.
- Cocola-Gant, A. 2018. “Tourism Gentrification.” In Handbook of Gentrification Studies, edited by L. Lees, and M. Phillips, 281–293. Cheltenham, UK: Edward Elgar Publishing. https://www.elgaronline.com/display/edcoll/9781785361739/9781785361739.00028.xml.
- Codina, N., J. Vicente Pestana, M. Romeo Delgado, and M. Yepes I Baldó. 2019. “When Shopping and Leisure Go Together in Malls. User Experiences in Barcelona.” Anuario de Psicología/The UB Journal of Psychology 49 (1): 49–56. https://doi.org/10.1344/anpsic2019.49.6.
- Connolly, J. J. T. 2018. “From Jacobs to the Just City: A Foundation for Challenging the Green Planning Orthodoxy.” Cities 2017 (September): 1–7. https://doi.org/10.1016/j.cities.2018.05.011.
- Crosas, C., and E. Gómez-Escoda. 2020. “Mapping Food and Health Premises in Barcelona. An Approach to Logics of Distribution and Proximity of Essential Urban Services.” ISPRS International Journal of Geo-Information 9 (12): 746. https://doi.org/10.3390/ijgi9120746.
- Cui, C., J. Wang, W. Zhongjie, N. Jianhua, and T. Qian. 2016. “The Socio-Spatial Distribution of Leisure Venues: A Case Study of Karaoke Bars in Nanjing, China.” ISPRS International Journal of Geo-Information 5 (9): 1–17. https://doi.org/10.3390/ijgi5090150.
- Delclòs-Alió, X., and C. Miralles-Guasch. 2018. “Looking at Barcelona through Jane Jacobs’s Eyes: Mapping the Basic Conditions for Urban Vitality in a Mediterranean Conurbation.” Land Use Policy 75 (November 2017): 505–517. https://doi.org/10.1016/j.landusepol.2018.04.026.
- Dolega, L., J. Reynolds, A. Singleton, and M. Pavlis. 2019. “Beyond Retail: New Ways of Classifying UK Shopping and Consumption Spaces.” Environment and Planning B: Urban Analytics and City Science 48 (April): 239980831984066. https://doi.org/10.1177/2399808319840666.
- Dovey, K., and E. Pafka. 2017. “What Is Functional Mix? An Assemblage Approach.” Planning Theory & Practice 18 (2): 249–267. https://doi.org/10.1080/14649357.2017.1281996.
- Duarte, C. M., and J. Cerda Troncoso. 2017. “El comportamiento espacio-temporal de la población como instrumento de análisis de la estructura urbana: el caso de la Barcelona metropolitana.” Cuadernos geográficos de la Universidad de Granada 56 (2): 111–133.
- Fernández-Escobar, C., J. Díez, A. Martínez-García, U. Bilal, M. O’Flaherty, and M. Franco. 2022. “Food Availability and Affordability in a Mediterranean Urban Context: Associations by Store Type and Area-Level Socioeconomic Status.” Public Health Nutrition 26 (2): 1–21. https://doi.org/10.1017/S1368980022002348.
- Frago, L. 2021. “Impact of COVID-19 Pandemic on Retail Structure in Barcelona: From Tourism-Phobia to the Desertification of City Center.” Sustainability 13 (15): 8215. https://doi.org/10.3390/su13158215.
- Frank, L. D., J. F. Sallis, B. E. Saelens, L. Leary, K. Cain, T. L. Conway, and P. M. Hess. 2010. “The Development of a Walkability Index: Application to the Neighborhood Quality of Life Study.” British Journal of Sports Medicine 44 (13): 924–933. https://doi.org/10.1136/bjsm.2009.058701
- Fresnillo, I. 2018. “La Transformación Del Comercio de Proximidad En Los Barrios.” Papers: Regió Metropolitana de Barcelona: Territori, Estratègies, Planejament 60:140–150.
- Garcia, X., M. Garcia-Sierra, and E. Domene. 2020. “Spatial Inequality and Its Relationship with Local Food Environments: The Case of Barcelona.” Applied Geography 115 (December 2019): 102140. https://doi.org/10.1016/j.apgeog.2019.102140.
- Gobierno de Bogotá. 2021. “Sistema Distrital de Cuidado En Bogotá. Sitio Web.” https://bogota.gov.co/mi-ciudad/mujer/sistema-distrital-de-cuidado-en-bogota-sitio-web.
- Gomez-Escoda, E., C. Crosas Armengol, and M. Berra-Sandin. 2022. “Forms and Patterns of Mixticity in Compact Cities. Mixed-Use Synergies in the Sagrada Familia Neighbourhood of Barcelona.” Journal of Urban Design 1–22. https://doi.org/10.1080/13574809.2022.2128314.
- Gómez-Varo, I., X. Delclòs-Alió, and C. Miralles-Guasch. 2021. “Vitalidad Urbana y Vida Cotidiana: Revisitando a Jane Jacobs Desde El Análisis Espacial Del Comercio Alimentario En Barcelona.” Cuadernos Geográficos 60 (3): 147–167. https://doi.org/10.30827/cuadgeo.v60i3.16962.
- Gómez-Varo, I., X. Delclòs-Alió, and C. Miralles-Guasch. 2022. “Jane Jacobs Reloaded: A Contemporary Operationalization of Urban Vitality in A District in Barcelona.” Cities 123 (103565): 1–15. https://doi.org/10.1016/j.cities.2022.103565.
- Gómez-Varo, I., X. Delclòs-Alió, C. Miralles-Guasch, and O. Marquet. 2023. “Youth Perceptions on Urban Vitality. A Photovoice Study on the Everyday Experiences of Public Space.” Journal of Planning Education and Research 1–18. https://doi.org/10.1177/0739456X23117109.
- Gonzalez, S. 2018. “La «gourmetización» de Las Ciudades y Los Mercados de Abasto. Reflexiones Críticas Sobre El Origen Del Proceso, Su Evolución e Impactos Sociales.” Boletín Ecos 43 (June) : 1–8.
- Goossensen, M., X. Garcia, M. Garcia-Sierra, L. Calvet-Mir, and E. Domene. 2023. “The Role of Convenience Stores in Healthy Food Environments: The Case of Barcelona (Spain).” Cities 133 (February): 104118. https://doi.org/10.1016/j.cities.2022.104118.
- He, Q., W. He, Y. Song, J. Wu, C. Yin, and Y. Mou. 2018. “The Impact of Urban Growth Patterns on Urban Vitality in Newly Built-up Areas Based on an Association Rules Analysis Using Geographical ‘Big Data.’.” Land Use Policy 78: 726–738.
- INE. 2020. “Medición del número de viviendas turísticas en España y su capacidad.” https://www.ine.es/experimental/viv_turistica/experimental_viv_turistica.htm
- Jacobs, J. 1961. The Death and Life of Great American Cities. Harmondsworth: Penguin.
- Jelinski, D. E., and W. Jianguo. 1996. “The Modifiable Areal Unit Problem and Implications for Landscape Ecology.” Landscape Ecology 11 (3): 129–140. https://doi.org/10.1007/BF02447512.
- Judd, D. R., and S. S. Fainstein. 1999. The Tourist City. New Haven, CT: Yale University Press.
- Kang, C.-D. 2016. “Spatial Access to Pedestrians and Retail Sales in Seoul, Korea.” Habitat International 57 (October): 110–120. https://doi.org/10.1016/j.habitatint.2016.07.006.
- Kang, C.-D. 2020. “Effects of the Human and Built Environment on Neighborhood Vitality: Evidence from Seoul, Korea, Using Mobile Phone Data.” Journal of Urban Planning and Development 146 (4). https://doi.org/10.1061/(ASCE)UP.1943-5444.0000620.
- Kumakoshi, Y., H. Koizumi, and Y. Yoshimura. 2021. “Diversity and Density of Urban Functions in Station Areas.” Computers, Environment and Urban Systems 89 (September): 101679. https://doi.org/10.1016/j.compenvurbsys.2021.101679.
- Londoño-Cañola, C., G. Serral, J. Díez, A. Martínez-García, M. Franco, L. Artazcoz, and C. Ariza. 2023. “Retail Food Environment around Schools in Barcelona by Neighborhood Socioeconomic Status: Implications for Local Food Policy.” International Journal of Environmental Research and Public Health 20 (1): 649. https://doi.org/10.3390/ijerph20010649.
- Mairie de Paris. 2018. “Le Soutien de La Ville Aux Commerces de Proximité.” https://www.paris.fr/pages/paris-renforce-son-soutien-aux-commerces-de-proximite-4786.
- Mansilla, J. A., and C. Milano. 2019. “Becoming Centre: Tourism Placemaking and Space Production in Two Neighborhoods in Barcelona.” Tourism Geographies 24 (4–5): 599–620. https://doi.org/10.1080/14616688.2019.1571097.
- Masip-Tresserra, J. 2016. “Polycentricity, Performance and Planning: Concepts, Evidence and Policy in Barcelona, Catalonia.” A+Be | Architecture and the Built Environment 7:1–348. https://doi.org/10.7480/abe.2016.7.1155.
- Milano, C., F. González-Reverté, and A. Benet Mòdico. 2023. “The Social Construction of Touristification. Residents’ Perspectives on Mobilities and Moorings.” Tourism Geographies 25 (4): 1273–91. https://doi.org/10.1080/14616688.2022.2150785.
- Miralles-Guasch, C., and O. Marquet. 2013. “Dinámicas de Proximidad En Ciudades Multifuncionales.” Ciudad y Territorio: Estudios Territoriales XLV (177): 503–512.
- Mohareb, E., S. Derrible, and F. Peiravian. 2016. “Intersections of Jane Jacobs’ Conditions for Diversity and Low-Carbon Urban Systems: A Look at Four Global Cities.” Journal of Urban Planning and Development 142 (2): 05015004. https://doi.org/10.1061/(ASCE)UP.1943-5444.0000287
- Morcuende, A., and D. Lloberas. 2022. “Retail Apocalypse as a Differential Urbanisation Symptom? Analysis of Ground Floor Premises’ Evolution in Barcelona between 2016 and 2019.” Sustainability 14 (20): 13652. https://doi.org/10.3390/su142013652.
- Moreno, C., Z. Allam, D. Chabaud, C. Gall, and F. Pratlong. 2021. “Introducing the “15-Minute City”: Sustainability, Resilience and Place Identity in Future Post-Pandemic Cities.” Smart Cities 4 (1): 93–111. https://doi.org/10.3390/smartcities4010006.
- Opendata, B. C. N. 2019. “Economic Activities Census on the Ground Floor of the City of Barcelona.” https://opendata-ajuntament.barcelona.cat/data/en/dataset/cens-activitats-comercials
- Pascual-Molinas, N., and R. Ribera-Fumaz. 2008. “Retail Gentrification in Ciutat Vella, Barcelona.” In Whose Urban Renaissance? , edited by L. Porter and K. Shaw. London: Routledge.
- Perrone, C. 2019. “‘Downtown Is for People’: The Street-Level Approach in Jane Jacobs’ Legacy and Its Resonance in the Planning Debate within the Complexity Theory of Cities.” Cities 91 (January): 10–16. https://doi.org/10.1016/j.cities.2018.12.023.
- Porta, S., V. Latora, F. Wang, S. Rueda, E. Strano, S. Scellato, A. Cardillo, E. Belli, F. Càrdenas, B. Cormenzana, et al. 2012. “Street Centrality and the Location of Economic Activities in Barcelona.” Urban Studies 49 (7): 1471–1488. https://doi.org/10.1177/0042098011422570.
- Reese, A. M. 2019. Black Food Geographies: Race, Self-Reliance, and Food Access in Washington, D.C. Chapel Hill, NC: University of North Carolina Press. http://www.jstor.org/stable/10.5149/9781469651521_reese
- Ren, P., L. Yuanli, and K. You. 2021. “Residents’ Demands for Urban Retail: Heterogeneity in Housing Structure Characteristics, Price Quantile, and Space.” Land 10 (12): 1321. https://doi.org/10.3390/land10121321.
- Sánchez-Ledesma, E., H. Vásquez-Vera, N. Sagarra, A. Peralta, V. Porthé, and È. Díez. 2020. “Perceived Pathways between Tourism Gentrification and Health: A Participatory Photovoice Study in the Gòtic Neighborhood in Barcelona.” Social Science and Medicine 258 (June): 113095. https://doi.org/10.1016/j.socscimed.2020.113095.
- Sansone, M., and A. Colamatteo. 2017. “Trends and Dynamics in Retail Industry: Focus on Relational Proximity.” International Business Research 10 (2): 169. https://doi.org/10.5539/ibr.v10n2p169.
- Shenjing, H. 2015. “Consuming Urban Living in ‘Villages in the City’: Studentification in Guangzhou, China.” Urban Studies 52 (15): 2849–2873. https://doi.org/10.1177/0042098014543703.
- Trullén i Thomas, J. 2002. “La Economía de Barcelona y La Generación de Economías de Aglomeración : Hacia Un Nuevo Modelo de Desarrollo.” In Desarrollo Local: Teorías y Estrategias, edited by G. Beccattini, M. T. Costa, and J. Trullén i Thomas, 275–304. Madrid: Civitas.
- Victoria State Government. 2020. “Plan Melbourne 2017-2050.” https://www.planmelbourne.vic.gov.au/.
- Wang, F., and F.-Q. Niu. 2019. “Urban Commercial Spatial Structure Optimization in the Metropolitan Area of Beijing: A Microscopic Perspective.” Sustainability 11 (4): 1103. https://doi.org/10.3390/su11041103.
- Yoshimura, Y., Y. Kumakoshi, S. Milardo, P. Santi, J. Murillo Arias, H. Koizumi, and C. Ratti. 2021. “Revisiting Jane Jacobs: Quantifying Urban Diversity.” Environment and Planning B: Urban Analytics and City Science 239980832110509. https://doi.org/10.1177/23998083211050935.
- Yoshimura, Y., P. Santi, J. Murillo Arias, S. Zheng, and C. Ratti. 2021. “Spatial Clustering: Influence of Urban Street Networks on Retail Sales Volumes.” Environment and Planning B: Urban Analytics and City Science 48 (7): 1926–1942. https://doi.org/10.1177/2399808320954210.