
 ?Mathematical formulae have been encoded as MathML and are displayed in this HTML version using MathJax in order to improve their display. Uncheck the box to turn MathJax off. This feature requires Javascript. Click on a formula to zoom.
ABSTRACT
Solar PV has a disadvantage over its many advantages that its electrical efficiency falls due to rise in surface/operating temperature of solar PV cells. Therefore, it is necessary to find a way to mitigate the efficiency loss due to rise in temperature as well as to increase life span of solar photovoltaics by lowering its cell temperature. In this research, the impact of mist cooling on output of PV panel is observed through experimental setup installed at rooftop of Postgraduate Department, Mehran University of Engineering and Technology, Jamshoro, Pakistan. The rear surface of PV module is cooled with designed mist nozzle assembly. The performance of modified mist cooled PV module is than compared with reference PV module. Experimental investigation is performed several days in different weather conditions with natural circulation and with forced circulations by using submerged pump. The maximum efficiency gains of 7% and average gain of 3.72% is observed with natural circulation, and maximum gain of 9.2% and average gain 1.72% are observed with forced circulated mist. The overall impact of proposed mist cooled system is positive on performance of PV panels.
Introduction
Energy is commodity which plays a vital role in development of any country. Energy can be categorized as a necessity in this developing world. Major energy generation sources adopted by the world are affecting the environment and conditions becoming worse as time passing. Renewable energy plays a vital role for saving environment as well meeting the demand of energy up to some extent (Hamed and Alshare Citation2022). As clean sources of energy, renewable technologies are thought to produce the least amount of secondary waste and are sustainable in view of both immediate and long-term social, and economical needs (Panwar, Kaushik, and Kothari Citation2011). Solar energy, which can either be transformed directly into electricity through photovoltaic cells or into useful heat through a solar thermal collector, is one of the most promising renewable energy sources (Azizi et al. Citation2023). Solar energy is already the least expensive source of electricity accessible in several nations throughout the world (Shiradkar et al. Citation2022). As the second-largest generation sector of all renewable technologies, just behind wind and ahead of hydropower, solar photovoltaics (PV) power generation experienced rapid absolute generation growth in 2020 (approximately 23% to reach 821 TWh) (Shahjalal et al. Citation2021). Utilizing solar energy, which is affordable, clean, and sustainable, can promote both social and economic growth (Tuncer et al. Citation2020). Solar energy is also infinite, comes from the natural world, and does not cause any pollution. With the photovoltaic technique, solar cells can be used to harness solar energy (Hardianto Citation2019). Renewable energy capacity will increase over the next five years far more swiftly than was projected a year ago. Major projection states that between 2022 and 2027, renewable energy will grow by more than 2400 GW, which is comparable to China’s present installed power capacity. This indicates a rise of 85% over the preceding five years, the greatest ever upward revision, and is around 30% higher than the prediction in the study from the previous year. By 2027, cumulative PV capacity will have nearly tripled to about 2350 GW, surpassing coal, natural gas, and hydropower to become the greatest installed electricity capacity in the world, exceeding hydropower in 2024 and natural gas in 2026 and coal in 2027 (IEA Citation2022; Khatri et al. Citation2022).
The use of solar energy has increased recently due to its clean, renewable, and ecologically favorable nature. But from the beginning of human civilization, humans have constantly using solar energy (Tamuli, Nath, and Bhanja Citation2022). With an annual capacity of 2.556 kWh/m2, Asia is a region with plenty of sunshine that needs to be managed and used (Prasetyo, Prabowo, and Arifin Citation2022). The need for its scientific harvesting is greater than ever now, and it is anticipated to supply 48% of all global energy consumption (Mahboobe Mahdavi, Tiari, and Pawar Citation2020). Solar systems are often separated into thermal and photoelectric systems. A hybrid system composed of PV and PVT system is a new technique that generates heat energy as well as electricity (Anjum et al. Citation2023). The majority of solar array materials do not effectively use the terrestrial solar spectrum (43% IR, 48% VIS, 9% UV, and wavelength range 0.25–2.5 m) (Joshi, Dhoble, and Jiwanapurkar Citation2016). During the functioning of the PV cell, however, around 85% of solar energy is converted to heat and only about 15% is converted to electrical energy (Teo, Lee, and Hawlader Citation2012). The fraction that is not used will be lost as heat energy on the solar array, which will reduce the solar panel’s efficiency (Hasanuzzaman et al. Citation2016). In addition to solar radiation and temperature, a PV array’s performance is also influenced by the array’s layout and the shading effects (Bugaje et al. Citation2022). Photovoltaic (PV) technology is the most efficient technique to convert radiant energy into electrical energy (Shuraiji, Jadallah, and Shuraiji Citation2022). Solar cells are photoelectric energy conversion devices that employ the photoelectric effect to convert sunlight to electricity. Solar cells and associated components make up a photovoltaic system. It directly converts sunlight directly into electricity (Sainthiya, Beniwal, and Garg Citation2018). About 4–17% of the solar energy that enters a PV module is converted into electricity. As a result, the temperature of the PV module increases and more than 50% of the incoming solar energy is converted to heat (Chandrasekar et al. Citation2013). The efficiency of solar cells decreases linearly as operational temperature rises (Bassam et al. Citation2023). Thus, it is necessary to make on-going efforts to increase the cells’ efficiency by regulating their temperature (Schiro et al. Citation2017). Today, however, a new field known as photo thermal conversion has arisen, combining both ways of energy conversion. The conversion of solar energy into electricity and heat is accomplished by a single device known as a hybrid photovoltaic thermal (PVT) collector (Grant et al. Citation2002). The PVT concept first noticed in the mid-1970s (Chad Wheeley and Luck Citation2012). PVT collectors are solar panels that generate electricity while simultaneously functioning as a heat absorbing device. This simultaneously generates heat and electricity (Tyagi, Kaushik, and Tyagi Citation2012).
Surface temperature of PV bears inverse relation with electrical power and efficiency (Soliman Citation2023). Intense solar radiation with a warm environment can cause a photovoltaic cell to operate at a higher operating temperature, which is typically detrimental to the cell’s lifespan and power output (Dengfeng Du, Darkwa, and Kokogiannakis Citation2013). As temperature of PV rises, internal carriers recombination rate due to increased carrier concentrations resulting loss in electrical efficiency of PV module (Swapnil Dubey Citation2013). The rise of temperature increases current but the voltage drop due to rise in temperature is much, as it affects the electrical power so the efficiency. Cooling system either active or passive will be beneficial for power gain (Agyekum et al. Citation2021). The efficiency of a PV panel falls by 0.4% for every degree centigrade above 25°C that the operating temperature of the cells exceeds (Deokar, Bindu, and Potdar Citation2021). A solar system’s performance is severely impacted by the rising temperature (Belyamin et al. Citation2021). It decreases the efficiency as well as the operational life span of the PV panel (Said et al. Citation2023). So, creating an effective cooling system that lessens the temperature stress on PV panels may enhance the overall performance of PV systems (Shahsavar et al. Citation2022). By using cooling method, the surface temperature is reduced as well the surface is kept clean (Firoozzadeh et al. Citation2023). For manufacturers and consumers, it is a serious concern that solar photovoltaic module output would decrease as operating temperatures rise (Alami and Management Citation2014). It can be concluded that the PV module’s electrical efficiency decreases because of the temperature increase caused by solar radiation (Selvaraj et al. Citation2023). Heat is removed from the PV modules while maintaining a good electrical efficiency by properly circulating a fluid with a low inlet temperature. The overall energy production of system can be increased by using the thermal energy that was taken in a range of methods (Tripanagnostopoulos et al. Citation2002). The continuous development of thermal management techniques by various nanomaterial, that is, nano fluids and system designs has increased the overall performance of solar energy technology (Shahsavar et al. Citation2021). The cooling of PV using water mist is an effective way to decrease operating temperatures of PV. It will also reduce the thermal stresses developed due to high operating temperatures. The research shows gain of 15% in electrical power by water mist cooling (Chia-Yi Mah et al. Citation2019). When the temperature of the cooling liquid rises, the capacity to absorb heat rises as well, resulting in a drop in solar cell temperature and an increase in PV solar cell performance and efficiency (Teymori-Omran et al. Citation2021). Solar cells are decent selective absorbers and good heat collectors and most solar cells also become more efficient when heat is removed from the cell (Trond Bergene and Løvvik Citation1995). The availability, qualities, and affordability of water-cooled technology make it a widely used technique. Water is better at absorbing heat than air because it has a higher heat capacity. Hence, as compared to air, water is better option cool the PV panel (Khodadad Mostakim and Hasanuzzaman Citation2022).
PV panel cooling also prolongs the panel’s life by slowing down the pace of degradation, which is another reason why it is crucial. As stated by Royo et al. (Citation2016). The rated output of a photovoltaic cell reportedly decreased by 69% when its surface temperature reached 125°C in Brack City, southern Libya (Nassar and Salem Citation2007). Thus, to reduce heat losses, improve the system’s lifespan, and boost efficiency, a reliable cooling system is required. Different approaches, including both active and passive ones, have been used by several researchers to cool solar PV panels. E. B. Agyekum et al. (Citation2021) used cotton wick mesh to cool the PV module’s back surface resulted in an 11.9% increase in electrical efficiency due to capillary action and the absorption of water from a perforated pipe. Forced air stream was employed by Mazón-Hernández et al. (Citation2013) to improve the output performance of the PV module. Their research indicates that a 15°C drop in temperature on the PV panel resulted in a 15% improvement in electric energy yield. Mah et al. (Citation2019) reported a 15% increase in power output with front cooling. Similar to this, Rajvikram et al. (Citation2019) increased the module efficiency by using PV-PCM with an aluminum sheet mounted to the back side of panel. The upgraded module average conversion efficiency was found to be 24.4%. A decrease in temperature of 10.35°C resulted in a 2% increase in electrical efficiency. Investigations were conducted by (Wongwuttanasatian, Sarikarin, and Suksri Citation2020) on the possibility of using palm wax to control the temperature of PV systems. They controlled the PV module cooling using a PCM casing with fins which allowed to improve the performance ratio and module efficiency by 4.8% and 5.3%, respectively.
It is evident from the literature that numerous studies have been conducted with the goal of decreasing the PV panel temperature through various techniques. This work is also being carried out to improve the thermal management of panel by implementing a novel cooling technique for the PV system. Previous studies conducted for thermal management of solar PV panels in this perspective have been found employing jet impingement techniques without mist formation in open atmosphere. In this study, mist nozzle system for cooling of PV panel in open atmosphere, especially in hot weather of Jamshoro, Pakistan is investigated. The novelty is the formation of mist from the orifice of nozzle that lasts longer in the open atmosphere on the back side of the PV module. This mist absorbs the heat and causes the cooling effect. The goal of this research is to examine the effect of operating temperature on the electrical performance of PV panels with and without mist nozzle effect. The conclusions are based on experimental research, which was conducted by designing a novel mist cooling system with a reference PV panel mounted alongside the designed one.
The impact of operating temperature on effectiveness of solar photovoltaics
Temperature affects the electrical performance of PV cells due to increase in rate of recombination of electrical carriers. The operating temperature of PV play a crucial role in photovoltaic conversion (Swapnil Dubey, Sarvaiya, and Seshadri Citation2013). When operating temperature of PV panel rise above 25°C, the band gap of semiconductor material reduces which cause reduction in open circuit voltage (Muhammad Sufiyan Khan Citation2017). The Temperature of PV Cell Tpv depends on the weather variables such as solar radiation (I(t)), ambient temperature Ta and local wind speed Vw (Swapnil Dubey, Sarvaiya, and Seshadri Citation2013). The maximum power of Solar PV can be calculated using EquationEq. 1(1)
(1) ).
As temperature rises, the electrical properties of semiconductor materials will overcome by thermally excited electrons, which results in decline of both fill factor and open circuit voltage. The short circuit current will rise but it has very negligible impact (Furkan, Mehmet Emin, and R. energy Citation2010). The net effect of temperature on efficiency can be calculated using EquationEq. 2(2)
(2) .
γ indicates the solar radiation co-efficient and βref is a temperature coefficient with approximately values of 0.12 and 0.04 K−1, respectively, for crystalline silicon modules. Whether ηTref is the electrical efficiency of the module at reference temperature (Tref) and at solar radiation flux of 1000 W/m2 (Notton et al. Citation2005; Swapnil Dubey, Sarvaiya, and Seshadri Citation2013). Below given is EquationEq. 3(3)
(3) ), which depicts a linear relationship for electrical efficiency of PV system.
The values of βref and ηTref are usually given by manufacturer, but if not given these can be found from flash test. At two different temperatures for a specific solar radiation flux, the module’s electrical output is tested. In addition to the PV material, Tref also affects how precisely the temperature coefficient is calculated (Fahad Faraz Ahmad et al. Citation2021). It can be calculated using EquationEq. 4(4)
(4) )
where, To is the highest temperature at which electrical efficiency drops to zero. This temperature is 270°C for crystalline silicon solar cells (Garg and Agarwal Citation1995). Under real condition the electrical power can be calculated using EquationEq. 5(5)
(5) )
G denotes solar irradiance level in EquationEquation 5(5)
(5) whereas conversion efficiency under standard testing condition. While Tpv is the temperature of PV module and Tref is temperature at STC and β is temperature co-efficient (Swapnil Dubey, Sarvaiya, and Seshadri Citation2013). The EquationEquation 5
(5)
(5) can be redefined as EquationEquation 6
(6)
(6) and EquationEquation 7
(7)
(7) based on the conversion efficiency of PV module.
whereas, Pa = Pm - Pp
Pa is the net power, Pm denotes power produced by PV, while Pp is the power consumed by pump. is area of panel and G is for Solar irradiance in W/m2 (Ahmad, Said, and Hachicha Citation2022). For mist cooled system the power consumed by mist nozzle system is be deducted from power produced by PV Panel to get efficiency of modified mist cooled system.
Method and materials
The objective of this research is to assess and evaluate the operational performance of Solar PVT panel using mist cooling system in Mehran UET, Jamshoro, Sindh, Pakistan. The performance of mist cooled PV module will be compared with reference PV module to calculate efficiency improvement in electrical performance of PV by utilization of cooling effect.
Experimental setup
The experimental setup is installed on rooftop of Postgraduate Department, Mehran UET, Jamshoro as shown in . The novel design is used for cooling solar PV panel. The mist nozzle assembly is designed fabricated and installed with PV module which is called as modified PV module throughout this work. A mist nozzle assembly is placed in a water collection tray to collect water dropped after striking rear side of PV panel to save water. Along with modified PV module, the reference module is also placed on frame to compare the performance of our modified PV module. The Specifications of PV module are presented in . Six (06) thermistor-type thermocouples attached to the PV modules i.e., one for the front and one for rare of each module are shown in . Further two thermocouples are placed at inlet and outlet of mist nozzle assembly to calculate inlet and outlet temperature of water and one for ambient temperature. All thermocouples are attached to 8- channel data logger with resolution of 15 seconds as shown in . The irradiance and other weather data collected from weather station for direct beam solar resource assessment. Two VOLTAM meter are installed with each of PV panel to measure voltage and current as shown below in . Furthermore, load of 12 V rating is also added as a load with both modified and comparative PV panels.
Figure 1. (a). Real time setup of experimental setup. (b). Orientation of thermocouples mounted on the PV panels.
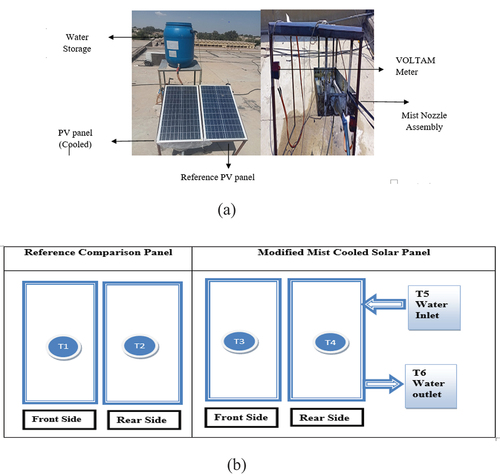
Figure 2. Weather station, data logger and VOLTAM meter.
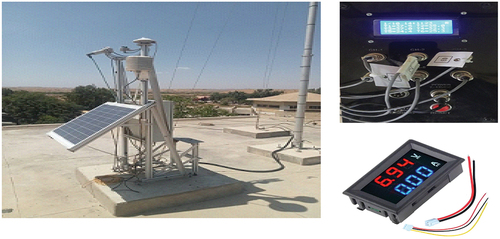
Table 1. Description of polycrystalline silicon PV panel.
Mist nozzle assembly for modified PV module
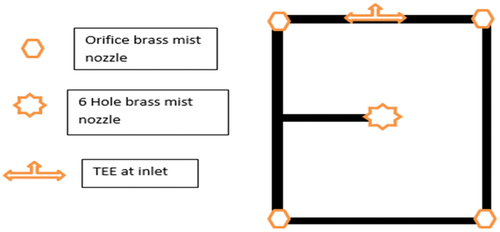
The mist nozzles assembly is attached with modified mist cooled PV. It consists of one 6 holes brass nozzle of 27 mm placed in center, and four 12 mm adjustable brass mist nozzles of 4 mm orifice are placed at both end in series 7 in apart horizontally and 16 in vertically from each other as shown in . This layout is designed to cover entire rear surface of PV module. The PVC pipe is used to join the nozzles which will be used for mist cooling purposes. The assembly is fitted inside aluminum sheet tray as shown in fig which is also used for water collection which is then drained in water drain tank. Water at ambient temperature taken from water reservoir (upper tank) and it will pass through nozzles and converted into mist. Mist is used for cooling purpose after that water droplets falls back in water collection tray after striking back surface of PV module and then transferred to drain tank.
Figure 3. Mist nozzle Assembly.
Mathematical investigation
The experimental research was conducted in the real time weather conditions of Jamshoro, Sindh, Pakistan to assess the effectiveness of the suggested modified mist cooled PV setup. Before running the water flow through the mist nozzle assembly, both modules are initially exposed to the same ambient conditions. Readings were taken after a while to get optimized results of cooling. The readings were taken on different days from time varying from 10 am to 4 pm. After three days the results were taken by utilizing water pump for mist production for remaining 6 days. The natural wind convection is not considered by assuming it same for both simple and modified PV modules. The data logger is used to collect temperatures as mentioned above and voltage and current from VOLTAM meters installed with both panels.
The experimental investigation was conducted on various days with natural circulation and forced circulation by using submerged pump. Two PV modules each of 35 W (modified mist cooled module and simple PV module) exposed to environmental condition for collection of data. The maximum tilt angles documented for places between 2.6° and 30° N latitude, or slightly above the equator, range from 5° to 28° overall (Yunus Khan et al. Citation2020). As Jamshoro is located at longitude of 26º, therefore the panel are tilled at 25° angle to get maximum irradiation (Laghari, Shah, and Jatoi Citation2022). When the mist producing system is turned on, a quick drop in temperature appears on the PV module’s front and back surfaces. An electrical submerged pump is used to generate required pressure of mist for second case.
For calculation of reduction in temperature and gain in power, and efficiency due to mist cooling is calcualted using EquationEquation (8)(8)
(8) , Equationequation (9)
(9)
(9) and (Equation10
(10)
(10) ) (Ahmad, Said, and Hachicha Citation2022).
While there is another advantage, we have is gain in temperature of water used as a mist for cooling purpose. The warm water can be utilized in other domestic applications. The heat gain can be calculated by using EquationEquation 11(11)
(11) given below.
where Twater,in and Twater, out refer to the temperature of the working fluid entering and leaving the mist-cooled collection tray, respectively (Skoplaki, Boudouvis, and Palyvos Citation2008).
Uncertainty analysis
The electrical and thermal parameters uncertainty analysis has been done in this section. The uncertainty resulting from repetition error () and equipment error
together make up the parameter’s total uncertainty
as given in EquationEquation 12
(12)
(12) (Sardarabadi, Passandideh-Fard, and Heris Citation2014).
If the function U is constructed as a function of n independent linear parameters and the parameters
. are measured with uncertainties
, where U is defined as:
, then the uncertainty of U will be defined as EquationEquation 13
(13)
(13) (Benedict and Gould Citation1996).
represents the function uncertainty U,
is the uncertainty of ui and
is for the partial derivative of U with respect to
(Islam et al. Citation2021).
Given that uncertainties in are independent of one another, fractional uncertainty of U can be calculated using EquationEquation 14
(14)
(14) (Taylor and Thompson Citation1982).
The maximum absolute uncertainty for all parameters is computed using the above-mentioned approach and data from . It is discovered to be less than 5% in this experiment. The validity of the measured data is established by uncertainty values inside of the defined range (Sardarabadi, Passandideh-Fard, and Heris Citation2014).
Table 2. Uncertainties associated with the measuring instruments of the experimental setup.
Result and discussion
The experimental studies were conducted for several days and results are generated by using data collected. The data sets are temperatures of front and rear surfaces measured between 10: 00 am and 24:00 pm measured by thermocouples connected to data logger, Voltage and current values are noted from VOLTAM meter while irradiance data is from weather data provided by MDI Weather station.
With natural circulation
For first three days the comparative readings were taken without switching on the pump to test the behavior of both mist cooled and simple comparative PV module. The maximum power gains of 6.95%, 4.38%, and 4.36% were observed during three days at peak irradiance of 703, 684, and 690 W/m2, respectively, as mentioned in . Summary of maximum variation of temperature with natural circualtion is given in . The maximum power gain of 6.95% is spotted on 1 February at 12:00 pm when irradiance of 684 W/m2 is recorded. The average power and temperature variations for each day are indicated in .
Figure 4. Comparative power and temperature variations of modified and comparison PV modules on 1st, 2nd, and 3rd February.
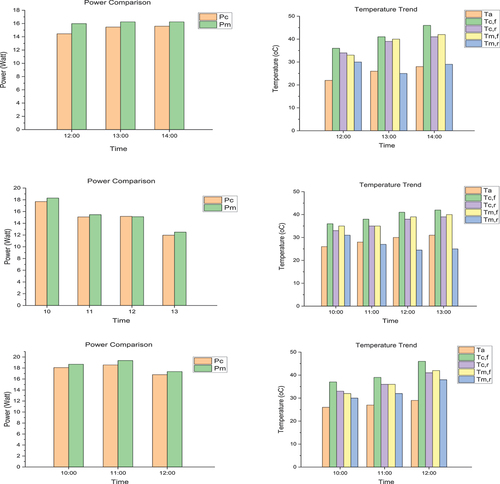
Table 3. Summary of maximum power gain with natural circulation.
Table 4. Summary of PV module temperature variation with natural circulation.
With forced circulation
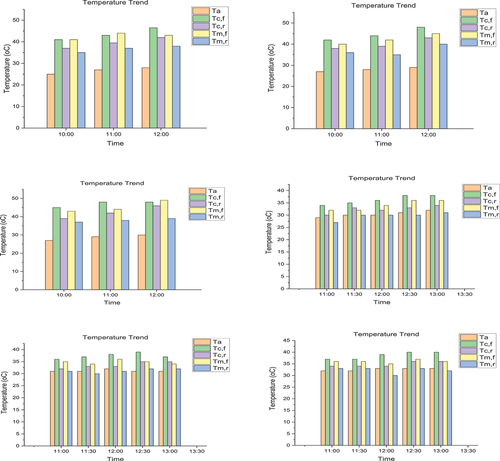
For second case as mentioned, submerged pump is used to generate water mist with max flow rate of 1000 L/H. The max power gain of 9.2% was observed on 2 March @ 12:30 pm. Overall on different times power gain was low due to cloudy weather conditions or due to lowering of current because of temperature falls rapidly by pressurized mist. The average power and temperature variation shown for various days with forced circulation is given in . The results of temperature variation at each point taken is demonstrated through generated graphs for power variation and temperature with respect to irradiance at that time is shown in . The results shows gain in power and temperature difference between modified and comparative panels are considerable but very little power gain observed at early morning when temperature is low which indicates that cooling system should be effective when temperature is high and wind speed is low because at high wind speeds, convective heat transfer will increase as well. At some point, loss in efficiency is also observed, which indicates that power input to pump is a source which is used while running mist nozzle system with forced circulations, so there should be considerable power gain which will overcome power input and generates surplus power as well.
Table 5. Summary of PV module temperature variation with forced circulation.
Table 6. Summary of maximum power gain with forced circulation.
Figure 5a. Comparative power of modified and comparison (Pc & Pm) of PV modules on 8th ,9th, 10th, & 28th February and 1st , & 2nd March.
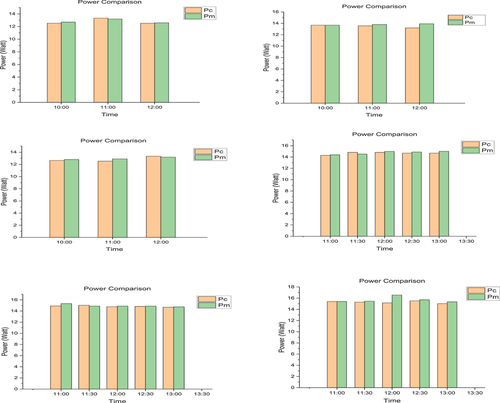
Figure 5b. Temperature trend [ambient, modified and comparison (Ta, Tcf, tcr, tmf, & tmr) on 8th ,9th, 10th, & 28th February and 1st , & 2nd March.
Overall, the ummary of average temperature and efficiency gain with natural and forced circulation is given in , respectively.
Efficiency optimization
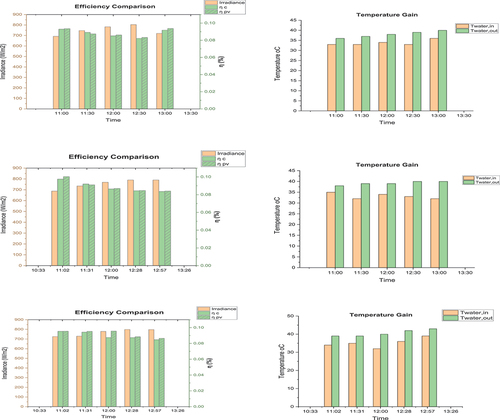
The maximum efficiency gains of 7% at 12 pm, 4.4% at 1 pm, 4.36% at 11pm for 1, 2, and 3 Feb respectively and maximum gain in temperature of water is observed on 1 February at 1:00 pm which is 9°C with natural circulation of mist due to head provided. The maximum efficiency gain with cooling by utilizing pump are 1.3% at 12pm, 3% at 11pm, 5.45% at 12 pm, 2.13% at 1pm, 2.8% at 11pm, and 9.2% at 12pm on 8, 9, 10, and 28 February and 1 and 2 March, respectively, and the max gain of 8°C were observed on 1 and 2 March at 1:00 pm and 2:00 pm, respectively. The visual data consist of efficiency comparisons on each test day and temperature gained by water after striking rear surface of PV panel is displayed in for natural circulation and for forced circulation.
Figure 6. Efficiency comparison and temperature gain on 1st ,2nd , and 3rd February.
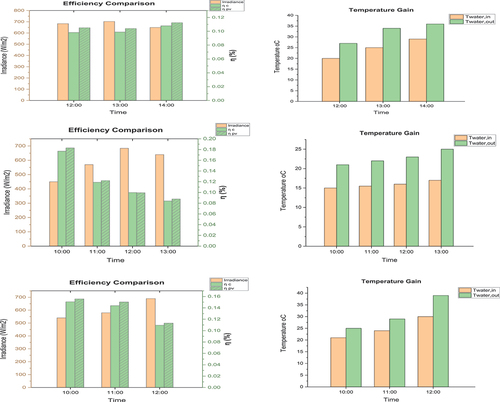
Figure 7a. Efficiency comparison and temperature gain on 8th ,9th , & 10th February.
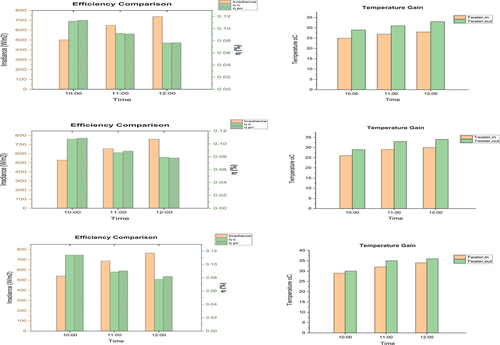
Figure 7b. Efficiency comparison and temperature gain on 28th Feb, and 1st & 2nd March.
Comparison with existing cooling systems for PV
Analysis and comparison of this work with previously reported PV cooling methods are performed are mentioned in this study. Nižetić et al. conducted research on the performance response of PV using various water spray cooling techniques with the rear cooling case a power gain of 14.0% and an efficiency gain of 15.59% were observed at a water temperature of 17°C and irradiance of 810–85 W/m2 (Nižetić et al. Citation2016). F.F Ahmad et al. carried research on closed loop rear cooling technique and attain a max efficiency gain of 16.81% without insulated container and 20.45% with Insulated container (Ahmad, Said, and Hachicha Citation2022). N.T.J Wei et al. used PCM technique for cooling solar PV and at average irradiance of 706 and maximum of 1100 W/m2 the efficiency gain of 2.7% is observed (Wei, Nan, and Guiping Citation2017). In the current study, by utilizing natural circulation of water at average irradiance of 619 W/m2 the peak efficiency gain of 7% is observed and gain of 9% at average irradiance of 715 W/m2 is attained. presents the comparison of the proposed technique with existing cooling technologies of PV.
Table 7. Summary of average temperature and efficiency gain with natural circulation.
Table 8. Summary of average temperature and efficiency gain with forced circulation.
Table 9. Comparison with other works done in past on cooling of PV system.
Proposed mist cooling system utilized water at ambient temperature and not required any type of additional cooling mechanism. It is concluded that the results are satisfactory as temperature of PV panel is reduced by using this technique and significant power and efficiency gain is observed.
Conclusions
One of the most popular sustainable energy alternatives in use today is solar energy. Although it is a clean way to generate energy, there are certain drawbacks that limit its output performance. The efficiency of the PV panel is mostly dependent on variables like the module’s temperature and the incidence of solar radiation. Thus, to control the PV module’s temperature, this study is a valuable addition to the cooling techniques previously suggested. This research examines a mist cooling technique by using mist nozzles for cooling PV modules. 04 mist nozzles of 0.4 mm orifice diameter and one 6-hole brass mist nozzle are used to produce mist from water. A cloud of tiny water droplets suspended in the air is the mist. The tiny drops of water hit the rear surface of PV module’s, absorb heat, and instantly evaporate. Due to evaporation the temperature PV module drops down significantly. The results collected for two cases one with natural circulation and one with forced circulation by using submersible water pump. The following are the key observations.
With Natural Circulation
With average irradiance of 619.1 W/m2 across 03 days the following are key results;
The average efficiency gains of 3.72% observed across 3 days and the peak efficiency gain of 7% observed at 12 pm on 3 February.
The maximum power gain of 6.95% is observed on 1 February while average power gain of 3.72% is observed across 3 days.
The maximum DT (water) of 9°C is observed on 1 February while the average DT of 6.85°C observed during course of 3 days.
With Forced Circulation
With average irradiance of 715 W/m2 across 6 days the following are key results;
The average efficiency gains of 1.31% observed across 6 days and the peak efficiency gain of 9% observed at 12:30 pm on 2 March.
The maximum power gain of 9.2% is observed on 2 March while average power gain of 1.3% is observed across 6 days.
The Maximum DT (water) of 8°C is observed on 1 March at 1pm and 2 March at 12 pm while the average DT of 4.46°C observed during course of 6 days.
The above-mentioned results are satisfactory because considerable gain in efficiency and power is recorded which can be optimized to add more value addition to proposed cooling method which results in efficiency gain as well as temperature rise observed at outlet of mist nozzle assembly that is sensible heat gain which is another advantage. Only gain observed here is electrical gain which is listed in efficiency section while heat gain as mentioned is other advantage if utilized then will reduce PBP of this system as well. Up to 9°C gain in temperature observed at 650–700 W/m2 irradiance and ambient temperature between 25°C and 28°C, which shows that at higher temperatures which are normal in Jamshoro it will be more effective.
The experimental process that was employed to control the PV panel’s temperature has really shown to be successful, and it can be utilized to cool PV systems, particularly in regions of the world that experience extreme temperatures. The outcomes of results are positive as both power and efficiency gain are observed. However, performing that same experiment with nanofluids and with phase change materials can be carried out in future for better heat transfer rates and more efficiency gain. Also, it is observed that the mist system is only feasible when temperature is high and if the temperature is too low it will reduce current hence power loss so this study can be investigated in different approach for feasibility of low temperature ranges.
Nomenclature
| P | = | Electrical power (W) |
| FF | = | Fill factor |
| = | Electrical efficiency (%) | |
| = | Voltage at maximum power point (V) | |
| = | Current at maximum power point (A) | |
| = | Specific heat at constant pressure (J/kg ºC) | |
| = | Outlet Temperature (ºC) | |
| = | Irradiation value on module plane (W/m2) | |
| = | Cell Area of the PVT module (m2) | |
| = | Short circuit current (A) | |
| = | Open circuit voltage (V) | |
| = | Thermal efficiency (%) | |
| = | Inlet Temperature (ºC) | |
| = | Time to reach the water temperature to |
Acknowledgments
The work presented in this publication was made possible from QUPD‐CENG‐23‐24‐537 project funded by Qatar University Office of VP for Research support and Mehran University of Engineering and Technology, Jamshoro, Pakistan. The findings herein reflect the work, and are solely the responsibility, of the authors. Open Access funding provided by the Qatar National Library.
Disclosure statement
No potential conflict of interest was reported by the author(s).
Additional information
Funding
Notes on contributors
Syed Ali Raza Naqvi
Syed Ali Raza Naqvi, is currently pursuing Masters in Energy Systems Engineering at Mehran University of Engineering & Technology, Jamshoro, Pakistan. He holds B.E. in Mechanical Engineering from Mehran University of Engineering & Technology, Jamshoro, Pakistan.
Laveet Kumar
Laveet Kumar currently holds a position of Postdoctoral Research Fellow at Department of Mechanical Engineering at Qatar University. Dr. Kumar holds a Ph.D. Degree in Renewable Energy Engineering from University of Malaya, Malaysia (2022) with emphasis in Solar Energy.
Khanji Harijan
Khanji Harijan currently holds a position of Professor of Mechanical Engineering at Mehran University of Engineering & Technology, Jamshoro, Pakistan. Dr. Harijan holds a Ph.D. Degree in Mechanical Engineering from Mehran UET, Jamshoro with emphasis in Renewable Energy Systems.
Ahmad K. Sleiti
Ahmad K. Sleiti currently holds a position of Professor of Mechanical Engineering at Qatar University. Dr. Sleiti holds a Ph.D. Degree in Mechanical Engineering from University of Central Florida, USA with emphasis in Energy systems and Thermal sciences.
References
- Agyekum, E. B., S. PraveenKumar, N. T. Alwan, V. I. Velkin, and S. E. Shcheklein. 2021. Effect of dual surface cooling of solar photovoltaic panel on the efficiency of the module: Experimental investigation. Heliyon 7 (9):e07920. doi:10.1016/j.heliyon.2021.e07920.
- Agyekum, E. B., S. PraveenKumar, N. T. Alwan, V. I. Velkin, S. E. Shcheklein, and S. J. Yaqoob. 2021. Experimental investigation of the effect of a combination of active and passive cooling mechanism on the thermal characteristics and efficiency of solar PV module. Inventions 6 (4):63. doi:10.3390/inventions6040063.
- Ahmad, F. F., Z. Said, and A. A. Hachicha. 2022. Experimental performance evaluation of closed loop mist/fog cooling system for photovoltaic module application. Energy Conversion and Management: X 14:100226. doi:10.1016/j.ecmx.2022.100226.
- Alami, A. H. J. E. C., and Management. 2014. Effects of evaporative cooling on efficiency of photovoltaic modules. Energy Conversion and Management 77:668–79. doi:10.1016/j.enconman.2013.10.019.
- Anjum, T., A. Abdulmuhsen Saleh Basuhaib, J. Selvaraj, L. Kumar, and M. Hasanuzzaman. 2023. Performance investigation of tempered glass based photovoltaic panel integrated with back cooling hollow chamber. energy sources, part A: Recovery. Energy Sources Part A: Recovery, Utilization, and Environmental Effects 45 (4):11733–51. doi:10.1080/15567036.2023.2262441.
- Azizi, M., R. Tabatabaeekoloor, A. Motevali, and S. Reza Mousavi Seyedi. 2023. Evaluation of mono and hybrid nano-fluids on energy and exergy parameters of a photovoltaic-thermal system equipped with an eccentric parabolic trough concentrator. Applied Thermal Engineering 223:119979. doi:10.1016/j.applthermaleng.2023.119979.
- Bassam, A. M., K. Sopian, A. Ibrahim, M. F. Fauzan, A. B. Al-Aasam, and G. Y. Abusaibaa. 2023. Experimental analysis for the photovoltaic thermal collector (PVT) with nano PCM and micro-fins tube nanofluid. Case Studies in Thermal Engineering 41:102579. doi:10.1016/j.csite.2022.102579.
- Belyamin, B., M. A. Fulazzaky, M. Roestamy, and R. Subarkah. 2021. Influence of cooling water flow rate and temperature on the photovoltaic panel power. Energy, Ecology and Environment 7 (1):1–18. doi:10.1007/s40974-021-00223-4.
- Benedict, L., and R. J. E. I. F. Gould. 1996. Towards better uncertainty estimates for turbulence statistics. Experiments in Fluids 22 (2):129–36. doi:10.1007/s003480050030.
- Bugaje, A., M. Ehrenwirth, C. Trinkl, and W. Zoerner. 2022. Investigating the performance of rural off-grid photovoltaic system with electric-mobility solutions: A case study based on Kenya. Journal of Sustainable Development of Energy, Water and Environment Systems 10 (1):1–15. doi:10.13044/j.sdewes.d9.0391.
- Chad Wheeley, P. J. M., and R. Luck. 2012. Methodology to perform a combined heating and power system feasibility study for industrial manufacturing facilities. Distributed Generation & Alternative Energy Journal 8–32. doi:10.13052/dgaej2156-3306.2711.
- Chandrasekar, M., S. Suresh, T. Senthilkumar, and M. Ganesh Karthikeyan. 2013. Passive cooling of standalone flat PV module with cotton wick structures. Energy Conversion and Managment 71:43–50. doi:10.1016/j.enconman.2013.03.012.
- Chia-Yi Mah, B.-H. L., C.-W. Wong, M.-H. Tan, K.-K. Chong, A.-C. Lai, and A.-C. Lai. 2019. Investigating the performance improvement of a photovoltaic system in a tropical climate using water cooling method. Energy Procedia 159:78–83. doi:10.1016/j.egypro.2018.12.022.
- Dengfeng Du, J. D., J. Darkwa, and G. Kokogiannakis. 2013. Georgios Kokogiannakis thermal management systems for photovoltaics (PV) installations: A critical review. Solar Energy 97:238–254. doi:10.1016/j.solener.2013.08.018.
- Deokar, V. H., R. S. Bindu, and S. S. Potdar. 2021. Active cooling system for efficiency improvement of PV panel and utilization of waste-recovered heat for hygienic drying of onion flakes. Journal of Materials Science: Materials in Electronics 32 (2):2088–102. doi:10.1007/s10854-020-04975-3.
- Fahad Faraz Ahmad, C. G., A. Kadir Hamid, O. Rejeb, M. Bettayeb, and M. Bettayeb. 2021. Performance enhancement and infra-red (IR) thermography of solar photovoltaic panel using back cooling from the waste air of building centralized air conditioning system. case studies in thermal engineering 2021. Case Studies in Thermal Engineering 24:100840. doi:10.1016/j.csite.2021.100840.
- Firoozzadeh, M., M. Lotfi, A. H. Shiravi, and M. Rajabzadeh Dezfuli. 2023. An experimental study on using water streaks and water film over PV module to enhance the electrical efficiency. Environmental Science and Pollution Research 1–13. doi:10.1007/s11356-023-27117-8.
- Furkan, D., M. J. S. G. Mehmet Emin, and R. energy. 2010. Critical factors that affecting efficiency of solar cells Smart Grid and Renewable Energy. 1 (1): 2010. doi:10.4236/sgre.2010.11007.
- Garg, H. P., and R. K. Agarwal. 1995. Some aspects of a PV/T collector/forced circulation flat plate solar water heater with solar cells. Energy Conversion and Managment 36 (2):87–99. doi:10.1016/0196-8904(94)00046-3.
- Grant, C. D., A. M. Schwartzberg, G. P. Smestad, J. Kowalik, L. M. Tolbert, and J. Z. Zhang. 2002. Characterization of nanocrystalline and thin film TiO2 solar cells with poly(3-undecyl-2,2′-bithiophene) as a sensitizer and hole conductor. Journal of Electroanalytical Chemistry 522 (1):40–48. doi:10.1016/S0022-0728(01)00715-X.
- Hamed, T. A., and A. J. J. O. S. D. O. E. Alshare. 2022. Water, and E. Systems, environmental impact of solar and wind energy-a review. Journal of Sustainable Development of Energy, Water and Environment Systems 10 (2):1–23. doi:10.13044/j.sdewes.d9.0387.
- Hardianto, H. 2019. Utilization of solar power plant in Indonesia: A review. International Journal of Environment, Engineering and Education 1 (3):1–8. doi:10.55151/ijeedu.v1i3.21.
- Hasanuzzaman, M., A. Malek, M. M. Islam, A. K. Pandey, and N. A. Rahim. 2016. Global advancement of cooling technologies for PV systems: A review. Solar Energy 137:25–45. doi:10.1016/j.solener.2016.07.010.
- IEA. Renewables 2022: Global energy transitions.2022, IEA: Online.
- Islam, M., M. Hasanuzzaman, N. A. Rahim, A. K. Pandey, M. Rawa, and L. Kumar. 2021. Real time experimental performance investigation of a NePCM based photovoltaic thermal system: An energetic and exergetic approach. Renewable Energy 172:71–87. doi:10.1016/j.renene.2021.02.169.
- Joshi, S. S., A. S. Dhoble, and P. R. J. J. O. S. E. E. Jiwanapurkar. 2016. Investigations of different liquid based spectrum beam splitters for combined solar photovoltaic thermal systems. Journal of Solar Energy Engineering 138 (2):021003. doi:10.1115/1.4032352.
- Khatri, S. A., K. Harijan, M. A. Uqaili, S. F. Shah, N. H. Mirjat, and L. Kumar. 2022. Solar photovoltaic potential and diffusion assessment for Pakistan. Energy Science and Engineering 10 (7):2452–74. doi:10.1002/ese3.1149.
- Khodadad Mostakim, M. H., and M. Hasanuzzaman. 2022. Global prospects, challenges and progress of photovoltaic thermal system. Sustainable Energy Technologies and Assessments 53:10426. doi:10.1016/j.seta.2022.102426.
- Laghari, M. H., S. G. A. Shah, and S. N. Jatoi. 2022. New archaeological discoveries along the mole, desoi and baran nian/rain water Nalla District Jamshoro Sindh, Pakistan. Pakistan Languages and Humanities Review 6 (3):352–59. doi:10.47205/plhr.2022(6-III)30.
- Mahboobe Mahdavi, S. T., S. Tiari, and V. Pawar. 2020. A numerical study on the combined effect of dispersed nanoparticles and embedded heat pipes on melting and solidification of a shell and tube latent heat thermal energy storage system. Journal of Energy Storage 27:101086. doi:10.1016/j.est.2019.101086.
- Mah, C.-Y., B.-H. Lim, C.-W. Wong, M.-H. Tan, K.-K. Chong, and A.-C. Lai. 2019. Investigating the performance improvement of a photovoltaic system in a tropical climate using water cooling method. Energy Procedia 159:78–83. doi:10.1016/j.egypro.2018.12.022.
- Mazón-Hernández, R., J. R. García-Cascales, F. Vera-García, A. S. Káiser, and B. Zamora. 2013. Improving the electrical parameters of a photovoltaic panel by means of an induced or forced air stream. International Journal of Photoenergy 2013:1–10. doi:10.1155/2013/830968.
- Muhammad Sufiyan Khan, V. H. 2017. Ganesh Shankar effect of temperature on performance of solar panels- analysis, in 2017 International Conference on Current Trends in Computer, Electrical, Electronics and Communication (CTCEEC), IEEE, Mysore, India.
- Nassar, Y. F., and A. A. J. D. Salem. 2007. The reliability of the photovoltaic utilization in southern cities of Libya. Desalination 209 (1–3):86–90. doi:10.1016/j.desal.2007.04.013.
- Nižetić, S., D. Čoko, A. Yadav, and F. Grubišić-Čabo. 2016. Water spray cooling technique applied on a photovoltaic panel: The performance response. Energy Conversion and Management 108:287–96. doi:10.1016/j.enconman.2015.10.079.
- Notton, G., C. Cristofari, M. Mattei, and P. Poggi. 2005. Modelling of a double-glass photovoltaic module using finite differences. Applied Thermal Engineering 25 (17–18):2854–77. doi:10.1016/j.applthermaleng.2005.02.008.
- Panwar, N. L., S. C. Kaushik, and S. Kothari. 2011. Role of renewable energy sources in environmental protection: A review. renewable and sustainable energy reviews. Renewable and Sustainable Energy Reviews 15 (3):1513–1524. doi:10.1016/j.rser.2010.11.037.
- Prasetyo, S. D., A. R. Prabowo, and Z. J. M. T. P. Arifin. 2022. The effect of collector design in increasing PVT performance: Current state and milestone. Materials Today: Proceedings 63:S1–S9. doi:10.1016/j.matpr.2021.12.356.
- Rajvikram, M., S. Leoponraj, S. Ramkumar, H. Akshaya, and A. Dheeraj. 2019. Experimental investigation on the abasement of operating temperature in solar photovoltaic panel using PCM and aluminium. Solar Energy 188:327–38. doi:10.1016/j.solener.2019.05.067.
- Royo, P., V. J. Ferreira, A. M. López-Sabirón, and G. Ferreira. 2016. Hybrid diagnosis to characterise the energy and environmental enhancement of photovoltaic modules using smart materials. Energy 101:174–89. doi:10.1016/j.energy.2016.01.101.
- Said, Z., F. F. Ahmad, A. M. Radwan, and A. A. Hachicha. 2023. New thermal management technique for PV module using Mist/PCM/Husk: An experimental study. Journal of Cleaner Production 401:136798. doi:10.1016/j.jclepro.2023.136798.
- Sainthiya, H., N. S. Beniwal, and N. J. J. O. S. E. E. Garg. 2018. Efficiency improvement of a photovoltaic module using front surface cooling method in summer and winter conditions. Journal of Solar Energy Engineering 140 (6):061009. doi:10.1115/1.4040238.
- Sardarabadi, M., M. Passandideh-Fard, and S. Z. J. E. Heris. 2014. Experimental investigation of the effects of silica/water nanofluid on PV/T (photovoltaic thermal units). Energy 66:264–272. doi:10.1016/j.energy.2014.01.102.
- Schiro, F., A. Benato, A. Stoppato, and N. Destro. 2017. Improving photovoltaics efficiency by water cooling: Modelling and experimental approach. Energy 137:798–810. doi:10.1016/j.energy.2017.04.164.
- Selvaraj, J., N. Tharmarajah, M. Faeshol Umam, L. Kumar, M. Hasanuzzaman, N. Abd Rahim, and A. Abdulmuhsen Saleh Basuhaib. 2023. Comparative experimental investigation on front cooling for tempered glass photovoltaic thermal system. Energy Sources Part A: Recovery, Utilization, and Environmental Effects 45 (3):7245–61. doi:10.1080/15567036.2023.2220663.
- Shahjalal, M., T. Shams, M. E. Islam, W. Alam, M. Modak, S. B. Hossain, V. Ramadesigan, M. R. Ahmed, H. Ahmed, A. Iqbal, et al. 2021. A review of thermal management for Li-ion batteries: Prospects, challenges, and issues. Journal of Energy Storage 39:102518. doi:10.1016/j.est.2021.102518.
- Shahsavar, A., A. H. A. Alwaeli, N. Azimi, S. Rostami, K. Sopian, M. Arıcı, P. Estellé, S. Nižetić, A. Kasaeian, H. M. Ali, et al. 2022. Exergy studies in water-based and nanofluid-based photovoltaic/thermal collectors: Status and prospects. Renewable and Sustainable Energy Reviews 168:112740. doi:10.1016/j.rser.2022.112740.
- Shahsavar, A., P. Jha, M. Arıcı, S. Nižetić, and Z. Ma. 2021. Energetic and exergetic performances of a nanofluid-based photovoltaic/thermal system equipped with a sheet-and-grooved serpentine tube collector: Indoor experimental tests. Solar Energy 225:918–33. doi:10.1016/j.solener.2021.08.005.
- Shiradkar, N., R. Arya, A. Chaubal, K. Deshmukh, P. Ghosh, A. Kottantharayil, S. Kumar, and J. Vasi. 2022. Recent developments in solar manufacturing in India. Solar Compass 1:100009. doi:10.1016/j.solcom.2022.100009.
- Shuraiji, A. L., A. Jadallah, and A. Shuraiji. 2022. A-Review for the cooling techniques of PV/T solar air collectors. Engineering and Technology Journal 40 (1):129–36. (1 [Mechanical Engineering]). doi:10.30684/etj.v40i1.2139.
- Skoplaki, E., A. G. Boudouvis, and J. A. Palyvos. 2008. Simple correlation for the operating temperature of photovoltaic modules of arbitrary mounting. Solar Energy Materials & Solar Cells 92 (11):1393–402. doi:10.1016/j.solmat.2008.05.016.
- Soliman, A. M. J. E. 2023. A numerical investigation of PVT system performance with various cooling configurations. Energies 16 (7):3052. doi:10.3390/en16073052.
- Swapnil Dubey, J. N. S. 2013. Temperature dependent photovoltaic (PV) efficiency and its effect on PV production in the world a review. Energy Procedia 33:311–21. doi:10.1016/j.egypro.2013.05.072.
- Swapnil Dubey, J. N. S., J. N. Sarvaiya, and B. Seshadri. 2013. Temperature dependent photovoltaic (PV) efficiency and its effect on PV production in the World – a Review. Energy Procedia 33:311–321. doi:10.1016/j.egypro.2013.05.072.
- Tamuli, B. R., S. Nath, and D. Bhanja. 2022. Performance enhancement of a dual heat pipe array based evacuated tube solar water heater for north eastern India climatic condition: A numerical approach. Applied Thermal Engineering 213:118597. doi:10.1016/j.applthermaleng.2022.118597.
- Taylor, J. R., and W. Thompson. 1982. An introduction to error analysis: The study of uncertainties in physical measurements, Vol. 2. Springer. Mill Valley, CA: University science books.
- Teo, H., P. Lee, and M. J. A. E. Hawlader. 2012. An active cooling system for photovoltaic modules. Applied Energy 90 (1):309–15. doi:10.1016/j.apenergy.2011.01.017.
- Teymori-Omran, M., A. Motevali, S. Reza Mousavi Seyedi, and M. Montazeri. 2021. Numerical simulation and experimental validation of a photovoltaic/thermal system: Performance comparison inside and outside greenhouse. Sustainable Energy Technologies and Assessments 46:101271. doi:10.1016/j.seta.2021.101271.
- Tripanagnostopoulos, Y., T. Nousia, M. Souliotis, and P. Yianoulis. 2002. Hybrid photovoltaic/thermal solar systems. Solar Energy 72 (3):217–34. doi:10.1016/S0038-092X(01)00096-2.
- Trond Bergene, O. M. L., and O. M. Løvvik. 1995. Model calculations on a flat-plate solar heat collector with integrated solar cells. Solar Energy 55 (6):453–62. doi:10.1016/0038-092X(95)00072-Y.
- Tuncer, A. D., A. Sözen, F. Afshari, A. Khanlari, C. Şirin, and A. Gungor. 2020. Testing of a novel convex-type solar absorber drying chamber in dehumidification process of municipal sewage sludge. Journal of Cleaner Production 272:122862. doi:10.1016/j.jclepro.2020.122862.
- Tyagi, V. V., S. C. Kaushik, and S. K. Tyagi. 2012. Advancement in solar photovoltaic/thermal (PV/T) hybrid collector technology. Renewable and Sustainable Energy Reviews 16 (3):1383–98. doi:10.1016/j.rser.2011.12.013.
- Wei, N. T. J., W. J. Nan, and C. Guiping. 2017. Experimental study of efficiency of solar panel by phase change material cooling. in IOP Conference Series: Materials Science and Engineering. Curtin University, Malaysia: IOP Publishing.
- Wongwuttanasatian, T., T. Sarikarin, and A. J. S. E. Suksri. 2020. Performance enhancement of a photovoltaic module by passive cooling using phase change material in a finned container heat sink. Solar Energy 195:47–53. doi:10.1016/j.solener.2019.11.053.
- Yunus Khan, T. M., M. E. M. Soudagar, M. Kanchan, A. Afzal, N. R. Banapurmath, N. Akram, S. D. Mane, and K. Shahapurkar. 2020. Optimum location and influence of tilt angle on performance of solar PV panels. Journal of Thermal Analysis and Calorimetry 141 (1):511–32. doi:10.1007/s10973-019-09089-5.