
 ?Mathematical formulae have been encoded as MathML and are displayed in this HTML version using MathJax in order to improve their display. Uncheck the box to turn MathJax off. This feature requires Javascript. Click on a formula to zoom.
ABSTRACT
Solar irradiance and temperature are two primary factors that affect the energy generation efficiency of solar photovoltaic (PV) systems, meaning that climate change may significantly impact the production of solar energy in the future. In this study, a two-way sensitivity analysis is carried out to determine the energy generation potential under future climate change conditions, and conditions of shadow covering are also considered. The simulation results indicate that the impact of solar irradiance causes the most variation in energy generation, and that shadow covering has a weak impact on the output. In the one-way sensitivity analysis, solar irradiance makes a ± 18% difference in energy generation, whereas shadow covering represents about ± 2%. In the future trend of climate change in the world and Taiwan, the energy generation potential can decrease up to 21% and increase 8%, respectively, mainly corresponded by solar irradiance. We suggest that compared with the issue of temperature, the efficiency of solar irradiance usage is more important, especially in view of the global trend toward solar irradiance loss. Taiwan also suffers the issue, but the different trend of climate change impact may make the challenge different.
Introduction
The realization of net-zero emissions by 2050 is the most important political target for future sustainable development in the Europe (EUR-Lex Citation2018) and even the world (IEA Citation2021), meaning that the promotion of renewable energy is crucial. Of the current types of renewable energy, solar energy systems are the most popular (Rüdiger Citation2019; Schimschar et al. Citation2011) and are commonly installed on rooftops to contribute to energy self-sufficiency (Hernandez and Kenny Citation2010, Citation2011). Solar irradiance datasets are essential when simulating solar energy potential (Suri Citation2019; Šúri et al. Citation2007), and the various angles of illumination (Alrwashdeh, Saraireh, and Al-Saraireh Citation2018) are important. Solar irradiance contributes to the DNI and DHI that activates solar panels and the first and most popular algorithm of calculating these two irradiances is by Perez et al (Citation1987, Citation1988).
TMY data are commonly used to present local meteorological information, such as solar irradiance, and are obtained from long-term data collection processes. Although the data resources, building methods, and calibration models used may vary, the time period covered by the data should be longer than a decade (Sawaqed, Zurigat, and Al-Hinai Citation2005). After adjustment and calibration using an appropriate transposition model, satellite data are suitable for building a TMY database (Han and Vohnicky Citation2022b; Nassar, Hafez, and Alsadi Citation2020). Although the scale of local data is limited, due to the spatial resolution of the satellite image, individual meteorological data for a specific area can be recorded more effectively than when a regional meteorological station is used. This approach helps in understanding the local conditions, and avoids the need to rely on local stations, which may be located far from the observation area.
Buildings exert a shadow effect on solar irradiance. A previous study (Cheng et al. Citation2006) showed that the height and density influence the shadow effect of a building; however, standardizing the effect based only on these two factors may be inappropriate, as the orientation of the solar casting also plays a predominant role. A few previous studies (Izquierdo, Rodrigues, and Fueyo Citation2008; Montavon, Scartezzini, and Compagnon Citation2004) have reported that the impact of the shadowing effect is generally less than 5%, and the validation results in (Li and Han Citation2022) in Taiwan are lower. The shadow effect must therefore be analyzed based on real data that take into account local conditions, in order to carry out precise simulations to quantify the solar energy received on rooftops.
Temperature plays an important role in the energy transfer rate of solar PV panels. The standard energy transfer rate is validated based on the global AM1.5 spectrum (1,000 W/m2) at 25°C (Green et al. Citation2022); as the temperature increases, the energy transfer rate decreases. Solar PV panels can be designed as the infrastructure for energy generation or thermal heating. Since the object of this research focuses on energy generation, the correlation between PV heating system and environmental temperature will not be discussed. In a previous study, an NOCT equation was first developed (Ross and Smokler Citation1986) to establish a relationship between temperature and energy transfer rate, and a linear correlation was found under typical temperature conditions. The NOCT equation determines the cell temperature in an open-circuited module under 80 mW/cm2 insolation, an ambient temperature of 2°C, and a wind velocity of 0.1 m/s. In a recent study (Amelia et al. Citation2016), an empirical experiment was conducted to demonstrate the correlation between the temperature and energy transfer rate, which confirmed the validity of this equation even after 30 years of solar PV cell development. According to the NOCT equation, there is an inversely proportional relationship between temperature and energy transfer rate, meaning that areas with higher solar irradiance, and thus higher temperature, may not be the best choice for a PV system.
Of the indices that have been developed, the building model is the most stable when simulating shadow coverage with regular solar incidence angles (Li and Han Citation2022). When the DNI is blocked, the DHI contributes most of the solar energy to the shadowed area on a rooftop surface. The energy received over this area is lower than for the area in the sun, but temperature also plays a vital role in the energy output. The NOCT equation indicates that solar irradiance is the key factor affecting the cell temperature, and areas without DNI have a better energy transfer rate. This implies that buildings with shadow covering do not necessarily have a reduced energy potential, as the cell temperature affects the energy transfer rate.
In addition to the building model, the solar irradiance and energy transfer rate critically influence the simulation results, and they are affected by climate change (Tahir, Baloch, and Al-Ghamdi Citation2022). Climate change causes difficulties in terms of simulating meteorological data and energy transfer rates. Although the TMY can represent the general conditions of solar irradiance distribution, climate change may reduce the accuracy of future simulations. A previous study (Lean Citation2010) noted that climate change will make forecasting solar irradiance more difficult, and that its impact may vary depending on the location (Gernaat et al. Citation2021) and time period. Another study (Lawin, Niyongendako, and Manirakiza Citation2019) investigated the change in solar irradiance by performing future simulations based on existing data, and reported that the irradiance increased in the first half of the year and decreased in the latter half.
Overall, annual solar irradiance may be lower in the future than at present (Lawin, Niyongendako, and Manirakiza Citation2019; Tahir, Baloch, and Al-Ghamdi Citation2022), although this situation may be reversed in Taiwan owing to its geographical conditions (Gernaat et al. Citation2021). This rate is expected to increase from 5% to 10% over the period 2015–2100, similarly to the solar irradiance (Gernaat et al. Citation2021). Its impact may therefore become more important as climate change and global warming become more severe (Lawin, Niyongendako, and Manirakiza Citation2019).
In the view of the uncertainty associated with future solar irradiance and temperature, a sensitivity analysis can be applied to the simulation. This is a common method of simulating conditions when some factors cannot be predicted, and has become increasingly popular in renewable energy simulations (Khezri, Mahmoudi, and Haque Citation2020; Lu et al. Citation2015). This approach not only helps in making optimal decisions, but also establishes a range of acceptable error values. In addition, a sensitivity analysis can reliably simulate the global trends (Lawin, Niyongendako, and Manirakiza Citation2019; Tahir, Baloch, and Al-Ghamdi Citation2022) and conditions in Taiwan (Gernaat et al. Citation2021) taking into consideration both the positive and negative aspects. Certain range of allowable error values simulated through different level of climate change will help solar PV installers to prepare the development risk. Meanwhile, this can guide the installation of solar PV systems, and can help governments to predict energy potential and assess the likelihood of realizing net zero emissions.
In the present study, we aim to understand how shadow coverage affects energy potential, considering the impact of DNI and cell temperature loss. We also investigate the individual and combined effects of temperature and solar irradiance on the energy potential. Finally, we aim to establish a suitable range of values for the simulation, considering the impacts of climate change.
Methodology
A simulation was carried out based on the Hillshade function of ESRI ArcGIS, which calculates the shadow effect (Hong et al. Citation2017). The level of the shadow effect in this approach varies from 0–255, with zero representing the darkest area and 255 the lightest. EquationEquation 1(1)
(1) was used to calculate the shadow effect, where the key factors are the solar zenith angle (
), tilt inclination angle (
), tilt surface azimuth angle (
), and solar zenith angle (
). Although both the angle and the structure of the PV panel can affect the simulation, we assumed that the PV panel would be installed on a rooftop as described in the rooftop building model.
The Hillshade equation was used to simulate the level of the shadowing effect, although this does not consider solar irradiance. To take into account solar irradiance, we separated it into DNI and DHI. The TMY solar irradiance data, imported from previous research from Han and Vohnicky (Citation2022b), were divided using a separation model developed in another study (Han and Vohnicky Citation2022a). As the DHI is relatively even, only the DNI needed to be considered for due to the shadow effect and the solar irradiance angle proposed by EquationEquation 1(1)
(1) . The solar irradiance data were recorded hourly; we note that a year contains 8,760 h, of which approximately 4,135 h had sunlight. The ASI received in a specific area was calculated using EquationEquation 2
(2)
(2) , where
represents the specific data in time period
(hour), and
(kW) is the solar irradiance in hour
.
We used the LOD1 building model; this is a basic approach that includes the building height and assumes a cubic shape, as evidenced by the floor plan. The building may be assumed to be a certain height per floor (Ko et al. Citation2015), depending on the height resolution. The LOD1 building model used in this study was obtained from the NLSC of the Ministry of the Interior in Taiwan (). Using actual building information, an LOD1 model was built to reflect the real heights of the buildings considered in this study.
Figure 1. Example of an LOD1 building model built by NLSC.
EquationEquation 3(3)
(3) describes the annual energy potential per unit area of rooftop (
), which is derived from the equation for solar power output (Li and Han Citation2022). In the equation,
represents the energy transfer rate (%), with a basic value of 15% (Kouhestani et al. Citation2019), and the unit area (
) is measured in m2.
As is measured under fixed conditions, and the temperature is the key factor with a varying value, EquationEquation 4
(4)
(4) was used to estimate the cell temperature (
), where
represents the ambient temperature. Temperature data from TMY were used as the ambient temperatures. The NOCT value can vary depending on the PV panel cell, although in this case, it was assumed to be 45 (Luque and Hegedus Citation2011). A previous study (Krauter Citation2004) reported that
decreases by 0.4–0.5% per °C. In this study, we assumed that
decreased at a rate of 0.4% per °C, and that this reduction occurred at a
value higher than 25°C (EquationEquation 6
(6)
(6) ). If the value of
for any TMY hourly data period
(
was lower than 25°C (EquationEquation 6
(6)
(6) ),
was assumed to be 15%.
EquationEquation 6(6)
(6) in ESRI ArcGIS represents the percentage of solar irradiance received in each hour. EquationEquations 2
(2)
(2) and Equation3
(3)
(3) define the correlation between solar irradiance and energy potential. In addition, EquationEquations 4
(4)
(4) and Equation6
(6)
(6) represent the connections between the energy transfer rate, solar irradiance, ambient temperature, and cell temperature. To establish a reasonable range for simulating the energy potential, a sensitivity analysis was conducted on the variables in EquationEquations 4
(4)
(4) and Equation6
(6)
(6) . Sensitivity analyses are of three main types, namely one-way, two-way, and multiway analyses, and consider one, two, and multiple variables, respectively. In this study, we considered the variables of temperature and solar irradiance, in view of the potential threat from climate change. The range of the sensitivity analysis was set to ± 20% (Gernaat et al. Citation2021). One-way sensitivity analyses were conducted for these two factors to analyze their independent effects, and a two-way sensitivity analysis was conducted to analyze their combined impact.
Case study
EHI was considered here as a case study. EHIs are defined by Article 3 of the “Regulations for the Management of Setting up Renewable Energy Power Generation Equipment of Power Users above a Certain Contract Capacity in Taiwan” (Ministry of Economic Affairs Taiwan Citation2020), and were the first target group that were forced to install renewable energy equipment due to the higher energy using occupancy in the whole country.
An EHI located in northern Taiwan, with four main buildings and two shorter, smaller building groups, was selected as our case study for the simulation (). shows the 3D building model, and it can be seen that the area is surrounded by buildings, meaning that the rooftops of the shorter units experience shadow effects due to the higher buildings close to them. However, the main buildings of the EHI are of the same height. The rooftop energy potential is expected to be similar, as the heights of the surrounding building are similar to those of the EHI. Areas with and without shadow cover were analyzed separately, to determine their individual impacts on the temperature and solar irradiance and on the simulated energy generation.
Figure 2. Plan of the selected EHI.
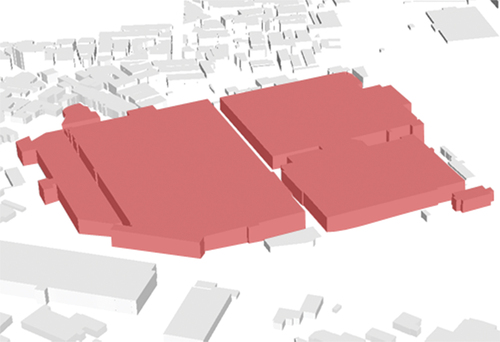
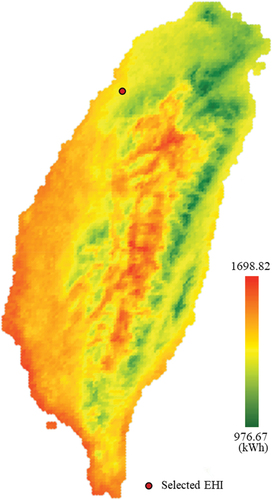
Figure 3. Location of the selected EHI.
presents general information on the selected EHI, including its total area of 80,272 m2 and an annual GHI of 1,346.11 kW/m2. illustrates the distribution of DHI and DNIcosθ values for the hourly data, which were separated using the Erbs separation model (Han and Vohnicky Citation2022a). The figure shows that although DNIcosθ has a higher value, DHI has a higher occupancy for the entire solar irradiance range. This indicates that these areas receive at least half of their solar irradiance under shadow coverage conditions. By considering the solar irradiance and temperature, which are related to the energy transfer rate, we see that areas covered by shadow may contribute more energy than those in full sun.
Figure 4. Distribution of DHI and DNI*cosθ for hourly data (Han and Vohnicky Citation2022a).
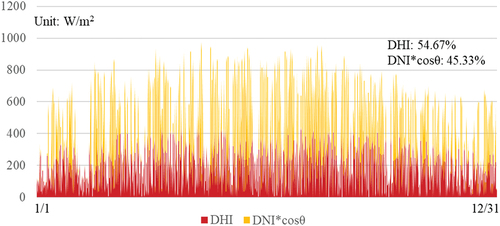
Table 1. Information on the selected EHI.
Results and discussion
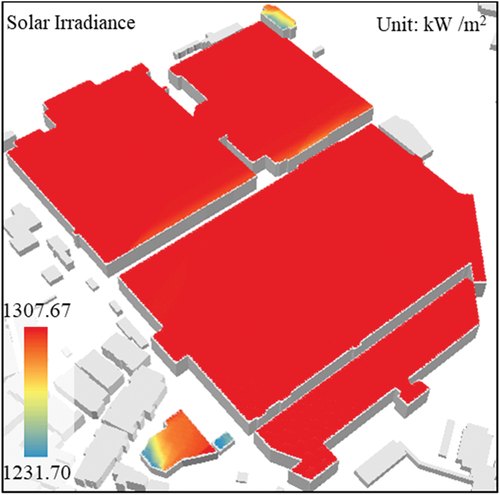
The selected EHI was surrounded by shadow-covered buildings. shows the distribution of over the rooftop area. The four main buildings had less shadow coverage, and most of the impact was observed on the two shorter building groups. For the main building area, shadow coverage could only be observed at the edge of the rooftop, close to the road, at the center of the buildings. In the area with the strongest shadow coverage, there was a total energy loss of approximately 70 kW/m2, approximately 6.17% of the energy received over the area without shadow cover.
Figure 5. Distribution of in the case study area.
When EquationEquation 3(3)
(3) was applied to calculate the solar energy power potential,
may vary depending on the impact of
on each area. illustrates the distribution of the simulated energy potential on the rooftop area. The gap between the highest and the lowest energy potential is 10.73 kWh/m2 (6.23%). The energy potential of the rooftops of the shorter buildings in this EHI was reduced, and so is the solar irradiance receiving. Although show the similar trend, the decreasing of simulated energy potential is quicker than the solar irradiance. Meanwhile, the differential gap is extended from 6.17 to 6.23%. This difference may be contributed by the shadow covering since the shadow covered area has lower solar irradiance and lower
. Shadows from the surrounding buildings or the main building itself could also be identified on the main building; this indicates that visualizing the distribution of the energy potential is necessary for the simulation, not only because this is required for the final results but also because it provides a clearer index, by illustrating the spatial differences.
Figure 6. Locations of the highest and lowest annual solar irradiance and estimated solar energy potential in the case study area.
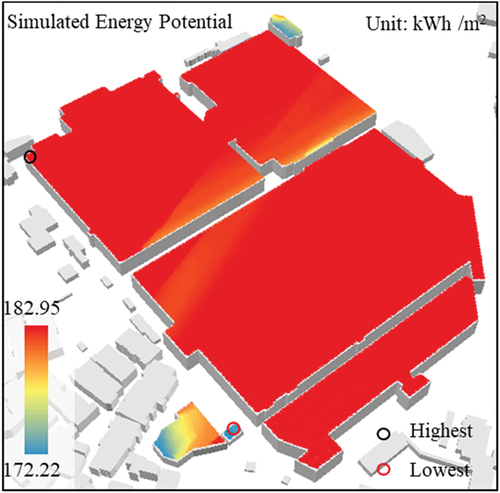
The two rooftop areas in represent the highest and lowest solar energy potentials. The highest and lowest annual values obtained from the simulation for the TMY solar irradiance and temperature were 182.95 and 172.22 kWh/m2, respectively. The areas with the highest and lowest solar irradiance represent conditions without and with shadow covering, respectively.
To study the impact of uncertainty on future solar irradiance and temperature, a simulation was conducted with a variation of ± 20% in the parameter values. present the results of a one-way sensitivity analysis for areas without and with shadow coverage, respectively. It can be seen that the effect of solar irradiance is stronger than that of temperature, with ranges of 81.10% to 118.34% for solar irradiance and 97.89% to 102.03% for temperature. It is obvious that temperature is a less important factor from the perspective of solar energy generation. When comparing the difference between these two shadowing scenarios in the one-way sensitivity analysis, we see that the simulated result made less than 0.01% difference in the ± 20% range. This indicates that shadow coverage affects the energy generation value of rooftop areas, but does not intensify or weaken the impact of solar irradiance or temperature on energy generation.
Table 2. Results of a one-way sensitivity analysis of solar irradiance for energy generation.
Table 3. Results of a one-way sensitivity analysis of temperature for energy generation.
show the results of a two-way sensitivity analysis of the highest and lowest energy generation areas, respectively. show the percentage values for energy generation, obtained by setting the solar irradiance and temperature to 100% as the baseline. It can be seen from the sensitivity analysis results in the ± 20% range that the energy generation output with lower solar irradiance and higher temperature was minimized. Previous meteorological simulations under climate change conditions have indicated that weather conditions in the future may be characterized by higher temperatures and lower solar irradiance. The results from our simulation that fit this global trend due to climate change and the corresponding conditions in Taiwan are highlighted in red and yellow in , respectively. These represent the most probable conditions for the future. The lowest values are found in the red blocks, indicating that climate change may create worse conditions for solar energy. However, the simulated conditions for the rooftop solar PV systems in Taiwan show a benefit from climate change.
Table 4. Results of a two-way sensitivity analysis of areas without shadow covering (units: kWh/m2).
Table 5. Results of a two-way sensitivity analysis of areas with shadow covering (units: kWh/m2).
Table 6. Results of a two-way sensitivity analysis for areas without shadow covering by percentage.
Table 7. Results of a two-way sensitivity analysis for areas with shadow covering by percentage.
In , the results with higher percentages under the same conditions are shown in italics and in bold. A comparison of these results indicates that in the scenario without shadow covering, the percentage loss of energy generation is lower than in the other scenario in the ± 20% range under higher temperatures. Although the maintenance conditions in the shadow-covered area at lower temperatures are generally weak, they showed a reversed result at −20% of the temperature under higher solar irradiance.
The possible energy generation results presented in also show the impact area of the ± 20% sensitivity range. The variation in the columns is smaller than in the rows, indicating that solar irradiance has a stronger influence on energy generation than temperature. summarizes the total solar energy potential for the rooftop of the EHI considered as our case study. It can be seen that although temperature has a relatively weak impact on energy generation compared with solar irradiance, its impact is greater under higher solar irradiance.
Table 8. Results of a two-way sensitivity analysis for the whole area by percentage.
The two-way sensitivity analysis frameworks in these two shadow-covering scenarios shows that the range of energy generation is similar but extends slightly outside of the ± 20% boundary. This suggests that the accelerating impact of solar irradiance and temperature does not cause a remarkable change in the different shadow-covered areas. Although some differences can be observed between for the same situation, the maintenance percentages are very similar. Hence, in the range of ± 20% two-way sensitivity analysis result, the shadow coverage is not a factor that strongly impacts the percentage of energy potential maintenance.
Conclusions
Solar irradiance and temperature affect the solar energy output. Studies have shown that future meteorological conditions may lead to a decrease in solar irradiance and an increase in temperature owing to climate change. To assess the impact of climate change and to quantify the range of acceptable error values, a sensitivity analysis was applied to the simulated energy generated under future conditions. To ensure accuracy, an area within ± 20% for temperature and solar irradiance, which were imported as standard values from the TMY data, was considered in the simulation.
The GHI is the key factor contributing to the cell temperature of solar PV systems. The GHI in the case study EHI area was found to be contributed by DHI in 54.67% and DNI with cosθ in 45.33%. This shows that areas with shadow coverage over the entire year may still receive more than half of the total solar irradiance. However, the differences between areas without and with shadow coverage, in terms of received solar irradiance and energy generation, were found to be 6.17% and 6.23%, respectively. These results indicate that although shadow covering may affect the temperature of the rooftop surface, its impact is not strong enough to make a huge difference in the energy generated.
Separate sensitivity analyses of solar irradiance and temperature in the ± 20% range showed that solar irradiance caused a change in output of approximately ± 18%, whereas the temperature contributed roughly ± 2% in both shadow coverage scenarios. This means that solar irradiance is the decisive factor for solar energy generation, and that the impact of temperature is limited. A two-way sensitivity analysis of solar irradiance and temperature showed a similar variance, reaching approximately ± 21%. This two-way sensitivity analysis did not show an obvious difference between the two shadow coverage scenarios, and solar irradiance still played a leading role in energy generation compared with temperature. Hence, compared to changes in temperature, the variance in solar irradiance is the key issue that should be of concern.
In the context of potential global climate change, this study has simulated the possible future range of energy generation for the expected global trajectory and that of Taiwan. Our results indicate a decrease in the energy potential, owing to the potential loss of solar irradiance and an increase in temperature. However, this condition is reversed in Taiwan owing to the geographical features of the country, as this region is likely to receive more solar irradiance in the future. Our research shows that temperature has limited impact on energy generation, even under conditions of global warming. However, Taiwan has a strong potential for solar energy generation even though climate change may decrease the total energy potential.
Abbreviation
| ASI | = | Annual solar irradiance |
| DNI | = | Direct normal irradiance |
| DHI | = | Diffuse horizontal irradiance |
| GHI | = | Global horizontal irradiance |
| EHI | = | Energy-heavy industry |
| LOD | = | Level of detail |
| NOCT | = | Nominal operating cell temperature |
| NLSC | = | National Land Surveying and Mapping Center |
| PV | = | Photovoltaic |
| TMY | = | Typical meteorological year |
Disclosure statement
No potential conflict of interest was reported by the author(s).
Additional information
Funding
Notes on contributors
Jen-Yu Han
Jen-Yu Han is the professor in the department of civil engineering at National Taiwan University, Taiwan. He received his B.S. and M.S. degree from the department of civil engineering, National Taiwan University, Taiwan and received his Ph.D. degree from School of Civil Engineering, Purdue University. His research interests are applied satellite geodesy, deformation analysis, time-variant terrestrial reference frame, and integrated analysis of hybrid spatial information.
Sin-Yi Li
Sin-Yi Li is currently a Ph.D. student in the department of civil and industrial engineering at Uppsala University. He received his B.S. and M.S. degree from the department of urban planning, National Cheng Kung University, Taiwan and Msc planning from the University of Manchester. His research interest are urban renewable energy and building life-cycle energy analysis.
References
- Alrwashdeh, S., M. A. Saraireh, and F. Al-Saraireh. 2018. Solar radiation map of Jordan governorates. International Journal of Engineering & Technology 7 (3):1664. doi:10.14419/ijet.v7i3.15557.
- Amelia, A. R., Y. M. Irwan, W. Z. Leow, M. Irwanto, I. Safwati, and M. Zhafarina. 2016. Investigation of the effect temperature on photovoltaic (PV) panel output performance. International Journal on Advanced Science, Engineering and Information Technology 6 (5):682–88. doi:10.18517/ijaseit.6.5.938.
- Cheng, V., K. Steemers, M. Montavon, and R. Compagnon. 2006. Urban form, density and solar potential. PLEA 2006 - 23rd International Conference on Passive and Low Energy Architecture, Conference Proceedings, Geneva, Switzerland, September, 6–8.
- EUR-Lex. 2018. European directive on the energy performance of buildings (2010/31/EU) and on energy efficiency (2012/27/EU) (2018/844/EU). Official Journal of the European Union 6:75–91. https://eur-lex.europa.eu/eli/dir/2018/844/oj.
- Gernaat, D. E. H. J., H. S. de Boer, V. Daioglou, S. G. Yalew, C. Müller, and D. P. van Vuuren. 2021. Climate change impacts on renewable energy supply. Nature Climate Change 11 (2):119–25. doi:10.1038/s41558-020-00949-9.
- Green, M. A., E. D. Dunlop, J. Hohl-Ebinger, M. Yoshita, N. Kopidakis, K. Bothe, D. Hinken, M. Rauer, and X. Hao. 2022. Solar cell efficiency tables (Version 60). Progress in Photovoltaics: Research and Applications 30 (7):687–701. doi:10.1002/pip.3595.
- Han, J.-Y., and P. Vohnicky. 2022a. Estimation of global and diffuse horizontal irradiance by machine learning techniques based on variables from the heliosat model. Journal of Cleaner Production 371 (July):133696. doi:10.1016/j.jclepro.2022.133696.
- Han, J.-Y., and P. Vohnicky. 2022b. An optimized approach for mapping solar irradiance in a mid-low latitude region based on a site-adaptation technique using Himawari-8 satellite imageries. Renewable Energy 187:603–17. doi:10.1016/j.renene.2022.01.027.
- Hernandez, P., and P. Kenny. 2010. From net energy to zero energy buildings: Defining life cycle zero energy buildings (LC-ZEB). Energy and Buildings 42 (6):815–21. doi:10.1016/j.enbuild.2009.12.001.
- Hernandez, P., and P. Kenny. 2011. Development of a methodology for life cycle building energy ratings. Energy Policy 39 (6):3779–88. doi:10.1016/j.enpol.2011.04.006.
- Hong, T., M. Lee, C. Koo, K. Jeong, and J. Kim. 2017. Development of a method for estimating the rooftop solar photovoltaic (PV) potential by analyzing the available rooftop area using hillshade analysis. Applied Energy 194:320–32. doi:10.1016/j.apenergy.2016.07.001.
- IEA. (2021). Net zero by 2050: A roadmap for the global energy sector. International Energy Agency. https://iea.blob.core.windows.net/assets/deebef5d-0c34-4539-9d0c-10b13d840027/NetZeroby2050-ARoadmapfortheGlobalEnergySector_CORR.pdf
- Izquierdo, S., M. Rodrigues, and N. Fueyo. 2008. A method for estimating the geographical distribution of the available roof surface area for large-scale photovoltaic energy-potential evaluations. Solar Energy 82 (10):929–39. doi:10.1016/j.solener.2008.03.007.
- Khezri, R., A. Mahmoudi, and M. H. Haque. 2020. Optimal capacity of Solar PV and battery storage for Australian grid-connected households. IEEE Transactions on Industry Applications 56 (5):5319–29. doi:10.1109/TIA.2020.2998668.
- Kouhestani, F. M., J. Byrne, D. Johnson, L. Spencer, P. Hazendonk, and B. Brown. 2019. Evaluating solar energy technical and economic potential on rooftops in an urban setting: The city of Lethbridge, Canada. International Journal of Energy and Environmental Engineering 10 (1):13–32. doi:10.1007/s40095-018-0289-1.
- Ko, L., J. C. Wang, C. Y. Chen, and H. Y. Tsai. 2015. Evaluation of the development potential of rooftop solar photovoltaic in Taiwan. Renewable Energy 76:582–95. doi:10.1016/j.renene.2014.11.077.
- Krauter, S. 2004. Increased electrical yield via water flow over the front of photovoltaic panels. Solar Energy Materials and Solar Cells 82 (1–2):131–37. doi:10.1016/j.solmat.2004.01.011.
- Lawin, A. E., M. Niyongendako, and C. Manirakiza. 2019. Solar irradiance and temperature variability and projected trends analysis in Burundi. Climate 7 (6):1–20. doi:10.3390/CLI7060083.
- Lean, J. L. 2010. Cycles and trends in solar irradiance and climate. Wiley Interdisciplinary Reviews: Climate Change 1 (1):111–22. doi:10.1002/wcc.18.
- Li, S. Y., and J. Y. Han. 2022. The impact of shadow covering on the rooftop solar photovoltaic system for evaluating self-sufficiency rate in the concept of nearly zero energy building. Sustainable Cities and Society 80 (September 2021):103821. doi:10.1016/j.scs.2022.103821.
- Luque, A., and S. Hegedus. 2011. Handbook of Photovoltaic Science and Engineering. Eds. A. Luque and S. Hegedus. 2nd ed. West Sussex, United Kingdom: A John Wiley and Sons, Ltd.
- Lu, Y., S. Wang, C. Yan, and K. Shan. 2015. Impacts of renewable energy system design inputs on the performance robustness of net zero energy buildings. Energy 93:1595–606. doi:10.1016/j.energy.2015.10.034.
- Ministry of Economic Affairs Taiwan. 2020. Legislative Yuan of the Republic of China. Taiwan.
- Montavon, M., J. Scartezzini, and R. Compagnon. 2004. Solar energy utilisation potential of three different swiss urban sites. Schweizerisches Status-Seminar, September, 503–10.
- Nassar, Y. F., A. A. Hafez, and S. Y. Alsadi. 2020. Multi-factorial comparison for 24 distinct transposition models for inclined surface solar irradiance computation in the state of Palestine: A case study. Frontiers in Energy Research 7:7. doi:10.3389/fenrg.2019.00163.
- Perez, R., R. Seals, P. Ineichen, R. Stewart, and D. Menicucci. 1987. A new simplified version of the perez diffuse irradiance model for tilted surfaces. Solar Energy 39 (3):221–31. doi:10.1016/S0038-092X(87)80031-2.
- Perez, R., R. Stewart, R. Seals, and T. Guertin. 1988. The development and verification of the Perez diffuse radiation model. SAND88-7030 ON: DE89002469, Sandia National Lab. (SNL-NM), Albuquerque, NM (United States); State Univ. of New York, Albany (USA). Atmospheric Sciences Research Center, USA.
- Ross, R. G., Jr., and M. I. Smokler. 1986. Electricity from photovoltaic solar cells: Flat-Plate Solar Array Project final report. JPL Publication 86-31, 5101-289, DOE/JPL 1012-125, Jet Propulsion Laboratory for the U.S. Department of Energy, USA.
- Rüdiger, M. 2019. From import dependence to self-sufficiency in Denmark, 1945−2000. Energy Policy 125 (October 2018):82–89. doi:10.1016/j.enpol.2018.10.050.
- Sawaqed, N. M., Y. H. Zurigat, and H. Al-Hinai. 2005. A step-by-step application of Sandia method in developing typical meteorological years for different locations in Oman. International Journal of Energy Research 29 (8):723–37. doi:10.1002/er.1078.
- Schimschar, S., K. Blok, T. Boermans, and A. Hermelink. 2011. Germany’s path towards nearly zero-energy buildings-Enabling the greenhouse gas mitigation potential in the building stock. Energy Policy 39 (6):3346–60. doi:10.1016/j.enpol.2011.03.029.
- Suri, M. 2019. Global solar Atlas 2.0 : Validation report. The World Bank Group.
- Šúri, M., T. A. Huld, E. D. Dunlop, and H. A. Ossenbrink. 2007. Potential of solar electricity generation in the European Union member states and candidate countries. Solar Energy 81 (10):1295–305. doi:10.1016/j.solener.2006.12.007.
- Tahir, F., A. A. B. Baloch, and S. G. Al-Ghamdi. 2022. Impact of climate change on solar monofacial and bifacial Photovoltaics (PV) potential in Qatar. Energy Reports 8:518–22. doi:10.1016/j.egyr.2022.02.197.