
Abstract
Purpose:
Optimal nutritional support in childhood cancer relies on the adequate provision of energy. This study investigated the impact of chemotherapy on resting energy expenditure (REE) during the first six months of treatment and the accuracy of predictive equations in calculating said requirements of newly diagnosed children with cancer.
Methods:
REE was measured at diagnosis utilising a validated bioelectrical impedance analysis (BIA) mobile unit and compared with three predictive equations (Schofield 1985, World Health Organization [WHO] 1985 and the Recommended Dietary Allowance [RDA] 1989). Agreement and accuracy of these equations were tested by determining bias and agreement rates and displayed using the Bland–Altman plot. Baseline values were plotted against monthly follow-up measurements over time. Statistical significance was 5% and a priori limits of agreement set between 90% and 110% of measured REE.
Results:
Forty-three newly diagnosed children with median age 4 years (IQR 2.0–7.6) were measured prior to chemotherapy initiation. Compared with measured REE (mean ± SD) 719.53 ± 206.29 kcal/day, all predictive equations significantly overestimated REE: WHO 1985 (889.75 ± 323.31 kcal/day; 23% overestimation), Schofield 1985 (899.62 ± 336.10 kcal/day; 25% overestimation) and RDA (1647.67 ± 481.06 kcal/day; 129% overestimation) (p < 0.001). Despite significant proportionate bias in all three equations (p < 0.001), the intra-class consistency coefficient showed good reliability for the Schofield 1985 (0.864) and WHO 1985 (0.849) equations. Though statistically significant (chi-square = 23.11, p < 0.003), the overall 1 kcal/kg (1.3%) increase for all cancer types at six months may not be clinically significant.
Conclusion:
Existing predictive equations are unable to calculate REE accurately at childhood cancer diagnosis, highlighting the need for future investigations into the development of cancer-specific equations.
Introduction
Energy imbalance is common in paediatric disease states, leading to either malnutrition or excessive weight gain.Citation1 The adequate provision of energy and protein requirements in children is therefore essential to sustain rapid growth and development during the first phases of the life cycle.Citation2,Citation3 In the child with cancer, both over- and underfeeding may have severely detrimental effects on health-related quality of life and survival,Citation4 hence the most important focus of care is arguably the emphasis on the promotion of optimal nutritional support during therapy.Citation3,Citation5 The accurate determination of energy requirements as a basis for such nutritional interventions may facilitate a positive energy and nitrogen balance, aiding optimal growth and development despite the presence of cancer, its treatment and their related side effects.Citation3,Citation5–7
Metabolic changes in the cancer population may include variations in energy expenditure, with the widespread belief that all cancer patients are hypermetabolic.Citation8 For this reason indirect calorimetry (IC) is regarded as the gold standard for determining resting energy expenditure (REE) by measuring oxygen and carbon dioxide concentrations during respiratory gas exchange and recommended for use in patient populations at risk for hypo- or hypermetabolism such as children with cancer.Citation9,Citation10 However, the practicality of implementing the test, as well as the costs involved, limits its use in the paediatric setting.Citation6,Citation11 In the absence of IC, a child’s total daily energy requirements may be determined by adding estimated REE to energy associated with physical activity, thermogenesis and growth.Citation7 Several practical predictive equations have consequently been derived from healthy populations utilising variables including age, gender, weight and height for the calculation of REE.Citation8 Popular predictive equations, namely the Schofield (weight, height),Citation12 World Health Organization (WHO) 1985Citation13 and recommended dietary allowance (RDA) 1989,Citation14 are used regularly to calculate the energy requirements for both healthy and sick patients. Speculation regarding the accuracy of their predictive values has been on the forefront of research enquiries in recent years, especially in light of the child with chronic illness.Citation9,Citation11,Citation15,Citation16 However, scant information is available regarding this topic in the child with cancer.Citation6,Citation7
This study investigated the impact of chemotherapy exposure on the REE of children newly diagnosed with cancer during the first six months of intensive chemotherapy and whether predictive equations are able to accurately estimate such requirements at diagnosis as a basis for nutritional interventions.
Methods
Study design
Newly diagnosed participants presenting at the paediatric oncology unit at Tygerberg Hospital, Cape Town for the period April 2019–January 2020 were recruited after obtaining written consent and assent from all caregivers and participants aged seven years and older. Those requiring exclusive radiotherapy or surgical interventions were excluded. Enrolled participants were followed up monthly from diagnosis for the remainder of their individual intensive therapy regimens up to a maximum of six months. This prospective, descriptive cohort study was performed in line with the principles of the Declaration of Helsinki and approved by the University of Stellenbosch`s Health and Research Ethics Committee (S18/04/050).
Data collection
Demographic data (date of birth, age, sex), cancer diagnosis and each participant`s respective chemotherapy regimens were collected at diagnosis. Baseline anthropometrical status, body composition and REE were measured within 72 hours of diagnosis prior to the initiation of chemotherapy, utilising standardised protocols and the validated S10 InBody bio-electrical impedance (BIA) mobile unit (InBody Co Ltd, Korea).Citation17,Citation18 During the same reading to determine body composition, the BIA equipment simultaneously determined REE (pre-programmed with the Cunningham equation 1991).Citation19 Measured REE was expressed in kcal/day and compared with calculated energy requirements from other age- and sex-based paediatric predictive formulae at baseline only: Schofield 1985 (weight, height)Citation12 equation, WHO 1985Citation13 equation and the recommended dietary allowance (RDA) 1989 equationsCitation14 (). Predicted values between 90% and 110% of measured values were considered clinically acceptable.Citation7,Citation16 Patterns of change over time were assessed by comparing monthly follow-up measurements with baseline values.
Table 1: Calculations used to determine resting energy expenditureCitation12–14,Citation19
Data analysis
REE at diagnosis, as well as changes and associations between baseline and follow-up measurements, were identified utilising both inferential and basic descriptive statistics. Baseline data and trends in change over time were expressed in absolute values (kcal/day) and reported according to median (interquartile range [IQR]), mean ± standard deviation (SD) and percentage change where appropriate. The Friedman rank test (non-parametric) compared median variable values between diagnosis and the end of follow-up (month five) and per cancer group (haematological malignancies and solid tumours). Bootstrap multiple comparisons furthermore addressed the small sample size and the non-normality of the data distribution and compared interaction means from the RMANOVA between months (each month) and cancer groups. Intra-class correlations for agreement and consistency, as well as Bland–Altman plots, were used to investigate the agreement and accuracy of predictive equations when compared with the measured baseline REE.Citation20,Citation21 Statistical significance for the agreement analysis was 5% and a priori levels of the clinically accepted limits of agreement were set at 10%.Citation7,Citation16 Data were analysed using the STATISTICA (version 13, TIBCO Software Inc.) data analysis software system.
Results
Forty-three participants aged 3 months to 15 years (median age 4 years; IQR 2.0–7.6) with a variety of haematological malignancies (53%) and solid tumours (47%) participated in the study (). The male:female ratio was 1:09.
Table 2: General patient characteristics
REE at diagnosis and the accuracy of predictive equations
Measured REE for all cancer types at baseline included a median of 650 kcal/day (IQR 579–804 kcal/day) and a mean ± SD of 719.53 ± 206.29 kcal/day within a wide range of 476–1387 kcal/day. As summarised in , a large difference was seen when comparing measured REE with predicted values, despite the strong correlation between them (p < 0.001). All three equations overestimated REE with the WHO (23.6%) faring the best and the RDA (129.0%) the worst. Although intra-class agreement was moderate to poor for all equations, the intra-class consistency coefficient showed good reliability for the Schofield 1985 (0.864) and WHO 1985 (0.849) equations.
Table 3: Variance and agreement between measured and predicted REE values at diagnosis
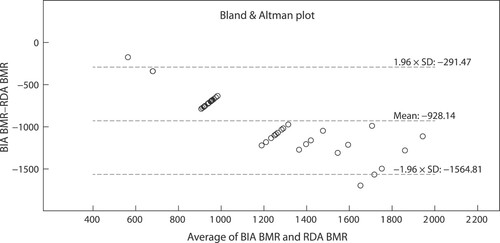
The Bland–Altman plots () depict the significant differences and proportionate bias between measured REE (mean ± SD), WHO 1985, Schofield 1985 and RDA 1989 (p < 0.001 respectively). The proportionate bias of the WHO 1985 equation (−170.2 ± 149.0 kcal/day) () was lower than both the Schofield 1985 (−180.1 ± 145.7 kcal/day) () and RDA (−928.1 ± 324.8 kcal/day) () equations. Coupled with the large variance between measured and predicted REE all three equations exceeded the 90–110% limits of minimal clinically accepted agreements, rendering these predictive equations inaccurate for use in the clinical setting. Only nine (Schofield 1985, WHO 1985) and three (RDA 1989) participants respectively fell within the 90–110% clinically accepted limits of agreement.
Figure 1: Agreement between measured basal metabolic rate and the Schofield 1985 equation. BIA: bioelectrical impedance analysis; BMR: basal metabolic rate.
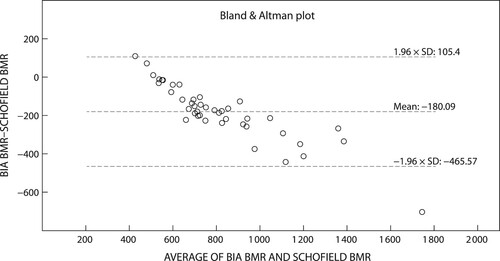
Figure 2: Agreement between measured basal metabolic rate and the WHO 1985 equation. BIA: bioelectrical impedance analysis; BMR: basal metabolic rate; WHO: World Health Organization.
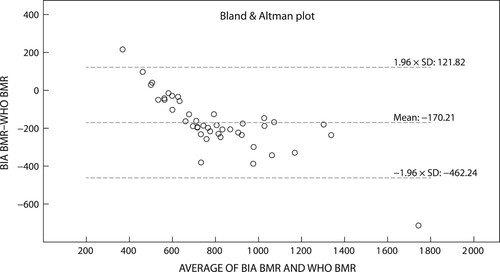
Figure 3: Agreement between measured basal metabolic rate and the RDA 1989 equation. BIA: bioelectrical impedance analysis; BMR: basal metabolic rate; RDA: recommended dietary allowance.
Changes in REE over time
The study population experienced several changes in measured REE over time (). A 20 kcal/day (3%) decrease in median REE was seen during the first two months of treatment for all cancer types, which increased during month three and five to end with a significant increase of 16 kcal/day (2.5%) at month five (chi-square = 23.11, p < 0.003). When converted to kcal/kg in relation to the participant`s diagnosis weights, these trends translate to a 1.3 kcal/kg (3.2%) decrease and 1 kcal/kg (2.4%) increase respectively, which is not clinically significant during the calculation of energy requirements. Patterns of change varied among cancer diagnosis and the haematological malignancy group, despite their 64 kcal/day (9.4%) lower baseline REE, experienced a gradual monthly increase ending in a significant overall 33 kcal/day (5.3%) increase by month five (chi-square = 11.79, p = 0.038). In contrast, the solid tumours experienced an initial decrease in median REE of 45 kcal/day (6.6%) followed by a rapid 64 kcal/day (10%) increase during month three to end in an excess of 15 kcal/day (2%) of baseline values (chi-aquare = 14.23, p = 0.014). Despite the variation in trends over time, bootstrap multiple comparisons confirmed there was no significant monthly difference in measured REE between cancer types (data not shown).
Table 4: Changes in median resting energy expenditure over time
Discussion
Our findings illustrate the inability of commonly used predictive equations to calculate REE at childhood cancer diagnosis. Though an overall overestimation, significant bias and moderate to poor agreement was present for all three equations; both the WHO 1985 and Schofield 1985 (weight, height) proved more reliable for resting energy calculations than the RDA 1989 equation. Changes in REE were observed after chemotherapy initiation for all cancer types, which, albeit statistically significant, may be deemed negligible during energy calculations. No significant monthly difference was found between cancer types despite the varied response to treatment over time.
The debate regarding the potential for increased resting metabolic rate in children with cancer remains ongoing. Den Broeder et al. showed that the Schofield (weight) equation underestimated REE as measured by IC by 3–21% at diagnosis, proposing the addition of a factor of 1.0–1.2 during the first two courses of chemotherapy to compensate for the suggested increased energy demand from the tumour during this time.Citation7 In contrast, Galati et al. found no difference in REE as measured by IC between their oncology patient groups (solid tumour, non-solid tumour and all cancer types) and their healthy age- and sex-matched controls. Their study population was therefore not considered to be hyper-metabolic and there was no need to adjust requirements for the presence of cancer.Citation6 Our results, however, concur with those of Brinksma et al. by reiterating that the RDA severely overestimated the REE in their mixed cancer population and was not applicable to REE calculations due to their lower activity levels and poor appetite.Citation2 Although originally developed to include an activity factor of 1.7 for healthy, ambulant children,Citation14 it may be better suited for catch-up growth than resting energy requirements.
Our findings furthermore demonstrate a mere 1–1.3 kcal/kg fluctuation in REE over the six-month period, which may in turn influence the accuracy of energy calculations based on static predictive equations. When compared with existing short methods for bedside calculations in healthy infants (100–120 kcal/kg),Citation22 these changes may appear small, especially in younger children, and may be deemed negligible. Previous studies also reported changes in REE, describing brief increases in acute lymphoblastic leukaemia (with high-risk disease) for the first 14–30 days, after which REE returned to baseline values.Citation9,Citation23 Similarly, Den Broeder et al. found that their solid tumour population also demonstrated an initial increase in REE followed by a prompt reduction after two to four courses of chemotherapy to match those predicted by Schofield (weight).Citation7 Because cancer patients have lower levels of activity, an increased resting energy metabolic rate might not necessarily equate to a higher total energy expenditure and may indeed be negated with lower activity levels.Citation7,Citation24 Galati et al. did not report changes in REE over time, but their results included randomly selected patients of all cancer types regardless of the phase of treatment.Citation6 Their findings could be relevant to our current investigation as they inadvertently demonstrated no change in REE at any given time point after treatment was commenced.Citation6
The illustrated deviations between measured REE and predicted values among our study populations may result from the various methodologies, technical differences in experimental conditions and predictive equations used.Citation6,Citation7,Citation11 Additionally, the metabolic turnover of the child with cancer is influenced by a host of factors such as age, sex, altered body compartments, ethnicity, hormones, the environment (temperature) and levels of physical activity.Citation5,Citation6,Citation11,Citation15 Of these factors, age, sex and nutritional status at diagnosis may cause the greatest variation in measured REE.Citation5,Citation6,Citation11 However, the proportionate bias found in our study population showed that the equations consistently misjudged measured REE at the same rate despite large age gaps in our sample. Varied patterns of change in REE may also be linked to cancer diagnosis, stage of cancer and accompanying treatment regimen,Citation7 yet no statistical difference was found among our cancer groups. Rather, our initial decrease as exhibited by the solid tumours may be directly linked to their increased risk for malnutrition and functional losses as established by adult and paediatric findings.Citation6,Citation8 This concurs with the deduction of Sanner et al. that the dynamic development of energy requirements is related to changes in anthropometric and body composition status.Citation5
As REE, the largest component of total energy expenditure, is mainly influenced by metabolically active organ tissues contained within fat free mass (FFM),Citation3,Citation9,Citation25 changes in REE reflect a close association with changes in weight, body composition and energy imbalance.Citation26 This may affect the metabolic rate of children with cancer, who are particularly vulnerable to FFM depletion during the first three months of treatment.Citation24 Similarly, the degree of sarcopenia found in children with anorexia nervosa and the extent of muscle loss in children with cerebral palsy was also correlated with variations in REE and inaccurate energy predictions as supplied by predictive equations.Citation9 Anthropometric variables (weight, height) employed by commonly used equations do not reflect underlying body composition, thereby limiting their accuracy and predictability.Citation9 For this reason it is suggested that energy calculations instead be based on lean size rather than weight, as relatively normal weight may conceal underlying changes in body composition.Citation1 The accurate measure of body composition and FFM is therefore crucial to detect metabolic changes in ill patients when determining energy expenditure in resting conditions.Citation27
Changes in REE are consequently best interpreted in conjunction with changes in body composition, whilst affording clinicians additional insights into the equally important timing of nutritional interventions from as early as diagnosis. For this purpose, a mobile device such as BIA is ideal as it is child-friendly, cost-effective and yields rapid bedside results. The InBodyS10 employs the Cunningham equation, which utilises FFM to derive REE,Citation19 limiting the generalisability of our result interpretation as we were unable to compare our findings with IC. Despite such limitations, the use of BIA and the Cunningham equation and their ability to incorporate patterns of change in functional tissues may be preferred over weight-based formulas.Citation25 Energy intake should match a patient’s energy requirementsCitation24 to attain a positive energy balance to sustain growth despite their chronic disease state.Citation6 The use of IC remains ideal, yet practical challenges with regard to its use in children, coupled with poor access to such devices, leads to the continued use of predictive equations despite their reported inaccuracy.Citation6,Citation9 Some have endeavoured to formulate new population and disease-specific equations,Citation10,Citation27 but there is no alternative for paediatric cancer as yet. Limited by our small sample, this study highlights the need for further investigations within a larger sample size that allow for stratification of age, sex and cancer type to find suitable equations for children with cancer.
However, in the absence of IC, such predictive formulae may be used as a starting point from which to calculate requirements.Citation15 In our sample the WHO and Schofield (weight, height) proved more reliable for baseline REE calculations, with no need to adjust for activity or cancer-specific stress factors. The RDA could therefore rather be considered for the calculation of catch-up growth requirements. Energy requirements may then be titrated over time according to each child`s clinical progress in conjunction with monthly anthropometric and body composition assessments from which to anticipate fluctuations in resting energy needs.
Conclusion
A clear need exists for future investigations into the development of paediatric cancer-specific energy equations, as current existing predictive equations may not accurately calculate REE at childhood cancer diagnosis.
Author contribution
I Kellerman, M Kruger and R Blaauw conceptualised the study. I Kellerman developed the protocol, collected the data, analysed the data, and wrote the manuscript. M Kruger and R Blaauw critically reviewed the manuscript and contributed to the data analysis. J Schoeman critically reviewed the manuscript.
Acknowledgements
The authors would like to offer a special note of thanks for the invaluable statistical insights of Prof. D G Nel and the unwavering support from doctor R Uys during the period of data collection.
Disclosure statement
No potential conflict of interest was reported by the authors.
Additional information
Funding
References
- Wells JCK. Body composition in childhood: effects of normal growth and disease. Proc Nutr Soc. 2003;62:521–8. https://doi.org/10.1079/PNS2003261
- Brinksma A, Roodbol PF, Sulkers E, de Bont ESJM, Burgerhof JGM, Tamminga RYJ, et al. Finding the right balance: An evaluation of the adequacy of energy and protein intake in childhood cancer patients. Clin Nutr. 2015;34(2):284–90. https://doi.org/10.1016/j.clnu.2014.04.008
- Ringwald-Smith K, Williams R, Mackert P, Stricklin L, Sargent T, Bowman L. Comparison of energy estimation equations with measured energy expenditure in obese adolescent patients with cancer. Vol. 99, J Am Diet Assoc. 1999. p. 844–8. https://doi.org/10.1016/S0002-8223(99)00199-6
- Triarico S, Rinninella E, Cintoni M, Capozza MA, Mastrangelo S, Mele MC, et al. Impact of malnutrition on survival and infections among pediatric patients with cancer: A retrospective study. Eur Rev Med Pharmacol Sci. 2019;23(3):1165–75.
- Sanner N, Wallace B. Acute and chronic nutrition considerations in pediatric oncology. Top Clin Nutr. 2012;27(3):305–14. https://doi.org/10.1097/TIN.0b013e3182628d84
- Galati PC, Resende CMM, Salomão RG, Scridelli CA, Tone LG, Monteiro JP. Accurate determination of energy needs in children and adolescents with cancer. Nutr Cancer. 2011;63(2):306–13. https://doi.org/10.1080/01635581.2011.523505
- Den Broeder E, Oeseburg B, Lippens RJJ, Van Staveren WA, Sengers RCA, Van’t Hof MA, et al. Basal metabolic rate in children with a solid tumour. Eur J Clin Nutr. 2001;55(8):673–81. https://doi.org/10.1038/sj.ejcn.1601199
- Galati PC, Chiarello PG, Simões BP. Variation of resting energy expenditure after the first chemotherapy cycle in acute leukemia patients. Nutr Cancer. 2016;68(1):86–93. https://doi.org/10.1080/01635581.2016.1115100
- Carpenter A, Pencharz P, Mouzaki M. Accurate estimation of energy requirements of young patients. J Pediatr Gastroenterol Nutr. 2015;60(1):4–10. https://doi.org/10.1097/MPG.0000000000000572
- Mtaweh H, Tuira L, Floh AA, Parshuram CS. Indirect calorimetry: history, technology, and application. Front. Pediatr. 2018;6:257. https://doi.org/10.3389/fped.2018.00257
- Butte NF. Energy requirements of infants. Public Heal Nutr. 2005;8(7A):953–67. https://doi.org/10.1079/PHN2005790
- Schofield WN. Predicting basal metabolic rate, new standards and review of previous work. Hum Nutr Nutr. 1985;39C(1):5–41.
- Energy and protein requirements. Vol. NO. 724, FAO/WHO/UNU Expert Consultation, World Health Organization – Technical Report Series. 1985.
- Food and Nutrition Board. Recommended dietary allowances. In: Peter FM, editor. Food and nutrition board, commission on life sciences, national research council. 10th Edition. Washington, DC: National Academy Press; 1989. 16 p.
- Reilly JJ, Evans TJ, Wilkinson J, Paton JY. Adequacy of clinical formulae for estimation of energy requirements in children with cystic fibrosis. Arch Dis Child. 1999;81(2):120–4. https://doi.org/10.1136/adc.81.2.120
- Tan SY, Poh BK, Jamal R, Noor IM. Predicting energy requirements of pediatric patients with disease: which methods are appropriate? Ped Health. 2010;4(5):479–89. https://doi.org/10.2217/phe.10.51
- InBody. Inbody S10 User Manual [Internet]. 2010. p. 1–78. Available from: www.Inbody.com (accessed: 10 March 2019)
- Lim JS, Hwang JS, Lee JA, et al. Cross-calibration of multi-frequency bioelectrical impedance analysis with eight-point tactile electrodes and dual-energy X-ray absorptiometry for assessment of body composition in healthy children aged 6–18 years. Pediatr Int. 2009;51(2):263–8. https://doi.org/10.1111/j.1442-200X.2008.02698.x
- Cunningham JJ. Body composition as a determinant of energy expenditure: A synthetic review and a proposed general prediction equation. Am J Clin Nutr. 1991;54(6):963–9. https://doi.org/10.1093/ajcn/54.6.963
- Koo TK, Li MY. A guideline of selecting and reporting intraclass correlation coefficients for reliability research. J Chiropr Med. 2016;15(2):155–63. https://doi.org/10.1016/j.jcm.2016.02.012
- Bland JM, Altman DG. Statistical methods for assessing agreement between two methods of clinical measurement. Int J Nurs Stud. 2010;47(8):931–6. https://doi.org/10.1016/j.ijnurstu.2009.10.001
- Shaw V, Lawson M, editors. Clinical paediatric dietetics. 3rd ed. Oxford: Blackwell Publishing; 2007.
- Picton SV. Aspects of altered metabolism in children with cancer. Int J Cancer. 1998;78(SUPPL. 11):62–4.
- Brinksma A, Roodbol PF, Sulkers E, et al. Changes in nutritional status in childhood cancer patients: A prospective cohort study. Clin Nutr. 2015;34(1):66–73. https://doi.org/10.1016/j.clnu.2014.01.013
- Korth O, Bosy-Westphal A, Zschoche P, et al. Influence of methods used in body composition analysis on the prediction of resting energy expenditure. Eur J Clin Nutr. 2007;61(5):582–9. https://doi.org/10.1038/sj.ejcn.1602556
- Bechard LJ, Feldman HA, Gordon C, et al. A multi-center, randomized, controlled trial of parenteral nutrition titrated to resting energy expenditure in children undergoing hematopoietic stem cell transplantation (‘PNTREE’): rationale and design. Contemp Clin Trials. 2010;31(2):157–64. https://doi.org/10.1016/j.cct.2009.12.002
- Marín VB, Velandia S, Hunter B, et al. Energy expenditure, nutrition status, and body composition in children With cystic fibrosis. Nutrition. 2004;20(2):181–6. https://doi.org/10.1016/j.nut.2003.10.010