
 ?Mathematical formulae have been encoded as MathML and are displayed in this HTML version using MathJax in order to improve their display. Uncheck the box to turn MathJax off. This feature requires Javascript. Click on a formula to zoom.
Abstract
The system of compositions MySmx-yCe1-xO2-δ (M = Al, Ca, Mg & Sr, x = 0.20; y = 0.025) are investigated in the present study as electrolytes for IT-SOFCs. These samples are prepared by a low-temperature sol-gel process modified by sucrose-pectin to obtain a nanocrystalline powder. The synthesized nanocrystalline powder calcined at 600°C. The average crystallite size is in the range of 11–16 nm. The co-dopants Al, Ca, Mg & Sr promote densification of the SDC 20 at relatively lower sintering temperatures (<1300°C). These samples are characterized by XRD, Williamson-Hall plots, UV-Visible, Raman, FESEM, and impedance spectroscopy. The electrical conductivity is measured in the temperature range of 300–700°C. The sample with composition Sr0.025Sm0.175Ce0.80O2-δ (SrSDC) exhibits higher electrical conductivity of 0.03342 S/cm at 700°C. Hence, SrSDC can be used as an electrolyte for IT-SOFC applications.
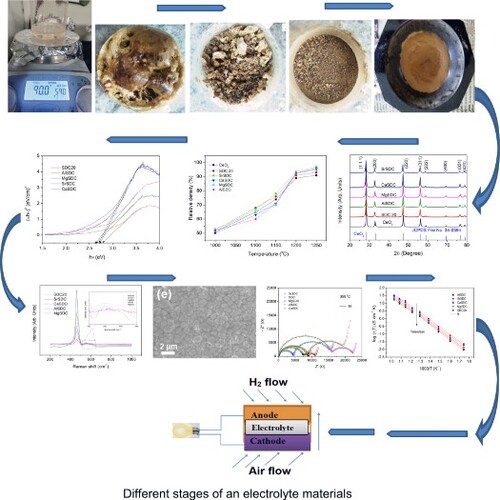
GRAPHICAL ABSTRACT
1. Introduction
Solid oxide fuel cells (SOFCs) are clean, green, and environmentally friendly energy conversion devices. The efficiency of the fuel cell depends mainly on electrolyte materials [Citation1,Citation2]. The electrolyte performance mainly depends on oxide ion conductivity. Commercial electrolyte materials, like YSZ, requires higher operating temperature (>800°C). Higher operating temperatures always restrict the choice of materials and result in disadvantages like materials stability, degradation, chemical stability, and compatibility across the other cell components [Citation3,Citation4].
Cerium dioxide (CeO2) is the alternate choice to use as an electrolyte in intermediate-temperature solid oxide fuel cells (IT-SOFC). The CeO2 is a poor conductor even at 600°C [Citation4]. However, when doped with proper dopant and dopant concentration, it exhibited improved oxide ion conductivity in the temperature range of 550–750°C. Due to the improved oxide ions, doped CeO2 became the choice for many researchers in the field of fuel cells [Citation2].
Reported results in the literature evidenced that the Sm3+ or Gd3+ doped (20%) ceria showed improved oxide ion conductivity; besides co-dopants like Sr2+, Ca2+ etc., doped ceria also enhanced the oxide ion conductivity [Citation1–4]. As reported in the literature, Pr-Gd co-doped ceria [Citation5,Citation6], Sm-Gd co-doped ceria [Citation6,Citation7], Mg-Gd co-doped ceria [Citation8], Sr addition (10 mol%) on SDC20 [Citation9], Effect of Sr on Sm2O3-doped ceria [Citation10], Sr-Sm co-doped ceria [Citation11,Citation12] showed improved oxide ion conductivity, whereas La3+ and Y3+ co-doped ceria [Citation13], Sm3+ and Y3+ co-doped ceria [Citation14] does not show improvement. The oxide ion conductivity depends on different parameters like the type of dopant, its concentration, ionic radii, particle size, sintering temperature, and synthesis method play an essential role in the optimization of the oxide ion conductivity of an electrolyte [Citation1].
Recently, reported results on alkaline earth and rare earth co-doped ceria systems showed the optimization of density, and electrical properties of Sm or Gd doped ceria, for example, Ca, Sr co-dopants [Citation2], Al co-dopant [Citation15], Mg co-dopant [Citation16]. Moreover, Alkaline earth oxides are cheaper than Rare earth oxides [Citation17,Citation18]. Furthermore, Alkaline earth ions such as Ca2+, Sr2+, Mg2+, Ba2+, etc., as a co-dopant resulted in increased grain boundary conductivity, i.e. scavenging SiO2 impurities to grain boundaries. During the sintering process, chemicals that contain SiO2 impurities that are segregated into grain boundaries; consequently, grain boundaries become more resistive.
Kim [Citation19] and Ciotera [Citation20] reported that SrO reacts with SiO2 and scavenges SiO2 impurities into grain boundaries, resulting in decreased grain boundary resistance. It is reported [Citation21–24] that Ca2+, Sr2+, Mg2+, and Ba2+ ions act as a scavenger for siliceous impurities at the grain boundary for GDC. It is observed that Sr2+ ions react with SiO2 and clean grain boundaries, which resulted in a decrease in grain boundary resistance so that oxide ions diffuse freely through grain boundaries. Furthermore, it is observed that Alkaline earth oxides are used as an additive to improve density and grain boundary conductivity [Citation25].
In the present study, the selection of divalent (Sr2+, Ca2+, Mg2+) and trivalent (Al3+, Sm+3) as co-dopants is based on average ionic radii and effective index of ionic radii. Besides, the effective index of ionic radii [Citation26] values is calculated using Eq. 1&2 and presented in . The effective index of ionic radii values is near 1 in the case of Sr-co-doped ceria, whereas it is away from 1 in the case of Al-co-doped ceria.
(1)
(1)
(2)
(2)
where symbols have their usual meaning [Citation26].
Table 1. Effective index of ionic radii of MySmx-yCe1-xO2-δ (M = Al, Ca, Mg & Sr, x = 0.20; y = 0.025) samples.
Mori et al. [Citation26] proposed that if the sample composition effective index is closer to 1, that composition should exhibit higher ionic conductivity.
In the present paper, the samples of MySmx-yCe1-xO2-δ (M = Al, Ca, Mg & Sr, x = 0.20; y = 0.025) are prepared and characterized. The compositions are named AlSDC (Ce0.8Sm0.175Al0.025O2-δ); CaSDC (Ce0.8Sm0.175Ca0.025O2-δ); MgSDC (Ce0.8Sm0.175Mg0.025O2-δ); SrSDC (Ce0.8Sm0.175Sr0.025O2-δ), and SDC 20 (Ce0.8Sm0.2O2-δ). The present investigation aims to study the structure, impedance, and electrical properties of the Al, Ca, Mg & Sr co-doped ceria samples compared with samarium-doped ceria SDC 20 (Ce0.8Sm0.2O2-δ).
2. Experimental
In the present study, the samples SDC20, AlSDC, CaSDC, MgSDC, and SrSDC are synthesized through a low-temperature-modified sol-gel process [Citation27,Citation28] using sucrose-pectin with compositional formula MySmx-yCe1-xO2-δ. The modified sol-gel process employed in the present study differs from the sol-gel process reported in the literature [Citation29,Citation30]. Cerium nitrate (Ce(NO3)3·6H2O), Aluminium nitrate (Al(NO3)3·9H2O), calcium nitrate (Ca(NO3)2.4H2O), magnesium nitrate (Mg(NO3)2.4H2O), strontium nitrate (Sr(NO3)2.4H2O), samarium nitrates (Sm(NO3)3·6H2O), sucrose (C12H22O11), and pectin were used in the preparation. The sucrose and pectin dissolved in distilled water in a beaker. The nitrates are dissolved in another beaker. Now the nitrate solution beaker is kept on a magnetic stirrer at 80°C, sucrose-pectin is added slowly under continuous stirring (1 h) and further kept on stirrer 24 h–36 h at 90°C. The dried material was ground (30 min.), resulting in a nanocrystalline powder that was calcined at 600°C. Then the calcined nanocrystalline powder is pressed into green pellets, sintered at different temperatures, and sintered at 1250°C for 6 h with a programmed heating rate of 5°C /min. The experimental densities (ρe) of sintered ceramics were measured by the Archimedes method. The sintered samples’ relative density is over 92% of the theoretical density in all specimens. The theoretical density was calculated by the formula using eq. 3:
(3)
(3)
where ρ is the density (g/cm3), n is the number of atoms per unit cell, A is the atomic weight (g/mol), V is the volume per unit cell (cm3/cell), and N is the Avogadro’s number The relative density is calculated using the formula (ρrel) = ρe/ρt.
Powder XRD patterns (PXRD) were recorded using BRUKER (D8 Advanced model). The surface morphology of the samples was recorded using SEM (scanning electron microscope) (ZEISS model). Optical absorption was carried out by Shimadzu UV-Vis spectrometer. A Lab RAM-HR instrument was used to record the Raman spectra. The electrical conductivity of samples was measured by a two-probe a.c impedance spectrometer (4294A, Agilent Technologies) on sintered pellet specimens with a 10-mm diameter and 2-mm thickness. The electrical conductivity measurements were recorded at various temperatures in the range of 300°C–700°C in air.
3. Results and discussion
3.1. Powder XRD analysis
(a) presents the powder XRD patterns of SDC20, AlSDC, CaSDC, MgSDC, and SrSDC samples. The sample structure is cubic, and the space group is . The intense peaks are observed at the planes (111), (200), (220), (311), (222), (400), (331), and (420), and these peaks are matched with the JCPDS file; there are no other extra diffraction peaks of Sm2O3 or SrO2, CaO2, MgO2, and Al2O3 or impurities. This indicates the formation of a solid solution, i.e. the doping of Sr2+, Ca2+, Mg2+, Al3+, and Sm+3 in the CeO2 lattice. There is a shift in the peak (1 1 1) towards the lower Bragg’s angle, as shown in (b). This shift is changed with dopant concentration. The shift is towards the lower Bragg’s angle in the case of the Sr, Ca co-dopants, whereas in the case of Al, Mg co-dopants, it is completely towards the higher Bragg’s angle. This shift depends on lattice expansion and contraction; when Ce4+ (Ionic radii = 0.97 Å) is doped with higher ionic radii [Citation31] Sm3+ (Ionic radii = 1.06 Å) and Sr2+ (1.26 Å), lattice expands, and the peak shift is slight to the left, whereas it is to the right when the lattice contracts i.e. when Ce4+ (Ionic radii = 0.97 Å) is doped with lower ionic radii Al3+ (Ionic radii = 0.46 Å).
Figure 1. (a) PXRD patterns (b) shift in the plane (111), (c) Lattice parameter vs. Ionic radius, and (d) Williamson-Hall plots of SDC20, AlSDC, MgSDC, CaSDC, and SrSDC samples.

(c) presents the lattice parameters versus ionic radii. The introduction of Sm3+, and Ca2+, Sr2+ into Ce4+ results in the lattice expansion, whereas lattice contraction in case of Sm3+, and Al3+, Mg2+, due to this the X-ray diffraction patterns shifted to lower or higher Bragg’s angle depending on the ionic radii mismatch. The lattice parameter (a) is calculated using Eq.4.
(4)
(4)
where “a” is the lattice parameter, d is the interplanar spacing, and (h, k,
) are the miller indices.
(c) presents the lattice parameter changed with Sm3+, Al3+, Ca2+, Mg2+, and Sr2+ dopant concentrations. This is due to different ionic radii [Citation31] of Ce+4 (0.97 Å), Sm3+ (1.079 Å), Al3+ (0.535 Å), Ca2+ (1.06 Å), Mg2+ (0.89 Å), and Sr2+ (1.26 Å) [Citation6] in a solid oxide solution. Due to ionic radii mismatch, it is observed that the lattice parameter increased for Sm3+, Ca2+, and Sr2+, whereas it decreased for dopants Al3+ and Mg2+.
(d) presents the average crystallite size (Dc) calculated (Dc = 0.9λ/βcosθ) from Williamson–Hall plots. The average crystallite sizes are in the range of 11 nm–16 nm. The modified sol-gel process resulted in the uniform nanocrystalline powder [Citation27,Citation28].
shows the Relative density versus sintering temperatures of MySmx-yCe1-xO2-δ (M = Al, Ca, Mg & Sr, x = 0.20; y = 0.025) of specimens. presents the relative densities of SDC20, AlSDC, CaSDC, MgSDC, and SrSDC samples, and it is noticed that the co-doped ceria nanocrystalline powder actively absorbs the heat. Its relative density increased from 64% to over 92% within 200°C.
Figure 2. The Relative density versus temperature of MySmx-yCe1-xO2-δ (M = Al, Ca, Mg & Sr, x = 0.20; y = 0.025).

Table 2. Relative densities of the MySmx-yCe1-xO2-δ (M = Al, Ca, Mg & Sr, x = 0.20; y = 0.025) samples.
3.2. UV–Vis spectra
(a) presents the UV–Vis spectra of MySmx-yCe1-xO2-δ (M = Al, Ca, Mg & Sr, x = 0.20; y = 0.025) of specimens. (b) presents the Tauc plots; a graph is plotted between (αhν)2 versus hν, extrapolating the linear part of the graph results in band gap energy. The band gap energy for AlSDC, SDC20 MgSDC, CaSDC, and SrSDC are 2.78, 2.73, 2.70, 2.66, and 2.62 eV, respectively. The reported band gap energy of CeO2 was 3.33 eV [Citation32].
Figure 3. UV–Vis spectra (a) Absorbance versus wavelength, (b) Tauc plot of MySmx-yCe1-xO2-δ (M = Al, Ca, Mg & Sr, x = 0.20; y = 0.025) samples.

3.3. Raman spectroscopy
presents the Raman spectra of the MySmx-yCe1-xO2-δ (M = Al, Ca, Mg & Sr, x = 0.20; y = 0.025) samples. The Raman spectrum is the signature of the presence of oxygen vacancies. It is noticed that there are two prominent peaks; one is strong at around 470 cm−1, and the other one is a weak band at around 520–600 cm−1. Compared with pure ceria [Citation33], the extra peak formed at around 520–600 cm−1 is due to the formation of additional oxygen vacancies formed due to the doping of co-dopants into the host material, i.e. Ce4+. Furthermore, it can be seen that there is no second prominent peak is observed for Al co-doping, besides the main peak intensity further decreased with different co-dopants.
Figure 4. Raman spectra of the MySmx-yCe1-xO2-δ (M = Al, Ca, Mg & Sr, x = 0.20; y = 0.025) samples.

3.4. Microstructure analysis
shows the SEM images of MySmx-yCe1-xO2-δ (M = Al, Ca, Mg & Sr, x = 0.20; y = 0.025) of specimens sintered at 1250°C. The figures show that the surface clearly shows the grain, and few pores are seen. This result also supports the relative density calculations.
Figure 5. The SEM images of (a) SDC20, (b) AlSDC, (c) MgSDC, (d) CaSDC, and (e) SrSDC samples.

3.5. Impedance spectroscopy
presents the Nyquist plots of MySmx-yCe1-xO2-δ (M = Al, Ca, Mg & Sr, x = 0.20; y = 0.025) at 300°C and 500°C. Figures and presents the Nyquist plots for SrSDC and AlSDC samples, respectively.
Figure 6. Nyquist plots of MySmx-yCe1-xO2-δ (M = Al, Ca, Mg & Sr, x = 0.20; y = 0.025).

Figure 7. Nyquist plots of MySmx-yCe1-xO2-δ (M = Sr, x = 0.20; y = 0.025).

Figure 8. Nyquist plots of MySmx-yCe1-xO2-δ (M = Al, x = 0.20; y = 0.025).

It is noticed that two arcs are clear, and one arc is not clear. The splitting of curves depends on the sample nature, temperature, and applied frequency. The left side high-frequency curve is known as the grain resistance, Rg, the middle region medium frequency curve is the grain boundary resistance, Rgb, and the right side low-frequency curve is the electrode resistance. In the present study, electrode resistance is not considered for total resistance calculation.
It can be further noticed that the depressed semi-circles are present due to the non-uniform distribution of the grains in the sample microstructure. The total resistance is calculated by fitting the Nyquist plots using EIS software [Citation34]. The equivalent circuit models were employed to fit the Nyquist plots; here, the constant phase element is used instead of a capacitor due to the presence of depressed semi-circles in impedance plots. The equivalent circuits model (Resistance-capacitor)g-(Resistance-capacitor)gb was used up to 400°C, whereas above 400°C, the equivalent circuit model (Resistance)g-(Resistance-capacitor)gb was used to fit the date because the grain curve is not resolved properly.
Furthermore, it is noticed from Figures 6–9 that the impedance spectra resolved properly as grain, grain boundary, and electrode components up to 400°C; after that, the grain component is not resolved correctly due to exceeding the experimental frequency. The total resistance is then calculated as Rt = Rg + Rgb where Rg is the grain resistance (length of the grain curve on the X-axis), Rgb is the grain boundary resistance (length of the grain boundary curve on the X-axis). The capacitance values range from 10−11 to 10−7 F for the grain and grain boundary resistance, respectively [Citation35,Citation36].
presents the typical Nyquist plots of SDC20, AlSDC, MgSDC, CaSDC, and SrSDC samples at 300°C. It is observed that the SrSDC, CaSDC and MgSDC samples exhibited lower total resistance than the SDC, whereas higher resistance is observed for the sample AlSDC. These results can be correlated with microstructure, i.e. grain size (). The sample SrSDC exhibits a lower grain boundary resistance than the rest due to higher density. Similarly, other samples’ grain and grain boundary resistance changed with the grain size.
Figure 9. Nyquist plots of SDC20, AlSDC, MgSDC, CaSDC, and SrSDC samples at 300°C.

3.6. Electrical properties
The total resistance Rt, the grain resistance Rg, and the grain boundary resistance Rgb are taken from the impedance spectra at different temperatures. The grain σb, grain boundary σgb, and the total conductivity σt were then calculated using Eq. 5,
(5)
(5)
where L is the thickness, and A is the cross-sectional area of the sample.
(a–c) presents the grain, grain boundary, and total electrical conductivity of SDC20, AlSDC, MgSDC, CaSDC, and SrSDC samples. It is noticed that the MgSDC sample showed higher grain conductivity than the rest of the samples, as presented in (a). In contrast, the SrSDC sample showed higher grain boundary conductivity than the other samples. Furthermore, it is observed that the SrSDC sample exhibited higher total conductivity, whereas the AlSDC sample showed lower total conductivity. The main contribution of the conductivity of ceria-based compounds in the air is oxide ionic conductivity and electronic conductivity (negligible) [Citation1,Citation26]. In the present study, the conductivity measured in the air can be treated as oxide ionic conductivity [Citation1,Citation3].
Figure 10. The Arrhenius plots of (a) Grain conductivity, (b)Grain boundary conductivity, and (c) Total conductivity of SDC20, AlSDC, MgSDC, CaSDC, and SrSDC samples.

(a–c) shows the variation of log σ with 1000/T for MySmx-yCe1-xO2-δ (M = Al, Ca, Mg & Sr, x = 0.20; y = 0.025) ceramics sintered at 1250°C. The total ionic conductivity is the bulk value, the sum of the grain, and the grain boundary contributions [Citation17,Citation18]. The ionic conductivities are significantly enhanced in SDC20 ceramic by co-dopants Ca, Mg & Sr, which introduced oxygen vacancies in the host material. The SrSDC sample showed maximum ionic conductivity of 0.03342 S/cm at 700°C, that of SDC20 (0.01935 S/cm). The oxide ion mobility increases with temperature, so the conductivity increases at higher temperatures.
Eq.6 is used to calculate the activation energy from (a–c):
(6)
(6)
The activation energy for conduction is obtained by plotting the ionic conductivity data in the Arrhenius relation for thermally activated conduction. The calculated activation energy values are presented in , and it can be seen that the SrSDC sample exhibits lower activation energy (i.e. 0.81 eV) than the rest of the samples. It is worth noting that the activation energy values are changed with different co-dopants in the MySmx-yCe1-xO2-δ system. Besides, with increasing temperature, the activation energy values are decreased.
Table 3. The effective index, electrical conductivity, and activation energy of MySmx-yCe1-xO2-δ (M = Al, Ca, Mg & Sr, x = 0.20; y = 0.025) samples.
The activation energy (Ea) for conduction is the sum of the association energy (Ha) and migration energy (Hm). The activation energy at lower temperatures is the sum of these two contributions, i.e. Ea = Ha + Hm. At higher temperatures, on the other hand, the activation energy is only equal to the migration energy, i.e. Ea = Hm, [Citation1,Citation3].
According to Mori et al. [Citation26], it is assumed that if the effective index approaches 1, it is possible to obtain the maximum oxide ion conductivity. shows that the SrSDC sample’s effective index approached 1 compared to the rest of the samples. The SrSDC sample showed maximum oxide ion conductivity than the other samples in the present study.
presents the SrSDC conductivity and activation energy. It can be seen that the SrSDC sample conductivity compared well with the reported in the literature.
Table 4. Comparison of the electrical conductivity and activation energy of the SrSDC sample with reported values in the literature.
4. Conclusions
A series of co-doped ceria nanocrystalline samples of the MySmx-yCe1-xO2-δ (M = Al, Ca, Mg & Sr, x = 0.20; y = 0.025) system are successfully synthesized by a sol-gel process modified using sucrose-pectin. XRD results confirm the single phase with a cubic structure. The average crystallite size is in the range of 11–16 nm. The co-dopants Sr, Ca, and Mg decreased the band gap energy of SDC20 from 2.85 eV to 2.47 eV. Raman spectra confirm the formation of more oxygen vacancies in the case of co-dopants like Sr, Ca, and Mg than the SDC20. The nanocrystalline powder is subjected to a sintering temperature of 1250°C to prepare dense ceramics (more than 92% TD). The modified sol-gel process resulted in a uniform nanocrystalline powder and highly dense samples (more than 92%TD) at a lower sintering temperature of 1250°C. The impedance results showed that the grain and the grain boundary resistance of SDC20 changed with Al, Ca, Mg & Sr co-dopants. The grain boundary conductivity contribution is more than the grain to the total conductivity. Higher density resulted in grain growth, which decreased the grain boundary resistance of Sr, Ca, and Mg co-doped SDC samples. Based on the effective index calculations, the SrSDC sample’s effective index is near 1, and experimentally, the SrSDC sample exhibited higher oxide ion conductivity than the rest of the samples. The co-dopant Sr introduced more oxygen vacancies in the SDC 20 than the other dopants, resulting in higher oxide ion conductivity (3.34 × 10⁻² S/cm at 700°C) and minimum in the activation energy (0.81 eV) than the rest of the samples. Co-dopant Sr significantly improved the density, grain boundary, and total conductivity of SDC20 to the rest of the samples. Therefore, the SrSDC sample is a potential candidate as an electrolyte for IT-SOFC applications.
Acknowledgement
The present work has been supported by GITAM, funding under the scheme of Research Seed Grant-RSG-(F. No 2021/0060).
Disclosure statement
No potential conflict of interest was reported by the author(s).
Additional information
Funding
References
- Jaiswal N, Tanwar K, Suman R, et al. A brief review on ceria based solid electrolytes for solid oxide fuel cells. J Alloys Compd. 2019;781:984–1005.
- Dell'Agli G, Spiridigliozzi L, Pansini M, et al. Effect of the carbonate environment on morphology and sintering behaviour of variously co-doped (Ca, Sr, Er. Pr) Samarium-doped ceria in co-precipitation/hydrothermal synthesis. Ceram Int. 2018;44(15):17935–17944.
- Tushar MK, Jagannath M, Subrata Kumar M, et al. Zirconia- and ceria-based electrolytes for fuel cell applications: critical advancements toward sustainable and clean energy production. Environ Sci Pollut Res. 2022;29(43):64489–64512.
- Liu J, Zhu C, Zhu D, et al. High performance low-temperature solid oxide fuel cells based on nanostructured ceria-based electrolyte. Nanomaterials. 2021;11(9):2231.
- Lubke S, Wiemhofer HD. Electronic conductivity of Gd-doped ceria with additional Pr-doping. Solid State Ionics. 1999;117(3-4):229–243.
- Kim N, Kim BH, Lee D. Effect of co-dopant addition on properties of gadolinia-doped ceria electrolyte. J Power Sources. 2000;90(2):139–143.
- Singh NK, Singh P, Kumar D, et al. Electrical conductivity of undoped, singly doped, and co-doped ceria. Ionics. 2012;18(1-2):127–134.
- Wang FY, Chen S, Wang Q, et al. Study on Gd and Mg co-doped ceria electrolyte for intermediate temperature solid oxide fuel cells. Catal Today. 2004;97(2-3):189–194.
- Zheng Y, He S, Ge L, et al. Effect of Sr on Sm-doped ceria electrolyte. Int J Hydrogen Energy. 2011;36(8):5128–5135.
- Yeh TH, Chou CC. Ionic conductivity investigation in samarium and strontium co-doped ceria system. Phys Scr. 2007;T129:303–307.
- Anirban SK, Dutta A. An insight into the structure, conductivity and ion dynamics of Sr-Sm co-doped ceria oxygen ion conductors: effect of defect interaction. Solid State Sci. 2018;86:69–76.
- Sandhya K, Chitra Priya NS, Rajendran DN. Enhancement of electrical properties Ce0.8Sm0.2−xO2−δ by Sr2+ doping. Appl Phys A. 2020;126(8):613.
- Yoshida H, Inagaki T, Miura K, et al. Density functional theory calculation on the effect of local structure of doped ceria on ionic conductivity. Solid State Ionics. 2003;160(1-2):109–116.
- Acres GJK, Frost JC, Hards GA, et al. Electrocatalysts for fuel cells. Catal Today. 1997;38(4):393–400.
- Neuhaus K, Wiemhöfer HD. Electrochemical characteristics of grain boundaries in gadolinium and aluminum co-doped ceria and ceria-alumina composites. Solid State Ionics. 2021;371:115771.
- Ahmad SI, Koteshwar Rao P, Syed IA. Sintering temperature effect on density, structural and morphological properties of Mg- and Sr-doped ceria. J Taibah Univ Sci. 2016;10(3):381–385.
- Jaiswal N, Kumar D, Upadhyay S, et al. Effect of Mg and Sr co-doping on the electrical properties of ceria-based electrolyte materials for intermediate temperature solid oxide fuel cells. J Alloys Compd. 2013;577:456–462.
- Jaiswal N, Upadhyay S, Kumar D, et al. Sm3+ and Sr2+ co-doped ceria prepared by citrate-nitrate auto-combustion method. Int J Hydrogen Energy. 2014;39:543–551.
- Kim DJ. Lattice parameters, ionic conductivities, and solubility limits in fluorite-structure MO2 Oxide [M = Hf4+. Z: r4), +, Ce4+, Th4+, U4+] solid solutions. J Am Ceram Soc. 1989; 72(8):1415–1421.
- Cioateră N, Pârvulescu V, Rolle A, et al. Effect of strontium addition on europium-doped ceria properties. Solid State Ionics. 2009;180:681–687.
- Cho PS, Cho YH, Park SY, et al. Grain-boundary conduction in gadolinia-doped ceria: the effect of SrO addition. J Electrochem Soc. 2009;156:B339–B344.
- Cho PS, Lee SB, Cho YH, et al. Effect of CaO concentration on enhancement of grain-boundary conduction in gadolinia-doped ceria. J Power Sources. 2008;183(2):518–523.
- Cho PS, Lee SB, Cho YH, et al. Improvement of grain-boundary conduction in SiO2-doped GDC by BaO addition. J Electrochem Soc. 2009;156(8):B891–B896.
- Cho YH, Cho PS, Auchterlonie G, et al. Enhancement of grain-boundary conduction in gadolinia-doped ceria by the scavenging of highly resistive siliceous phase. Acta Mater. 2007;55(14):4807–4815.
- Suresh MB, Roy J. The effect of strontium doping on densification and electrical properties of Ce0.8Gd0.2O2−δ electrolyte for IT-SOFC applications. Ionics. 2012;18:291–297.
- Mori T, Ikegami T, Yamamura H. Application of a crystallographic index for improvement of the electrolytic properties of the CeO2-Sm2O3 system. J Electrochem Soc. 1999;146:4380–4385.
- Suciu C, Gagea L, Hoffmann AC, et al. Sol-gel production of zirconia nanoparticles with a new organic precursor. Chem Eng Sci. 2006;61:7831–7835.
- Wang Z, Kale GM, Ghadiri M. Maltose and pectin assisted sol-gel production of Ce0.8Gd0.2O1.9 solid electrolyte nanopowders for solid oxide fuel cells. J Mater Chem. 2011;21:16494–16499.
- Accardo G, Spiridigliozzi L, Dell'Agli G, et al. Morphology and structural stability of bismuth-gadolinium co-doped ceria electrolyte nanopowders. Inorganics. 2019;7(10):118.
- Duangsa K, Tangtrakarn A, Mongkolkachit C, et al. The effect of tartaric acid and citric acid as a complexing agent on defect structure and conductivity of copper samarium co-doped ceria prepared by a sol-gel auto-combustion method. Adv Mater Sci Eng. 2021;44:1–23.
- Shannon RD. Revised effective ionic radii and systematic studies of interatomic distances in halides and chalcogenides. Acta Crystallogr A. 1976;32(5):751–767.
- Chinnu MK, Anand KV, Kumar RM, et al. Synthesis and enhanced electrochemical properties of Sm:CeO2 nanostructure by hydrothermal route. Mater Lett. 2013;113:170–173.
- McBride JR, Hass KC, Poindexter BD et al. Raman and x-ray studies of Ce1−xRExO2−y, where RE=La, Pr, Nd, Eu, Gd, and Tb. J Appl Phys. 1994;76:2435.
- Bondarenko AS, Ragoisha GA. Inverse problem in potentio dynamic electrochemical impedance. In: Pomerantsev AL, editor. Progress in chemometrics research. New York: Nova Science Publishers; 2005. p. 89–102.
- Parkash O, Singh N, Singh NK, et al. Preparation and characterization of ceria co-doped with Ca and Mg. Solid State Ionics. 2012;212:100–105.
- Ali A, Raza R, Kaleemullah M, et al. Alkaline earth metal and samarium co-doped ceria as efficient electrolytes. Appl Phys Lett. 2018;112:043902.
- Kashyap D, Patro PK, Lenk RK, et al. Effects of Gd and Sr co-doping in CeO2 for electrolyte application in solid oxide fuel cell (SOFC). Ceram Int. 2014;40(8):11869–11875.
- Sherwood T, Baker RT. Effects of strontium content on the microstructure and ionic conductivity of samarium-doped ceria. Solids. 2021;2:293–313.
- Zheng Y, He S, Ge L, et al. Effect of Sr on Sm-doped ceria electrolyte. Int J Hydrogen Energy. 2011;36:5128–5135.
- Zheng Y, Gu H, Chen H, et al. Effect of Sm and Mg co-doping on the properties of ceria-based electrolyte materials for IT-SOFCs. Mater Res Bull. 2009;44(4):775–779.
- Sha X, Lu Z, Huang X, et al. Preparation and properties of rare earth co-doped Ce0.8Sm0.2-δYxO1.9 electrolyte materials for SOFC. J Alloys Compd. 2006;424:315–321.
- Yang J, Ji B, Si J, et al. Synthesis and properties of ceria based electrolyte for IT-SOFCs. Int J Hydrogen Energy. 2016;41:15979–15984.
- Wu YC, Chen WY. Fabrication and characterization of Ca2+, Sr2+, Ba2+, Sm3+, and La3+ co-doped ceria-based electrolyte powders for low-temperature anode-supported solid oxide fuel cells. Int J Hydrogen Energy. 2018;43:18463–18476.