
 ?Mathematical formulae have been encoded as MathML and are displayed in this HTML version using MathJax in order to improve their display. Uncheck the box to turn MathJax off. This feature requires Javascript. Click on a formula to zoom.
Abstract
Carboxy-methyl cellulose (CMC)/ polyvinylpyrrolidone (PVP)/(1 − x)NiO–xZnS (x = 0, 0.25, 0.5, 0.75, 1) polymer blends were prepared using casting, sol–gel and solid state reaction methods. X-ray diffraction technique was used to determine the structure and crystallite size of the nanofillers. The crystalline feature of the blends and the nanofillers over the blends matrix were examined using the XRD technique. FTIR was used to confirm the formation of the blends. The effect of the interchangeable proportions of nanoparticles on the optoelectronic properties of the blends was examined using Wemple and DiDomenico model. The transmitted intensity is investigated with lasers at three different wavelengths. A reduction in transmittance makes the studied material promising as attenuating filters at doping levels starting from 75% NiO or less and 25% of ZnS and more even if at relatively high laser powers.
GRAPHICAL ABSTRACT
1. Introduction
Blended biopolymers nanocomposite materials gain considerable attention owing to their unique electronic, mechanical, thermal and optical characteristics that are allowed to be used in many interesting applications [Citation1–5]. Polyvinylpyrrolidone (PVP) is an amorphous, biodegradable, water-soluble, low-cost polymer and it has C=O chain [Citation6–9]. Carboxy-methyl cellulose (CMC) is semicrystalline a polyelectrolyte smart cellulose derivative, water-soluble, biodegradable, nontoxic material. CMC has –OH (hydroxyl) and COO− (carboxylic anion) groups, thermal gelatinization and excellent film-forming properties [Citation10,Citation11].
Nickel oxide (NiO) is a p-type semiconductor (3.4–4 eV) that can be employed in many applications such as photovoltaic devices, supercapacitors, smart windows, fuel cells and photovoltaic devices. Nano NiO exhibited different optical and electronic, characteristics as compared with bulk NiO [Citation12]. Zinc sulphide (ZnS) is one of II–VI semiconductor group that has a large optical band gap (3.7 eV) and it displayed many outstanding chemical and physical features as it formed in the quantum dot range [Citation13].
The blending of two or more polymers modified many properties as compared with the individual ones. Also doping polymer or blended polymer with suitable nanofillers can modify its properties. For example, El Sayed et al. found that the optical band gap of the CMC/PVP blend was reduced to 4.5 eV as it doped with NiO [Citation14]. Poly(ethylene glycol)–poly(vinyl chloride) films exhibited a low transmittance, a comparatively high refractive index and reduced band gap as it loaded with nano Y2O3 [Citation15], The obtained high thermal stability, decomposition temperature, transmittance and conductivity for PVP/CMC/α-Fe2O3 nanorods nominated it to used in the packaging industry, treating some chronic wounds, optical windows and fibres [Citation16,Citation17]. The optical features of poly (vinyl acetate)/poly (vinyl chloride) blend were affected by the kind of doping oxide (MgO or PbO) [Citation18]. El Sayed et al. compared the effect of cubic NiO (59.85 nm) and a hexagonal La2O3 (and 29.13 nm) on the optical properties of poly(vinyl acetate)/poly(methyl methacrylate) blend. They found that NiO and La2O3 narrowed the direct bandgap of the blend from 4.1 to 3.3 and 3.4 eV, respectively. 1.0 wt.% NiO considerably enhanced many optical parameters of the blend [Citation19]. CuO/Co3O4/poly(methyl methacrylate) nanocomposites were found as promising candidates for nanotechnology-based devices such as electric stress control, film capacitors and anti-reflective coating for solar cell applications [Citation20]. Furthermore, it was demonstrated that the energy gap and optical parameters of PVA were affected by the crystallite size of ZnS [Citation13]. Eosin yellow dye-doped poly(vinyl alcohol) (PVA) displayed the best possible optical limit behaviour at high dyes amount [Citation21]. Manganese oxide/PVA films reduced the power of two laser beams (635 and 533 nm) effectively [Citation22].
This study reports the preparation and characterization of CMC/PVP nanocomposites loaded with ZnS (quantum dots) and/or NiO (nanoparticles). The structural, optoelectronic properties and laser CUT-OFF filters have been studied using X-ray diffraction, FTIR spectroscopy, UV spectrophotometer, different lasers and optical meters.
2. Materials and methods
Nano ZnS and NiO samples were formed using the solid-state reaction method at low-temperature and sol–gel process, respectively. In order to prepare NiO, 1 g from nickel(II) nitrate hexahydrate (Sigma–Aldrich) was dissolved together with 1 g citric acid in 10 ml ethylene glycol using a magnetic stirrer at 80oC for 6 h. The nanopowder was obtained by heating the formed gel at 700°C (2 h) in an electric oven. ZnS was formed by mixing and girding the required amount from Zn acetate dihydrate (Sigma–Aldrich) and thiourea (1:1) for 3 h and then heating the mixture in an electric oven for 3 h at 300oC.
CMC/PVP (80/20) blended polymer was formed employing the casting technique: 1.6 g of carboxy-methyl cellulose (CMC, Sigma–Aldrich) and 0.4 g of polyvinylpyrrolidone (PVP, Sigma–Aldrich) were dissolved using a magnet stirrer in 60 ml double-distilled water (DDW), at room temperature for 4 h (clear solution was obtained). CMC/PVP/(1 − x)NiO–xZnS (x = 0, 0.25, 0.5, 0.75, 1) polymer blends were produced using the last steps but in the presence of 4 wt.% of NiO and/or ZnS, Figure . The resultant solutions were located separately in Petri dishes for 4 days and the films were formed. The created blends have a thickness of ∼0.3 mm (performed using the digital micrometer).
Figure 1. Preparation steps for doped CMC/PVP blend with ZnS and NiO nanoparticles.

The X-ray diffraction data were collected by a PANalytical diffractometer (X’pert MPD, Philips, Cu-source). Fourier transform infrared (FTIR) spectroscopy (Bruker Tensor 27 FTIR Spectrometer) technique was performed to trace the different vibration bands in the system. UV–vis spectroscopy spectra were performed by UV–vis. Spectrophotometer (Model Tomos UV-1800).
3. Results and discussion
3.1. Structural analysis
Figure displays the X-ray diffraction (XRD) patterns for NiO and ZnS. Using the search match technique, the diffraction peaks located at 37.17o, 43.11o and 63.06o represented the (111), (200) and (220) planes of NiO cubic phase (JCPDS Card no. 78-0643) [Citation12,Citation23]. Also, the diffraction peaks for the ZnS sample are located at 2θ = 28.63o, 47.39o and 56.17o corresponding to (111), (220) and (311) miller indices which represented cubic zinc blend phase (JCPDS Card no. 79-2204) [Citation24].
Figure 2. XRD data for ZnS, NiO and CMC/PVP blends doped ZnS and NiO nanoparticles.

The average crystallite size (L) of the fillers materials (NiO, ZnS) can be obtained by applying the Scherrer formula [Citation25]:
where λ is the wavelength of the X-rays, and β is the full width at half maximum intensity.
It was found that ZnS has quantum dot nature (L = 3 nm) and NiO has nano characteristics (L = 70 nm).
The XRD data for pure CMC/PVP and CMC/PVP/(1 − x)NiO–xZnS blends are represented in Figure . The XRD data for pure and doped CMC/PVP blends with ZnS and/or NiO confirmed their semicrystalline feature. Where the main halo broad peak located at 2θ = 21.59° represented CMC and PVP polymers and small halos centred at 2θ = 11.2 associated with PVP polymer [Citation26]. Upon adding NiO and/ or ZnS within PVP/CMC matrix, additional peaks appear especially in the blends with a large amount of NiO which is associated with the NiO phase. Also as the amount of ZnS increased as compared with the amount of NiO, the main peak of the blend became broader (amorphous phase increased) due to the quantum nature of doped ZnS.
Figure shows the FTIR spectra for pure and doped CMC/PVP with NiO and/ or ZnS. The peaks located at 3598, 2885, 1647, 1423, 1282, 1015 and 706 cm−1 represented OH stretching, CH2 asymmetric stretching (CMC polymer), symmetric and asymmetric of C=O (PVP polymer), CH2 scissoring (CMC polymer), CH2 wagging or twisting or N–OH complex (PVP polymer), CH2–O–CH2 stretching (CMC polymer) and out-of-plane rings C–H bending/C–N stretching vibration (PVP polymer), respectively [Citation27–36]. As demonstrated from the graph, there are alterations in intensities and position of vibrational bands as the nanofiller changed in the blend matrix as a result of the substitution of some carbon and nitrogen atoms in the blend with the nanofiller atoms. The interaction (i.e. formation of ionic and coordination bonds) between the CMC/PVP blend and the nanofillers is confirmed by the reduction in the OH absorbance of a blend.
Figure 3. FTIR data for CMC/PVP blends doped ZnS and NiO nanoparticles.

3.2. UV–vis spectroscopy analysis
The study of the fundamental absorption spectra in the UV region is very useful to describe the variations that occur within the internal band gap structure and give deep information about the interaction process between the incident light and the excitation electrons within the material. All UV–vis studies were performed under normal conditions. The absorption spectra of pure CMC/PVP blends and these doped with interchangeable proportions of ZnS and NiO nanoparticles are shown in Figure (a). All spectra were recorded in the wavelength range of 200–800 nm. The absorption data for all samples showed a harmonic constant behaviour accompanied with a gradual decrease which indicates a high miscibility performance within both polymers chains. A progressive increase in the absorbance data when loading CMC/PVP blends with different nanoparticles has been observed. Similar results showed the same behaviour although the hybrid nanocomposites used (PVP/CMC)/Au based on different nanoparticles such as Au dopants [Citation37,Citation38], others investigated the effect of PbO nanoparticles on almost similar blends showing an increase in the absorption spectra with the weight percentages of PbO nanoparticles [Citation39,Citation40], the same attitude has been confirmed in the case of silver nanoparticles with nanofibrillated cellulose/PVP blends [Citation41,Citation42]. CMC/PVP blends loaded with 100% NiO nanoparticles revealed higher values of absorbance compared to pure blends while increasing the proportion of ZnS nanoparticles from 25% to 100%, a noticeable increase in the absorption has been noticed. This difference of course can’t be returned to the effect of the nanomaterial volume percentage loaded within the blends since it is considered to be constant at 4% for all loaded blends.
Figure 4. (a) Absorbance and (b) transmittance spectra for CMC/PVP blends doped ZnS and NiO nanoparticles.

The variations in the absorbance spectra when moving from blends doped with 100% NiO nanoparticles to these doped with 100% ZnS nanoparticles. The slight shift of the spectral data to the higher wavelength (red shift) confirms clear variations in the band gap values. The rise in the absorption values with ZnS nanoparticles (of smaller particle size = 3 nm) in the visible region can be assigned to two reasons: first, the decrease in the number of hydrogen bonds that formed between the polymer blend chains due to the presence of Zn2+ ions which are the main cause for increasing the degree of amorphousity within the matrix. Second, the presence of larger particle size nanoparticles such as NiO (of particle size = 70 nm) is responsible for modifying the internal structure through an adjustment process causing a reduction in the number of defects and causing stress relaxation [Citation13]. These complexes have a deep effect on the electronic transitions through the band gap region. Other work showed a red shift in the absorption behaviour of the nanomaterial itself with the particle size but the case becomes different in case of polymer materials where the red shift was due to the small particle size effect [Citation43,Citation44]. Some revealed a red shift to the absorption edge of the polymeric material due to the increase in the particle size of the embedded nanomaterial by aggregation [Citation45,Citation46], although this case doesn’t have a comparison between two different particle size nanomaterials but all over behaviour still compatible with ours. A similar cases have been declared by researchers with results similar to ours, showing a shift to the main absorption band of the nanocomposite polymers towards the higher wavelength region with NiO nanoparticles content [Citation47] and 1 wt.% of NiO–Fe2O3 nanoparticles [Citation48]. This indicates that ZnS nanoparticles had undergone strong interaction with the polymeric material and had more control over the optical properties of CMC/PVP nanocomposite blends while NiO nanoparticles had undergone weak ones.
Since the absorption spectra for all loaded samples in the visible region showed a slight decrease with increasing the wavelength, this reflects that a little of the low energy incident photons can undergo an interaction with the polymer blend matrix while others will exceed with a higher probability of transmission. The absorption spectra of polymer blends loaded by NiO showed weak behaviour in the visible light range compared to those loaded by ZnS, indicating that visible light can pass through it while those loaded by ZnS obstruct the passage of light. Figure (b) represents the transmittance spectra for all pure and loaded CMC/PVP blends in the wavelength range of 200–800 nm. The gradual decrease in the transmittance spectra is compatible with a gradual increase in the absorption spectra. Results showed a rise in the transmittance spectra for blends loaded with NiO nanoparticles while those loaded with ZnS nanoparticles showed the lowest transmission values. This reflects the effect of the particle size on the scattering phenomenon which is the key factor for the transmission through nanocomposite blends. Scattering is the fundamental operation that describes the interaction between an incident beam of photons and the matter, resulting from the modifications that occurred within the polymer matrix [Citation49]. Similar results have been discussed by other researchers in case of nanocomposite films of Polymethylmethacrylate doped with different nanoparticles (SnS2:Cr/Fe) [Citation50], (CMC/PVP) nanocomposite films doped with lead oxide nanoparticles where the decrease in the transmittance (T) from 72% to 38% after adding the nanoparticles has been proven [Citation51]. Surface and grain boundary scattering was considered the most common scattering processes that are responsible for the lowest transmittance spectra for blends loaded with ZnS nanoparticles. For CMC/PVP blends loaded with NiO nanoparticles only the grain boundary interaction process is responsible for the scattering. B. Wang et al. represented transmittance data for different PMMA/LZnS nanocomposites doped with different concentrations of zinc sulphide nanoparticles (0.1% – 0.5% – 1%) and showed a behaviour for the spectral data resembles ours, that is a slight decrease in the transmission data in the visible region with the nanoparticles concentration with transparency different from ours because of the variations in the concentrations used of the nanofillers [Citation52], others returned the high optical transmittance of nanocomposite films (PMMU/ZnS) to the ability of ZnS nanoparticles of small size to distribute uniformly within the matrix with high homogeneity [Citation53].
As discussed before, optical absorbance spectra are very important for gathering information about possible transitions within the band gap and hence describing its internal structure. Optical band gap values Eg for pure and loaded blends can be estimated based on Tauc’s relation [Citation53–55]:
where B is a disorder-related parameter (energy independent constant), α is the absorption coefficient, hν is the incident photon energy and m is a parameter takes the values
or 2 for direct allowed or indirect allowed transitions respectively, Figure (a, b) [Citation56]. Figure (c) shows the distribution values of both allowed direct and indirect transitions. The values of the energy band gap can be obtained for both transitions by extrapolating the linear part of the figures to intercept the incident photon energy (hν) axis. Band gap energy values were declared in Table . Returning to the table, one can notice a slight decrease in band gap values from 5.04 eV (for pure bends) to 5.01 eV (for blends loaded with NiO 100%) while a noticed decrease to 4.43 eV (for blends loaded with ZnS 100%). This can be returned to the increase in the degree of disordering within the band gap due to the strong interaction that occurred between ZnS nanoparticles and the polymer matrix leading to a decrease in the number of intermolecular hydrogen bonds within the polymer matrix. Besides, the increase in the band gap values when moving in graded steps from ZnS 100% to NiO 100% reflects the particle size vital role in changing the band gap structure through decreasing the number of defects and hence creating less number of unstructured localized states through which electrons can transit from valence to conduction band. Results represented here confirm the poor interaction between NiO nanoparticles and the polymer matrix discussed before. S. El–Khiyami group interpreted the decrease in the band gap values of polystyrene (PS) polymer matrix doped with NiO nanoparticles based on formation of new localized states as discussed in our research work [Citation57]. Figure (a) represents the variations of the extinction coefficient k of pure and loaded CMC/PVP blends with the wavelength. k is considered as an optical parameter describes the variations occur in the absorption properties within the material under the effect of an incident beam of photons. It is the imaginary part in the complex refractive index equation: n* = n + ik and can be calculated from:
where λ is the wavelength of the incident photons and α is the absorption coefficient. Due to the dependence of the extinction coefficient k on α, the optical spectra of k look to a great extent similar to the absorbance spectra especially in the visible region. The gradual increase in k spectra from blends loaded with NiO 100% to these loaded with ZnS 100% was returned to the decrease in the number of hydrogen bonds that formed between the polymer blend chains due to the presence of ZnS nanoparticles and hence increasing the degree of amorphousity within the matrix. Another possible explanation for this attitude can be returned to the effect of the particle size of the embedded nanoparticles where smaller particle size is the main cause for modifying the polymer matrix internal structure through increasing the number of defects and then causing less stress relaxation. Results similar to ours have been represented based on nanocomposite films of (PVA–CMC) blend and (PVA–CMC) blend doped by niobium carbide nanoparticles [Citation58]. The refractive index n is an important optical parameter especially in the industry field. Its applications extended to electronic and optoelectronic devices. It can be calculated from [Citation59,Citation60]:
where R is the reflectance.
Figure 5. (a) Direct and (b) indirect Tauc relations and (c) the variation of direct and indirect optical band gaps with the nano compositions for CMC/PVP blends doped ZnS and NiO nanoparticles.

Figure 6. (a) Extinction coefficient and (b) refractive index for CMC/PVP blends doped ZnS and NiO nanoparticles.

Table 1. Optical parameters data for CMC/PVP/(1 − x) NiO − x ZnS blends.
The refractive index spectra for both pure and loaded blends are shown in Figure (b). It is clear from the figure that the refractive index values for CMC/PVP blends loaded with ZnS 100% nanoparticles are higher than those loaded with NiO 100% nanoparticles. These different values of the refractive index prove the existence of variations within the intermolecular polymer structure. Since the refractive index is highly dependent on the density of the medium, the rise in the refractive index values with ZnS proportion is a clear evidence of the formation of new intermolecular bonds between added nanoparticles and the polymer structure which increases the density and suppresses the formation of new hydrogen bonding between polymer chains. The decrease in n values with λ indicates that the polarization state of the polymer molecules decreases under the effect of the incident low-energy photons due to the high inertia of the polymer molecules. The dispersion data of the refractive index below the interband absorption edge can be analysed based on the single oscillator model using the well-known equation of Wemple and DiDomenico [Citation61,Citation62]:
where E is the incident photon energy (hν),
and
are the dispersion energy and the single-oscillator energy, respectively.
measures of the strength of interband optical transitions and it doesn’t depend on Eg while
measures the average excitation energy for electronic transitions. Both
and
can be obtained from a graph when plotting the relation between (
)−1 and (hν)2 as shown in Figure (a). The different values for the dispersion parameters
and
are shown in Table . According to the table,
values increases from 13.29 eV (for pure blends) to 34.77 eV (for blends loaded with ZnS 100% nanoparticles) while
decreases from 9.58 eV (for pure blends) to 5.05 eV (for blends loaded with ZnS 100% nanoparticles) with the well known consequence for the interchangeable proportions between ZnS and NiO nanoparticles. The rise in
values gives an apparent image to the modifications occurred within the internal structure of the band gap due to increasing the degree of amorphousity within the polymer matrix. The gradual increase in
values looks consistent with the gradual decrease in band gap values for both direct and indirect transitions which reflects the strength of interband optical transitions. The decrease in
values confirms the idea that less energy is needed to activate electrons for proper transitions due to induced modifications within the band gap structure. The registered values of dispersion parameters are consistent with the higher values of the refractive index. These results agreed quite well with Muaffaq et al. [Citation63] and Khayal et al. [Citation64] with only difference is that their
and
values decrease together and this can be returned to the filler material used to in this case; Muaffaq work based on polymer composites made of polyvinyl alcohol polymer and Co2+ ions from cobalt (II) nitrate while Khayal et al. work based on black tea leaves solution and (Zn2+- PPL complexes).
Figure 7. Relations between (a) n2 vs λ2, (b) (n2 − 1)−1 vs (hν)2 and (c) (n2 − 1)−1 vs λ−2 for CMC/PVP blends doped ZnS and NiO nanoparticles.

To calculate (long wavelength refractive index), So (average dipole oscillator strength) and λo (average wavelength of the oscillator) for pure and loaded samples based on the single-oscillator approximation, one can use the following equations [Citation65]:
From the above equation, one can write:
where
. Plotting the relation between 1/(n2 − 1) and λ−2 as shown in Figure (b) one can obtain
and
values based on the intercept and the slope, respectively.
can be calculated depending on
and
values. Figure (c) reveals the relation between n2 and λ2 and from the slope of the linear lines, the values of
(the carrier concentration effective number to the electron effective mass) can be calculated. The relation between the refractive index n, the real part of the dielectric constant
, the wavelength λ and the lattice dielectric constant
are given by [Citation66]:
The high frequency dielectric constant
can be calculated based on
as:
[Citation61]. The values of the optical parameters (So,
,
,
,
) are tabulated in Table . Analysing these data is very important future optoelectronic applications. The effect of interchangeable proportions of ZnS and NiO nanoparticles on the CMC/PVP blends can be noticed when comparing the values declared in Table . The values of
and
for pure blends (1.55 and 98.35 nm, respectively) differ from those doped with NiO 100% (1.61, 60.95 nm, respectively) and those doped with ZnS 100% (1.67, 98.28 nm, respectively). This variation confirms the idea of strong interaction with the polymeric material in case of small particle size ZnS nanoparticles leading to new intermolecular bonds and rise in the density via increasing the number of defects and producing less stress relaxation . The weak interaction in case of NiO nanoparticles has been confirmed as well.
The increase in λo (the average wavelength of the oscillator) values with ZnS nanoparticles from 25% to 100% when compared to the wavelength of blends loaded with NiO 100% reveals that the electrons in the small particle size nanomaterial (ZnS) are oscillating at the frequency of incident electromagnetic beam of photons [Citation67,Citation68].
The values of So (average oscillator strength) look to some extent affected by interchangeable proportions of ZnS and NiO nanoparticles. An opposite behaviour between So and can be observed for blends loaded with NiO 100% (4.28 × 10⁻⁴) and those loaded with ZnS 100% (1.85 × 10⁻⁴) which indicates strong interband optical transitions decrease the average oscillator strength. The rise in the values of (
,
,
) with changing the proportion between NiO and ZnS from NiO 100% to ZnS 100% indicates that these optical parameters are closely related to the new structural modifications due to recent intermolecular bonds formed by the particle size effect of the loaded nanoparticles. The rise in
compared to
can be attributed to the free charge carrier’s contributions which are responsible for the polarization process within the polymeric material under the effect of the incident light. Others from the literature [Citation69] represented a disagreement between the values of
and
and they returned this disordering to the free carrier contribution based on the films prepared. M Baraker et al. represented a fluctuation in the values of
and
with the doping level based on concentrations from 0.5 wt% up to 40 wt% of cadmium chloride (CdCl2) with polyvinylalcohol films [Citation68].
The process of modifying the dielectric constant of polymers under test to value these materials for photonic or optoelectronic device applications is very important. The electron excitation process within a polymer matrix can be described using the frequency-dependence complex dielectric constant where
is a real dielectric constant and
is imaginary dielectric constant [Citation70]. These real and imaginary dielectric parameters give detailed information about the interaction mechanism between the incident photons and the polymer matrix.
refers to the change that occurs to the speed of the incident electromagnetic beam of photons due to the polarization of molecules in the presence of an electromagnetic field (i.e. it refers to the dispersion process within the polymer medium) and
provide information about the electromagnetic waves dissipation in the medium. Figure (a,b) shows the dependence of the real and imaginary dielectric constant parts on the wavelength for both pure and loaded blends. Both
and
values showed similar behaviour, that is a decrease with the wavelength increase (the dispersion spectra of
are not shown) while in the visible region, the overall trend looks constant. The higher values of
compared to these of
confirmed the rise in the probability of occurring dispersion within the polymer matrix compared to the dissipation process of the incident electromagnetic beam during the interaction process due to the presence of nanoparticles. The decrease in
values in the short wavelength region indicates an enhancement in the polarization process of the polymer medium molecules by the incident electromagnetic energy and hence less absorption of incident photons can be observed due to the formation of new intermolecular complexes caused by the presence of sulphide and nickel ions. The increase in
values with the proportion between ZnS and NiO nanoparticles until it reaches the highest values in case of ZnS 100% nanoparticles can be attributed to the strong interaction between sulphide ions and the polymer matrix causing an increase in the number of disorders and hence degree of amorphousity. The overall behaviour of
spectral values agrees quite well with those represented in Figure of the refractive index and the extinction coefficient respectively. The optical conductivity
is an important parameter in the process of optoelectronic device fabrication because it provides information about the electronic states. It refers to the polymer electrical conductivity that depends on free charge carriers induced by the electric field accompanying the incident electromagnetic energy. The optical conductivity can be calculated based on both the refractive index and absorption coefficient from [Citation71,Citation72]:
where c is the velocity of light.
Figure 8. Optical (a) real part, (b) imaginary part of the dielectric constant and (c) conductivity for CMC/PVP blends doped ZnS and NiO nanoparticles.

Figure (c) shows a decrease in values with the wavelength for all pure and loaded samples, this can be returned to the decrease in the absorption attitude because of the low transmission of low-energy incident photons. The increase in
values with the proportion between ZnS and NiO concentrations until the highest values at ZnS 100% can be attributed to the increase in the number free electrons produced by both incident photons and ZnS nanoparticles strong interaction besides the increase in the degree of amorphousity of the host blends. Our results are in agreement with the literature [Citation73–75].
3.2. A study of transmittance attenuation of laser beams by CMC/PVP blends doped znS and niO nanoparticles
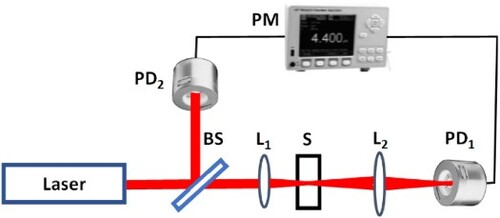
The transmitted intensity from the investigated samples is investigated at three different wavelengths: A He–Ne laser of power 0.5 mw, wavelength 632.8 nm (Leybold didactic GMBH), a Nd:YAG diode pumped laser of power 100 mW and wavelength 532, and a diode laser (Z-Laser GmbH, Z30M18H-F-450-pe) at a wavelength 450 nm and a power of 30 mw are used in our study. The power of the input, output and reference of the laser beam were measured by using a dual-channel optical meter (Model: Newport 2936-C Series) that are attached to two 918D-high performance calibrated photodiode sensors. Figure shows a schematic diagram of the set-up. The sample is fixed at the focus of a lens placed between the laser and the sample. The transmitted light passed through another sample and the detectors are placed at the focus of this lens. The transmittance was measured for the pure CMC/PVP blends and doped with different interchangeable proportions of volume percentage on ZnS and NiO nanoparticles loaded within the blends. Figure presents the transmittance for different samples. As shown in Figure (a), the highest transmittance is from the pure sample. With increasing/decreasing the concentration of ZnS/NiO the transmittance decreases at all used laser wavelengths. However, the minimum transmittance takes place at 540 nm. Others represented results agrees with the research work represented here [Citation76–78]. Figure (b) presents the change in transmittance for all doped blends in comparison to the pure blend. At 100% doping by NiO and 0% ZnS the transmittance decreases by 27% at 450 nm, about 23% at 532 and 633 nm. By decreasing the doping level of NiO and increasing the doping by ZnS the transmittance decreases more and more till getting a decrease in transmittance of about 59% at 450 nm, 58% at 532 nm, and 45% at 633 nm. This behaviour agrees well with the transmittance spectra measure for the samples. Getting a reduction in transmittance with these values makes the material promising as attenuating filters in laser laboratories at doping levels starting from 75% NiO or less and 25% of ZnS and more even if at relatively high laser powers as obtained at green and blue lasers.
Figure 9. Schematic diagram of the set-up used to measure the transmittance of the samples. BS is a beam splitter, L1 and L2 are two lenses, S is the investigated sample, PD1 and PD2 are photodiodes, and PM is an optical power meter.

Figure 10. (a) Transmittance and (b) change in transmittance for CMC/PVP blends doped ZnS and NiO nanoparticles.

4. Conclusion
The role of interchangeable proportions of ZnS and NiO nanoparticles in CMC/PVP blends was explored. XRD analysis revealed that NiO and ZnS have a cubic phase with crystallite sizes 70 and 3 nm, respectively. XRD confirmed the semicrystalline of the blends and the presence of the nanofiller over the blend matrix. Blend with more ZnS has more amorphous nature. CMC/PVP blends loaded with 100% NiO nanoparticles revealed higher values of absorbance compared to pure blends while increasing the proportion of ZnS nanoparticles from 25% to 100%. A slight decrease in band gap values from 5.04 eV (for pure bends) to 5.01 eV (for blends loaded with NiO 100%) while, a noticed decrease to 4.43 eV (for blends loaded with ZnS 100%). The refractive index values for CMC/PVP blends loaded with ZnS 100% nanoparticles are higher than those loaded with NiO 100% nanoparticles. The values of (So,
,
,
),
, dielectric constant and optical conductivity were affected by interchangeable proportions of ZnS and NiO nanoparticles. The highest transmittance of the laser is from the pure sample. At 100% doping by NiO and 0% ZnS, the transmittance of the laser decreases by 27% at 450 nm, about 23% at 532 and 633 nm. By decreasing the doping level of NiO and increasing the doping by ZnS the transmittance of the laser decreases more and more till getting a decrease in transmittance of about 59% at 450 nm and 58% at 532 nm, and 45% at 633 nm.
Acknowledgment
The authors extend their appreciation to Taibah University, represented by Deanship of Scientific Research, for funding this project No. RC-442/34.
Disclosure statement
No potential conflict of interest was reported by the author(s).
Additional information
Funding
References
- El-naggar AM, Heiba ZK, Kamal AM, et al. Impact of loading PVA/CMC/PVP blend with CdS0.9M0.1 non-stoichiometrically doped by transition metals (M). Opt Mater. 2022;133:113085–113100.
- El-naggar AM, Heiba ZK, Kamal AM, et al. Linear and nonlinear optical characteristics of PVA/CMC/PEG blended polymer loaded with ZnS formed at different temperatures. J Mater Sci Mater Electron Vol. 2023;34:114–124.
- El-naggar AM, Heiba ZK, Kamal AM, et al. Structural, thermal, and linear/nonlinear optical performance of PVA/CMC polymer blend doped with ZnS/V prepared at different temperatures. J Polym Res. 2022;29:475–494.
- Moeen S, Ikram M, Haider A, et al. Comparative study of sonophotocatalytic, photocatalytic, and catalytic activities of magnesium and chitosan-doped Tin oxide quantum dots. ACS Omega. 2022;7(50):46428–46439.
- El-naggar AM, Heiba ZK, Kamal AM, et al. Enhancing the linear and nonlinear optical properties by ZnS/V-doped polyvinyl alcohol/carboxymethyl cellulose/polyethylene glycol polymeric nanocomposites for optoelectronic applications. J Mater Sci: Mater Electron. 2022;33:25127–25138.
- Kumar KN, Rao JL, Ratnakaram YC. Optical, magnetic and electrical properties of multifunctional Cr3+: polyethylene oxide (PEO) + polyvinylpyrrolidone (PVP) polymer composites. J Mol Struct 2015;1100:546–559.
- El-naggar AM, Heiba ZK, Kamal AM, et al. Influence of nanocomposite (1-x)CdS/xCuS on optical characteristics of PVA/CMC/PEG blended polymer; effect of ratio (x). Opt Mater. 2022;133:112923–112935.
- Muhammad Ikram, Ali Haider, Syeda Tayaba Bibi, Anwar Ul-Hamid, Junaid Haider, Iram Shahzadi, Walid Nabgan, Sawaira Moeen, Salamat Ali, Souraya Goumri-Said, Mohammed Benali Kanoun.
- Alhazime AA, Mohamed MB, Abdel-Kader MH. Effect of Zn1−xMgxS doping on structural, thermal and optical properties of PVA. J Inorg Organomet Polym Mater. 2019;29(2):436–443.
- El Sayed AM. Synthesis and controlling the optical and dielectric properties of CMC/PVA blend via γ-rays irradiation. Nucl Instrum Meth B. 2014;321:41–61.
- Heiba ZK, Mohamed MB, El-naggar AM, et al. Impact of ZnCdS/M (M = Co, Fe, Mn, V) doping on the structure and optical properties of PVA/PVP polymer. J Polym Res. 2021;28:472–485.
- Mohamed MB, Abdel-Kader MH. Effect of excess oxygen content within different nano-oxide additives on the structural and optical properties of PVA/PEG blend. Appl Phys A. 2019;125:209–230.
- Mohamed MB, Abdel-Kader MH. Effect of annealed ZnS nanoparticles on the structural and optical properties of PVA polymer nanocomposite. Mater Chem Phys. 2020;241:122285.
- Adel M. El Sayed, S. Saber, Structural, optical analysis, and Poole–Frenkel emission in NiO/CMC–PVP: Bio-nanocomposites for optoelectronic applications J Phys Chem Solids 163 (2022) 110590.
- Mohammed G, El-Gamal S, Sayed AME, et al. Synthesis, structural, optical and electrical characterization of Y2O3 poly(ethylene glycol)–poly(vinyl chloride) based nanocomposite solid polymer electrolytes. Polym Int. 2023;72(3):342–355. doi:10.1002/pi.6472.
- El Sayed AM, Desoky A, Mohamad M. Synthesis, structural, thermal, optical and dielectric properties of chitosan biopolymer; influence of PVP and α-Fe2O3 Nanorods. J Polym Res. 2018;25:175–199.
- Heiba ZK, Mohamed MB, Abdel-Kader MH. Experimental and theoretical investigations on intermediate band in doped nano-SnS2. J Electron Mater. 2018;47(5):2945–2953.
- Elfadl AA, Tarek E, El Sayed AM. Improving the optical and thermal properties, and stress-strain behavior of a PV(Ac–C) blend using PbO and MgO nanofillers: a comparative study. J Phys Chem Solids. 2022;170:110963–110980.
- El Sayed AM, El-Gamal S. Influence of NiO and La2O3 nanoparticles on the optical, mechanical and electrical properties of PVAc–PMMA blend: a comparative study. Phys. Scr. 2022;97:055814–055822.
- El-Sayed S, El Sayed AM. Preparation and characterization of CuO/Co3O4/poly(methyl methacrylate) nanocomposites for optical and dielectric applications. J Mater Sci: Mater Electron. 2021;32:13719–13737.
- Mohammed MI, Mahmoud AS, Yahia IS. Design novel, flexible, and wide-scale CUT-OFF laser filters of eosin yellow dye/PVA polymeric composite films: enhance the electrical conductivity and dielectric properties of PVA. Optik (Stuttg). 2022;253:168582–168602.
- Khairy Y, Yahia IS, Elhosiny Ali H. Facile synthesis, structure analysis and optical performance of manganese oxide-doped PVA nanocomposite for optoelectronic and optical cut-off laser devices. J Mater Sci: Mater Electron. 2020;31:8072–8085.
- Fazlali F, Mahjoub AR, Abazari R. A new route for synthesis of spherical NiO nanoparticles via emulsion nano-reactors with enhanced photocatalytic activity. Solid State Sci. 2015;48:263–269.
- Mohamed MB. Effect of doping and changing of the annealing temperature on the structural and optical properties of ZnS. Int J Appl Ceram Technol. 2020;17(2):823–831.
- Nouh SA, Abdel-Kader MH, Mohamed MB. Structural and optical modifications in polyvinyl alcohol Due to Cr2O3 nanoparticles additives concentration, and gamma irradiation. Adv Polym Technol. 2017;36(3):336–351.
- Morsi MA, Rajeh A, Menazea AA. Nanosecond laser-irradiation assisted the improvement of structural, optical and thermal properties of polyvinyl pyrrolidone/carboxymethyl cellulose blend filled with gold nanoparticles. J Mater Sci: Mater Electron. 2019;30:2693–2705.
- Eisa WH, Abdel-Moneam YK, Shabaka A, et al. In situ approach induced growth of highly monodispersed Ag nanoparticles within free standing PVA/PVP films. Spectrochim Acta A. 2012;95:341–346.
- El-Bana M, Mohammed G, El Sayed AM, et al. Preparation and characterization of PbO/carboxymethyl cellulose/polyvinylpyrrolidone nanocomposite films. Polym Compos. 2017;39:3712–3725.
- Morsi M, Abdelaziz M, Oraby A, et al. Effect of lithium titanate nanoparticles on the structural, optical, thermal and electrical properties of polyethylene oxide/carboxymethyl cellulose blend. J Mater Sci: Mater Electron. 2018;29(18):15912–15925.
- Gupta B, Agarwal R, Alam MS. Preparation and characterization of polyvinyl alcohol-polyethylene oxide-carboxymethyl cellulose blend membranes. J Appl Polym Sci. 2013;127(2):1301–1308.
- Hezma AM, Elashmawi IS, Rajeh A, et al. Change spectroscopic, thermal and mechanical studies of PU/PVC blends. Phys B. 2016;495:4–10.
- Wang M, Xu L, Hu H, et al. Radiation synthesis of PVP/CMC hydrogels as wound dressing. Nucl Instrum Methods Phys Res B. 2007;265(1):385–389.
- Kumar KK, Ravi M, Pavani Y, et al. Investigations on PEO/PVP/NaBr complexed polymer blend electrolytes for electrochemical cell applications. J Membr Sci. 2014;454:200–211.
- Kumar KN, Sivaiah K, Buddhudu S. Structural, thermal and optical properties of Tb3+, Eu3+ and co-doped (Tb3++Eu3+): PEO+PVP polymer films. J Lumin. 2014;147:316–323.
- Kumar K, Ravi M, Pavani Y, et al. Compositional dependence of optical parameters in Se–Bi–Te–Ag thin films. J Non-Cryst Solids. 2012;358(23):3205–3228.
- Abdelghany A, Abdelrazek E, Rashad D. Impact of in situ preparation of CdS filled PVP nano-composite. Spectrochim Acta Part A. 2014;130:302–308.
- Morsi MA, Rajeh A, Menazea AA. Nanosecond laser-irradiation assisted the improvement of structural, optical and thermal properties of polyvinyl pyrrolidone/carboxymethyl cellulose blend filled with gold nanoparticles. J Mater Sci: Mater Electron. 2019;30:2693–2705.
- Mohamed MB, Abdel-Kader MH, Alhazime AA, et al. Effect of preparation methods and doping on the structural and tunable emissions of CdS. J Mol Struct. 2018;1155:666–674.
- Al–Attiyah KHH, Hashim A, Obaid SF. Fabrication of novel (carboxy methyl cellulose–polyvinylpyrrolidone–polyvinyl alcohol)/lead oxide nanoparticles: structural and optical properties for gamma rays shielding applications. Int J Plastics Technol. 2019;23:39–45.
- Heiba ZK, Mohamed MB, Ahmed SI. Exploring the physical properties of PVA/PEG polymeric material upon doping with nano gadolinium oxide. Alexandria Eng J. 2022;61(5):3375–3383.
- Khalil AM, Hassan ML, Ward AA. Novel nanofibrillated cellulose/polyvinylpyrrolidone/silver nanoparticles films with electrical conductivity properties. Carbohydr Polym. 2017;157:503–511.
- Ikram M, Haider A, Imran M, et al. Assessment of catalytic, antimicrobial and molecular docking analysis of starch-grafted polyacrylic acid doped BaO nanostructures. Int J Biol Macromol. 2023;230:123190–123212.
- Khorsand Zak A, Ebrahimizadeh Abrishami M, Abd. Majid WH, et al. Effects of annealing temperature on some structural and optical properties of ZnO nanoparticles prepared by a modified sol–gel combustion method. Ceram Int. 2011;37:393–398.
- Heiba ZK, El-naggar AM, Mohamed MB, et al. Modifications of the structural and optical properties of PVA/PVP loaded with Zn0.75-xCd0.25VxS nano powders. Opt Quantum Electron. 2022;54:452–473.
- Soliman TS, Vshivkov SA, Soliman TS, et al. Effect of Fe nanoparticles on the structure and optical properties of polyvinyl alcohol nanocomposite films. J Non-Cryst Solids. 2019;519:119452–119472.
- Nouh SA, Abdel-kader MH, Mohamed MB. Structural and optical modifications in polyvinyl alcohol Due to Cr2O3 nanoparticles additives concentration, and gamma irradiation. Adv Polym Technol. 2017;36(3):336–340.
- Ramesan MT, Nidhisha V, Jayakrishnan P. Facile synthesis, characterization and material properties of a novel poly(vinyl cinnamate)/ nickel oxide nanocomposite. Polym Int. 2017;66:548–556.
- Rashad M. Tuning optical properties of polyvinyl alcohol doped with different metal oxide nanoparticles. Opt Mater. 2020;105:1–6.
- Venkatram N, Narayana Rao D, Akundi MA. Nonlinear absorption, scattering and optical limiting studies of CdS nanoparticles. Optica Pub Group Exp. 2005;13(3):867–872.
- Abdel–Kader MH, Mohamed MB. Exploring the direct effect of intermediate band semiconductor materials on the structural, thermal and optical properties of PMMA nanocomposite. Appl Phys A. 2020;126(2):89–102.
- El-Bana MS, Mohammed G, El Sayed AM, et al. Preparation and characterization of PbO/carboxymethyl cellulose/polyvinylpyrrolidone nanocomposite films. Polym Compos. 2018;39(10):3712–3725.
- Wang B, Zhou K, Jiang S, et al. Poly(methyl methacrylate)/layered zinc sulfide nanocomposites: preparation, characterization and the improvements in thermal stability, flame retardant and optical properties. Mater Res Bull. 2014;56:107–112.
- Sharma K, Kumar P, Verma G, et al. Optical properties of transition metal doped ZnS nanoparticles in PVK based nanocomposite films. Optik (Stuttg). 2020;206:164357–164378.
- Tiwari A, Dhoble SJ. Stabilization of ZnS nanoparticles by polymeric matrices: syntheses, optical properties and recent applications. RSC Adv. 2016;6(69):64400–64420.
- El-naggar AM, Heiba ZK, Mohamed MB, et al. Thermal, linear and nonlinear optical properties of PVA/PVP/PEG blends loaded with nanovanadium-doped nano tin disulfide. J Mater Sci: Mater Electron. 2022;33(34):25743–25752.
- Taha TA, Hendawy N, El–Rabaie S, et al. Effect of NiO NPs doping on the structure and optical properties of PVC polymer films. Polym Bull. 2018;76(9):4769–4784.
- El–Khiyami SS, Ismail AM, Hafez RS. Characterization, optical and conductivity study of nickel oxide based nanocomposites of polystyrene. J Inorg Organomet Polym Mater. 2021;31(11):4313–4325.
- Hashim A, Hadi Q. Synthesis of novel (polymer blend-ceramics) nanocomposites: structural, optical and electrical properties for humidity sensors. J Inorg Organomet Polym Mater. 2018;28(4):1394–1401.
- Yahia IS, Farag AAM, Cavas M, et al. Effects of stabilizer ratio on the optical constants and optical dispersion parameters of ZnO nano-fiber thin films. Superlattices Microstruct. 2013;53:63–75.
- Heiba ZK, Ahmed SI, Mohamed MB. Effects of composition ratio of nano ZnS on structural and optical characteristics of Eu-doped maghemite/ZnS nanocomposite system. Appl Phys A. 2022;128(8):633–655.
- El-Nahass MM, Farag AAM, Atta AA. Influence of heat treatment and gamma-rays irradiation on the structural and optical characterizations of nano-crystalline cobalt phthalocyanine thin films. Synth Met. 2009;159(7–8):589–594.
- Wemple SH, DiDomenico M. Behavior of the electronic dielectric constant in covalent and ionic materials. Phys Rev B. 1971;3(4):1338–1351.
- Nofal MM, Aziz SB, Hadi JM, et al. Polymer composites with 0.98 transparencies and small optical energy band Gap using a promising green methodology: structural and optical properties. Polymers (Basel). 2021;13(10):1648–1663.
- Ahmed KK, Hussen SA, Aziz SB. Transferring the wide band gap chitosan: POZ-based polymer blends to small optical energy band gap polymer composites through the inclusion of green synthesized Zn2+-PPL metal complex. Arab J Chem. 2022;15(7):103913–103933.
- Yakuphanoglu F, Durmus M, Okutan M, et al. The refractive index dispersion and the optical constants of liquid crystal metal-free and nickel(II) phthalocyanines. Phys B. 2006;373(2):262–266.
- Abdullah OG, Salman YAK, Saleem SA. In-situ Synthesis of PVA/HgS Nanocomposite Films and Tuning Optical Properties .Phys Mater Chem. 2015;3(2):18–24.
- Aziz SB, Nofal MM, Brza MA, et al. Innovative green chemistry approach to synthesis of Sn2+-metal complex and design of polymer composites with small optical band gaps. Molecules. 2022;27(6):1965–1988.
- Baraker BM, Lobo B. Dispersion parameters of cadmium chloride doped PVA-PVP blend films. J Polym Res. 2017;24(5):84–104.
- El-Nahass MM, Farag AAM, Ibrahim EM, et al. Structural, optical and electrical properties of thermally evaporated Ag2S thin films. Vacuum. 2004;72(4):453–460.
- Taha TA, Ismail Z, Elhawary MM. Structural, optical and thermal characterization of PVC/SnO2 nanocomposites. Appl Phys A. 2018;124(4):307–330.
- Yaqub N, Farooq WA, AlSalhi MS. Electrical conductivity and dielectric characteristics of in situ prepared PVA/HgS nanocomposite films. Heliyon 6. 2020;11:05597–05613.
- Mirji R, Lobo B. Linear and non-linear optical parameters of polycarbonate reinforced inorganic bismuth nitrate pentahydrate salt composite. Opt Mater. 2021;113:110862–110884.
- El-naggar AM, Heiba ZK, Mohamed MB, et al. Investigating the structural and linear/nonlinear optical parameters of PVA/CMC blend loaded by ZnS quantum dots. J Sol-Gel Sci Technol. 2022;104(1):53–66.
- Mohamed MB, Abdel-Kader MH, Alhazime AA. Structural and optical properties of doped ZnO/SiO2 nanocomposite. Int J Appl Ceram Technol. 2019;16(3):1209–1217.
- Mohamed MB, Abdel-Kader MH, Almarashi JQM. Role of Cu/S ratio and Mg doping on modification of structural and optical characteristics of nano CuS. Int J Appl Ceram Technol. 2020;17(2):832–840.
- Mohamed MB, Abdel-Kader MH. Sns2/polycarbonate nanocomposites: structural and optical characterizations. J Inorg Organomet Polym Mater. 2020;30(6):2289–2298.
- Abdel-Kader MH, Mohamed BM. Exploring the direct effect of intermediate band semiconductor materials on the structural, thermal and optical properties of PMMA nanocomposite. Appl Phys A. 2020;126(89):1–11.
- Almarashi JQM, Abdel-Kader MH. Exploring nano-sulfide enhancements on the optical, structural and thermal properties of polymeric nanocomposites. J Inorg Organomet Polym Mater. 2020;30(8):3230–3240.