
Abstract
Waste matter is an abundant source of recyclable materials. This study presented the corrosion inhibitor role of unripe banana peel extract (UBPE) for carbon steel in acidic environments: 1.0 M HCl, 0.5 M H2SO4, and 0.5 M HCl/0.25 M H2SO4. The aim was to demonstrate the robustness of the HCl-UBPE-steel system with respect to competing ions in the solution, and as such, generalizing its mechanism. The localized corrosion in HCl, general corrosion in H2SO4, and their theoretical midpoint were, respectively, subjected to 95.91%, 83.33%, 91.50% corrosion inhibition efficiency when UBPE was added at 3000 ppm. A protective film on the steel surface was found as the cause by electrochemical characterizations and its behavior was explained via protonation of corrosion inhibitor and rust formation on steel surface undering varying acid conditions. Therefore, the work suggests UBPE as corrosion inhibitor for steel in strongly acidic conditions containing chloride and sulfate ions.
Highlights
Unripe banana peel – water extract (UBPWE) acts as an eco-friendly effective inhibitor for steel in aggressively acidic environments.
Carbon steel exhibits more localized corrosion in HCl solution, but more general corrosion in H2SO4 condition.
UBPWE performed 95.91, 83.33, and 91.50% of inhibition efficiency for steel in HCl, H2SO4, and mixed conditions.
The effective inhibition performance is assigned to the presence of a protective layer on the steel surface.
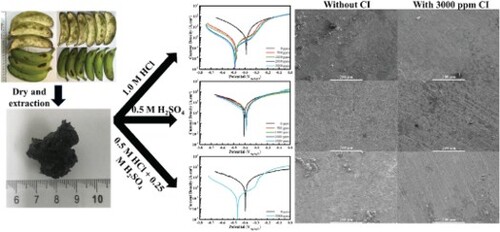
GRAPHICAL ABSTRACT
1. Introduction
Bananas are one the most widely cultivated fruits in the world, serving as an easily digested snack or the main ingredient of a nutritious meal. Practically, all parts of the banana plant, besides the peel, can be eaten and have another significance in fibre-making or cultural icon [Citation1] Instead, the peel, despite being largely considered waste matter, has found notable uses in the field of medicine (thanks to the working of tryptophan against depression, iron against anaemia, dopamine against Parkinson’s disease, fructooligosaccharides as a probiotic, leucocyanidin for thickening of the mucous membrane of the stomach, as well as several contributions to alleviating diarrhoea and stomach ulcers), biogas (fermentable polysaccharide content) [Citation2] and more recently as a potent reducing agent (phenolic content) [Citation3–5], biosorbent (pectin content) [Citation6] and corrosion inhibitor [Citation7]. Specifically, the rich phenolic compounds in banana peels are often used as antioxidants (reducing agents), which are a promising hint at a possible corrosion inhibitor [Citation8,Citation9].
Corrosion inhibitors are additives to a corrosive environment that would otherwise transform the metal inside it into a more stable form (corrosion product) according to thermodynamics [Citation10]. While the complete prevention of corrosion can be economically prohibitive or even outright impossible in certain cases, corrosion inhibitors offer reasonable balance between cost and effect as a non-disruptive and low-cost solution to the corrosion problem [Citation9]. They can change the reaction pathway and/or equilibrium, greatly diminishing the corrosion kinetics (cathodic corrosion inhibitor); or they can convert the active metal surface into passivation (anodic corrosion inhibitor); or they can encourage the formation of a corrosion product that is stable in both diffusion and activation conditions (mixed corrosion inhibitor) [Citation11–16]. Regardless of what they do, all good corrosion inhibitors share the same three traits: Having a good efficiency at low concentration, being cheap and abundant and being safe to human and the environment [Citation17–19]. The fact that banana peels have been demonstrated with corrosion inhibiting properties [Citation7] and are generally considered a biowaste means that they are an ideal corrosion inhibitor candidate, along with other green sources for corrosion inhibitor such as leaves [Citation20–22], flowers [Citation23,Citation24], seeds [Citation25], roots [Citation26,Citation27], etc.
In general, peel extracts of various origins have been used as corrosion inhibitors successfully. These include, but are not limited to, those of the longan fruit, passion fruit, orange, mango, cashew [Citation28,Citation29], etc., all of which showed reductions in both metal dissolution and hydrogen generation. The principles of corrosion inhibition were suggested to be: (1) protonated active components that compete with hydrogen evolution and/or decrease acidic activity near the surface; (2) adsorbed active species onto the metal surface via aromatic/heterocyclic pi-electron and metallic d-orbital or via electron donor–acceptor interaction of functional groups such as N, P, S, O, etc.; and more notably (3) synergistic interaction between the chloride ions and the corrosion inhibitor molecules as explained by mixed potential theory [Citation30]. Interestingly, the third principle, which contrasts HCl with other acids, has not been fully explored in the mentioned studies. Furthermore, banana peels contain a wealth of phenolic compounds, flavonoids, gallocatechin and dopamine [Citation31], all of which fit one or more of the mentioned principles. Therefore, banana peels are suitable for corrosion inhibitor investigation.
As for the current progress on banana peel [Citation7] has shown that the ripening process can have a strong effect on banana peel extract as a corrosion inhibitor, which was explained with the decomposition of its main active component into more simple parts. Nevertheless, the lack of crucial information such as detailed film formation over an extended amount of time, surface atomic composition and the significance of counterion species on inhibition mechanism left much to be desired. Furthermore, bananas of the investigated cultivar (Cavendish) are suitable for raw consumption, industrial processing and as a cooking ingredient, traditional medicine as well even when they are unripe [Citation2], meaning that there are plenty opportunities to obtain their peels as a side product. All in all, the corrosion inhibitory effect of unripe banana peel and the full extent of its potential and mechanism as a corrosion inhibitor are valuable discoveries and may the proposal of inhibition mechanism in this study serves to complement future investigations of green corrosion inhibitors just as having been laid out by Umoren et al. [Citation32].
2. Experiments
Banana peel of the Cavendish cultivar (3350 g) was obtained from fresh green banana (10.0 kg) without fruit apex and stalk. The peels were macerated at ambient temperature with Ethanol:Water (4:1, v/v). This ratio enjoyed the benefit of being a strong solvent (ethanol part) while also being able to extract dopamine which is water soluble. Consideration for dopamine was due to its presence in specifically green banana peel [Citation2], and its potential use for creating corrosion inhibitors for steel [Citation33,Citation34]. The solvent was evaporated in a vacuum to afford crude extract (95.7 g). This unripe banana peel extract (UBPE) was refrigerated for storage before the following experiments. The time between harvesting and completion of the process was within 24 h. The extracted product was stored at 4°C and also characterized using liquid chromatography-mass spectrometry (LCMS-MS) and attenuated total reflectance Fourier transform infrared spectroscopy (ATR-FTIR) before the following experiments.
This was a 24-hour two-step process which made full recycling of the solvent used, unlike Ji’s method [Citation7] for instance. The only waste after the process was the peel residue which can be safely discarded or used as a soil conditioner. However, finding collaborators to handle the unripe banana pulp might take some efforts because, unlike ripe banana pulp which is favoured for industrial processing, it is a traditional ingredient largely only found in the kitchen of households and restaurants. And thus, it is acknowledged that bananas salvaged from food processing plants or bought from the market, as they were in this study, may not be a viable source on a commercial or industrial scale, only on the laboratory scale. Instead, locally promoting this ingredient for its health benefits when cooked green [Citation1,Citation35,Citation36], which accounts for 44% of global banana production [Citation31] and is outside the scope of this study, should make collecting this so-called “waste” more practical.
All electrochemical experiments were carried out in a flat cell as a standard electrochemical cell with a double-jacketed 250 mL cell of two different acidic solutions, 1.0 M acid hydrochloric and 0.5 M acid sulphuric, each containing 0, 100, 500, 1000, 2000 and 3000 ppm of UPBWE at room temperature for a total of 14 different conditions. It consisted of a steel specimen (fabricated by computerized numerical control and cold mounted with epoxy to ultimately achieve a 1 cm2 exposed surface area) ground by 2000 grit number silicon carbide paper as the working electrode, silver/silver chloride in saturated potassium chloride as the reference electrode and two titanium meshes as the counter electrodes, respectively. All the electrochemical methods were performed by a VSP Potentiostat that controlled the experiments and analysed the signals using a predetermined setting. The electrochemical impedance spectroscopy (EIS) and linear polarization resistance (LPR) were taken in tandem, once every hour during the 24 h period. The sinusoidal perturbation signals for EIS were set to 10 mV (peak-to-peak amplitude) with the frequency ranging from 105 to 0.01 Hz; the potential for LPR was set in the range of ±25 mVOCP with the scan rate of 0.5976 V/h. To confirm EIS and LPR measurements, the potentiodynamic polarization measurements were also implemented at the scan rate of 0.5976 V/h after 24 h OCP. An optimal concentration would then be determined for the HCl and H2SO4 electrolytes, then the same electrochemical measurements would be repeated for two more electrolyte/corrosion inhibitor conditions: half part HCl and half part H2SO4 (effectively 0.5 M HCl and 0.25 M H2SO4), one without corrosion inhibitor and the other with the optimal concentration of corrosion inhibitor. It was noticed that all investigated solutions were naturally aerated for all electrochemical measurements and surface analysis.
Surface analyses were performed on the steel specimens after the 24 h immersion. The scanning electron microscopy (SEM) was taken at 10 kV electron beam and 7.8 mm working distance. X-ray photoelectron spectroscopy (XPS, Kratos Nova) with an Al Kα energy source at 1486.6 eV after 24 h of the open-circuit potential. Scans were conducted using an anode voltage of 15 kV and a current of 10 mA. The pass energy was set to 160 eV for survey scans and 20 eV for high-resolution scans. The binding energy was calibrated by referencing the charge to the hydrocarbon C 1 s peak at 285.0 eV and ATR-FTIR was performed.
3. Results and discussion
Figure details the impedances (Nyquist plot) of the steel surface immersed in 1.0 M HCl during 24 h as well as their simulated curves which contain a constant phase element meant to emulate behaviour of the electric double layer that is frequently considered as a non-ideal capacitor. The presence of the corrosion inhibitor makes a significant difference. Without corrosion inhibitor addition, the semicircles are very small during the entire duration of the immersion. In fact, after 2 h, they start to become even smaller as shown in Figure (a). When the corrosion inhibitor is added in Figure (b–f), the impedances are boosted in general. Notably, there is a clear distinction between Figure (b, c) and Figure (d–f). Specifically, Figure (b, c) reveals more depressed semicircles that are due to the inhomogeneity introduced by the deposited organic film [Citation37]. In contrast, those in Figure (d–f) are bigger and less depressed which means the corrosion products and the organic film are better incorporated together, improving homogeneity and stability. Overall, the most prominent Nyquist semicircles belong to Figure (e) with 3000 ppm corrosion inhibitor. Figures S1 and 2 demonstrate the frequency dependence of the same results, plotting phase angles against frequency. In general, there is only one capacitive loop for each corrosion inhibitor condition, evident by the single peak in every plot. Easily distinguished from the rest, the peaks in Figure S2(a) represent the uninhibited steel surface and do not reach higher than 50°, resulting from the low value of Rp, in other words, low ratio of Rp/Rs. Furthermore, the high-frequency end of the plot arrives near zero phase angle, showing a resistive behaviour. The steel surface initially has corrosion inhibitor added at 500 ppm in Figure S2(b) and immediate improvements are indicated by higher and wider peaks that stay relatively steady throughout the immersion period, and there are also capacitive properties that remain at the high-frequency limit. Figure S2(c–f) feature even higher and wider peaks whose break point frequencies (the two frequencies at which the phase angle is 45°) approach each other, slightly reducing the peak in width over the immersion duration. These peaks in the medium-frequency range represent the capacitive behaviours of the organic layer deposited on the steel surface, also referred to as frequency dispersion effect [Citation38,Citation39].
Figure 1. Measured and fitted Nyquist plots for the EIS measurement of the steel surfaces immersed for 24 h in 1.0 M HCl without CI (a), and with CI at (b) 500 ppm, (c) 1000 ppm, (d) 2000 ppm and (e) 3000 ppm.

Figure shows the effect of switching from 1.0 M HCl corrosive environment to 0.5 M H2SO4, keeping the same corrosion inhibitor conditions as those of Figure . Without the corrosion inhibitor, the impedances are the lowest and the semicircles are also the least depressed in Figure (a). As the corrosion inhibitor concentration increases, these semicircles have only small increases in size and slowly become more open and less depressed, demonstrating minor but steady enhancements. All in all, Figure (f) has the most recognizable impedance which is stable for the longest period of 8 h, more than twice the time of lower concentrations. Figures S3 and 4 express the same results in Figure , but in Bode plots. Figure S3(a) belongs to an uninhibited steel surface and phase angles do not pass 30°. The peaks shift to lower frequency as the capacitive portion of the medium-frequency range diminishes and becomes more resistive over the 24-hour immersion period, indicating a rougher electrochemical surface. Interestingly, Figure S3(b–d) all have similarly small phase angles (less than 50°) whose peak shifts to lower frequency are even stronger than that of Figure S3(a), most likely the combined result of a rough and also inhomogeneous surface due to metal dissolution and organic film deposition, respectively. However, in Figure S3 (e and f), the phase angle peaks are much less obtuse and do not shift as much, suggesting improvements in the medium-frequency range. Moreover, in the low-frequency range, a large portion that dips below zero no longer appears, giving a more levelled plateau in Figure S3(e and f). This might be thanks to the absorbed corrosive species being replaced by protective ones instead. Nevertheless, the high-frequency range is mostly resistive in nature for all corrosion inhibitor conditions.
Figure 2. Measured and fitted Nyquist plots for the EIS measurement of the steel surfaces immersed for 24 h in 0.5 M H2SO4 without CI (a), and with CI at (b) 500 ppm, (c) 1000 ppm, (d) 2000 ppm and (e) 3000 ppm.

Figure is the result of mixing two different acids such that the pH stays the same, and consequently half of the chloride and sulphate ions are in the mixed solution compared to the single acid environment. Many of the patterns for each acid can also be seen here. Firstly, the impedance values fall in the middle, lower than those in 1.0 M HCl but higher than those in 0.5 M H2SO4. The same goes for semicircle depression, although those of 1.0 M HCl is the lower limit in this case. As for Figures S5 and 6, it is easier to see the suppressed patterns of each acid in these Bode plots. For instance, the negative phase angle hooks in the low-frequency range (as seen with acid H2SO4) are much less prominent in Figures S5(a) and S6(a) and are non-existent in Figures S5(a) and S6(b). The high capacitive quality in the high-frequency range (as seen with acid HCl) is downgraded, almost reaching a plateau of phase angles. Regardless, expected behaviours are still observed, such as quickly-shifting and small phase angles for uninhibited surface in the medium-frequency range (high roughness of the dissolved metal surface); steady and large phase angles for inhibited surface (high robustness of the protective film). Figure explains the fitting circuits for different conditions in terms of simple diagrams. Q is the constant phase element that accounts for surface charge and the resulting imperfect capacitor behaviours, L is the inductance that reflects the high-frequency impedance of absorbed species, Rs is the solution resistance that is inversely proportionate to ionic activity of the solution, Rp is the polarization resistance that is inversely proportionate to the corrosion rate of the specimens, and finally RL is the complementing real part of the impedance of absorbed species [Citation39].
Figure 3. Measured and fitted Nyquist plots for the EIS measurement of the steel surfaces immersed for 24 h in 0.5 M HCl and 0.25 M H2SO4 without CI (a), and with CI at (b) 3000 ppm.

Figure 4. Simulated circuit for fitting of EIS of steel immersed in (a) HCl and mixed acid and (b) H2SO4.

Figure (a–c) visualizes the fitted results already presented in Figures . Figure (a) shows that the growth of polarization resistance for the steel surface in 1.0 M HCl with different corrosion inhibitor concentrations is mostly defined during the first 3–5 h of immersion, after which either a plateau or a gentle decline follows. On the other hand, Figure (b) is dominated by the plateau from the 2nd to the 6th hour of the 3000 ppm corrosion inhibitor condition, whereas the polarization resistances of other corrosion inhibitor conditions are not comparable to that. Figure (c) is another sight altogether as the polarization resistance maintains a similar level throughout the immersion period (except for the first hour). Furthermore, Figure (d–f) presents polarization resistances measured by LPR instead of calculated from EIS as in Figure (a–c). The same corrosive acids and corrosion inhibitor conditions are used for this measurement. Firstly, for steel immersed in 1.0 M HCl, there is a drop in the corrosion potential as corrosion inhibitor concentration goes up, evident from Figure S7(a). On the other hand, Rp has a proportional relationship with corrosion inhibitor concentrations up to 3000 ppm after which it is inversely proportional instead. Furthermore, the rate of change of Rp also similarly scales with corrosion inhibitor concentrations, peaking at 3000 ppm. As a result, for corrosion inhibitor concentration 500 and 1000 ppm there is a gentle plateau pattern, while for 2000 and 3000 ppm there are well-defined peaks followed by stable negative gradients for all Rp values over the entire 24-hour duration. As for steel immersed in 0.5 M H2SO4, corrosion potential slightly shifts to more positive values and has no other correlations with corrosion inhibitor concentrations, as in Figure S7(b). Nevertheless, the relationship between Rp and corrosion inhibitor concentration is more drastic than that of Figure (d). All corrosion inhibitor concentrations result in a decrease in Rp over time (after the 1 h OCP), differing only in values of the stabilized Rp and the time when they are reached. At 3000 ppm, Rp values achieve a plateau from 17th hour onwards, the highest plateau and also arrived at latest. Finally, the mixed acid condition features a corrosion potential drop similar to that of Figure S7(a), Rp development pattern not unlike that of Figure (e) and Rp values near the average of those of Figure (a) and Figure (b), and is almost identical to Figure (c), proving its high repeatability.
Figure 5. Polarization resistances obtained by the EIS (a–c) and by the LPR (d–f) results of the steel surfaces during the 24-hour immersion period in (a, d) 1.0 M HCl, (b, e) 0.5 M H2SO4, (c, f) 0.5 M HCl and 0.25 M H2SO4. Respective corrosion inhibitor concentrations are shown in the legends.

Figure organizes potentiodynamic polarization results of steel surfaces immersed in different acids and varying corrosion inhibitor concentrations. For Figure (a), the steel surfaces can be considered passive up to 350 mVAg/AgCl, then current densities soar when more positive potentials are applied. More importantly, as corrosion inhibitor concentration increases, corrosion potential drops, widening the passive range in the anodic branch. Moreover, for corrosion inhibitor concentrations from 2000 to 3000 ppm, the passive current density also drops. Nevertheless, both anodic and cathodic tafel slopes stay relatively stable despite the change in corrosion inhibitor concentration (from 500 to 3000 ppm). Instead, only the corrosion current density drops are visible. On the other hand, Figure (b) offers a much more marked change in the cathodic tafel slopes that plummet as corrosion inhibitor increases. Anodic tafel slopes also decrease, though not as dramatically. Corrosion potentials rise slightly with the presence of corrosion inhibitor but do not relate concentration-wise. Finally, Figure (c) has the large corrosion potential and current density reduction resembling those of Figure (a) and the exact values of corrosion potential (with or without corrosion inhibitor) lie between those of Figure (a) and Figure (b). Similarly for corrosion inhibition efficiency in Figure (d), the mixed acid condition at 3000 ppm CI concention lies between those of the single acid conditions, although slightly higher than the average of those two. The exact values of corrosion potential and current are shown in Table , along with their respective tafel slopes. For the HCl condition, corrosion current declines faster even at much lower CI concentration and is overall much smaller compared with the H2SO4 condition, differing by two orders of magnitude at 3000 ppm concentration of CI. However, it is with the H2SO4 condition that there are more remarkable changes in the tafel slopes. Finally, for the mixed acid condition, corrosion current and potential (denoting reaction rate and surface charge [Citation40,Citation41]) take after the HCl condition while the cathodic tafel slope (reflecting hydrogen evolution, surface deposit) resemble those of the H2SO4 condition. Interestingly, the anodic tafel slope, expressing iron dissolution and protective layer formation, has its own pattern. This result suggests that synergistic suppression of both anodic and cathodic reactions [Citation42].
Figure 6. Potentiodynamic polarization results of the steel surfaces after the 24-hour immersion period in (a) 1.0 M HCl, (b) 0.5 M H2SO4, (c) 0.5 M HCl and 0.25 M H2SO4. Respective corrosion inhibitor concentrations are shown in the legends and (d) corrosion inhibition efficiency as a function of concentration among different acidic solutions.

Table 1. The corrosion parameters obtained from the potentiodynamic polarization in Figure (a–c) of steel in differently acidic solution.
Figure shows the magnified surface of steel specimens after the 24 h immersion in 1.0 M HCl in different corrosion inhibitor conditions. There are three crucial information to be inferred from these visuals: development of corrosion products, the accumulation of adsorbed species and the preservation of the steel substrate. At the initial condition of no added corrosion inhibitor, the steel surface degrades intensely in Figure (a), creating irregular lumps of iron oxide and hydroxide that apparently crack due to the increase in volume compared to that of iron. Some unidentified structures absorb on the surface which can be described as fuzzy balls. More importantly, the whole surface is heavily degraded after immersion. When 100 ppm corrosion inhibitor is introduced into the acid, improvements are vague in Figure (b). Flaky corrosion products still form although the original grinding marks are now visible to some degree. Furthermore, the adsorbed species have been replaced by smaller and more regular spheres. Improvements continue with 1000 and 3000 ppm in Figure (c and d) where grinding marks are visibly preserved, yet the former still sees localized corrosion and the latter still undergoes a general corrosion.
Figure 7. High magnification SEM results of steel surfaces after 24-hour immersion in 1.0 M HCl without CI (a), and with CI at (b) 100 ppm, (c) 1000 ppm and (d) 3000 ppm.

In contrast, Figure details the surface morphology of the steel specimens immersed in 0.5 M H2SO4 for 24 h with varying corrosion inhibitor concentrations. The distinction from Figure is most prominent with the first 3 concentrations of Figure (a–c). Preferential corrosion follows the lamellar microstructure, resulting in a porous surface which can be described as etching. Moreover, this process is also mildly isotropic at the microscopic scale but is actually general corrosion considering almost no rust deposits appear. Figure (d), on the other hand, shows patches of relatively intact grinding marks, which are regularly distributed across the entire surface, demonstrating the limited coverage of corrosion inhibition. In addition, pitting still exists.
Figure 8. High magnification SEM results of steel surfaces after 24-hour immersion in 0.5 M H2SO4 without CI (a), and with CI at (b) 100 ppm, (c) 1000 ppm and (d) 3000 ppm.

Finishing the comparison is Figure where both acids are mixed together, resulting in half the concentration of both sulphate and chloride ions as 0.25 M H2SO4 and 0.5 M HCl, to submerge the steel specimens for 24 h, without and with corrosion inhibitor at 3000 ppm. The preferential and isotropic corrosion process of H2SO4 persists, albeit at a smaller scale, partially suppressed by the presence of HCl. And vice versa, the corrosion product buildup of HCl is also suppressed. Evident from Figure (a), sharp corners and edges of the cubic crystal structure are exposed as the other orientations corrode faster; and vice versa, the surface is also more homogeneous as corrosion products in clumps are observed less. Nevertheless, these inferred suppressions only represent the corrosion pathway, not the corrosion rate. As for the 3000 ppm corrosion inhibitor condition in Figure (b), the steel surface would remain pristine if not for the existence of corrosion pits.
Figure 9. High magnification SEM results of steel surfaces after 24-hour immersion in 0.5 M HCl and 0.25 M H2SO4 without CI (a), and with CI at (b) 3000 ppm.

A qualitative overview of Figure concludes that the different acids (HCl and H2SO4) do not have any IR-sensitive effects on the composition of the deposited organic film on the steel surface after 24 h in such environments. In essence, Figures (a and b) are the same and only the peaks in Figure (a) will be used. Further inspection also confirms the mentioned deposition of the organic film as most of the peaks from the raw extract can be found on the steel surface, although the circumstance may change. Namely, the strong and broad peak of bonded alcohol stretching at 3391 cm−1 on the extract virtually disappears (possibly along with an overlapping amine stretching peak), replaced by (with almost the same absorbance) the narrow peak of free alcohol stretching at 3744 cm−1 on the substrate. There are also alkane and alkene stretching of 4 peaks at 2839, 2876, 2922 and 2951 cm−1 on the extract that diminish and redistribute into even more peaks in the region between 2855 and 3117 cm−1 on the substrate. Furthermore, there are alkene conjugation (extract at 1615 cm−1 and substrate at 1649 cm−1) and conjugated amine/carbonyl (extract at 1697 cm−1 and substrate at 1699 cm−1) stretching vibration. Wrapping up the functional group region, the signal of either alkyne or nitrile stretching, does not change much from extract to substrate (2311–2316 cm−1). The first bending vibration on the descending search for peaks belongs to either alkane or aldehyde at 1385 cm−1 on the extract. However, no equivalence for such vibrations is found on the substrate. Instead, there seems to be either nitro stretching or amine bending vibrations at 1522 and 1539 cm−1. More alcohol or phenol stretching vibrations are recorded at 1061 and 1078 cm−1 on the extract. Again, no equivalent vibrations are found on the substrate. Lastly, alkene bending vibrations are found on both the extract and the substrate at 721, 781, 824 and 575, 638 and 701 cm−1, respectively. In particular, the surface of steel exhibits similar bonds found in the raw extract except for the alcohol bonds that have become free instead of bound, suggesting that molecular hydrogen bonds have given way to superficial adsorption, or in other words deposited onto the steel surface.
Figure 10. FTIR results of the crude extract and steel surfaces after 24-hour immersion in (a) 1.0 M HCl and (b) 0.5 M H2SO4, both with 3000 ppm corrosion inhibitor.

Figure provides further information of the surface of steel immersed in either 1.0 M HCl or 0.5 M H2SO4 without and with corrosion inhibitor, specifically of chemical states in the form of X-ray photoelectron spectroscopy. Overall, not much is changed when a corrosion inhibitor is introduced except for the appearance of a new N 1s and already present but stronger Fe 2p signals for both acid conditions, and the disappearance of those of Cl 2p for the HCl condition. The N 1s signals are found between 398 and 401 eV, revealing an organic origin (C–N, C=N or C≡N) [Citation43]; while the strengthened Fe 2p signals, even only by a small margin, are likely due to the smoother and denser surface housing more iron atoms within the escape depth volume; and the removal of Cl 2p peaks at (198 and 199.5 eV) might be due to adsorption of the corrosion inhibitor onto the steel surface. As for the exact signals for the HCl condition in Figure (a), there are the obligatory Fe 2p and C 1s signals originating from the inherent composition of steel and the organic extract when corrosion inhibitor is involved. No noticeable shifts were observed for amplitude and position of Fe 2p binding energies, which are 710.5, 714, 715 eV and 724, 725 and 726.5 eV for Fe 2p3/2, Fe 2p1/2, respectively. These peaks, coupled with those of Fe satellites at 719 and 732 eV, evidence the existence of iron oxides on the surface of both uninhibited and inhibited steel surface [Citation44–46]. Similarly, the addition of the corrosion inhibitor has kept all C 1s and O 1s peaks virtually the same, which include these peaks at 284.5 eV (C–C), 286 eV (C–O, C–N, C=N or C≡N), 288.25 eV (C=O), 529.5 eV (lattice oxide), 531 eV (defect oxide, hydroxide, C=O), 532.5 eV (C–O or absorbed water and organic species) [Citation43,Citation47].
Figure 11. XPS results of steel surfaces after 24-hour immersion in (a) 1.0 M HCl and (b) 0.5 M H2SO4. Respective corrosion inhibitor concentrations are shown in the legends.


As for the detailed signals of the H2SO4 condition in Figure (b), Fe 2p3/2 signals and both Fe satellites are entirely comparable to those of the HCl condition, whereas there are clear positive shifts of 0.5 eV across all binding energies of Fe 2p1/2. All these, except for the satellites, are shifted +0.5 eV once more after corrosion on the steel surface is inhibited. These all-or-none shifts are true for C 1s and O 1s as well, where only the latter has +0.25 eV in binding energies compared with those of HCl condition, and +0.25 eV once more for inhibited steel surface. However, the 529.75 eV oxide signal is independent of corrosion inhibitor concentrations and is also much less prominent relative to the other O 1s peaks of hydroxide, adsorbed water, organic oxygen species and most importantly sulphate. In fact, two S 2p signals are present at around 168 and 162 eV which account for sulphate S6+ and metallic sulphide or disulphide, respectively [Citation48]. Most likely, disulphide [S2]2− exists in the form of pyrite FeS2 or FeS rust scale in case of sulphide S2−, which explains the shifts in Fe 2p1/2 as well as the fall of lattice oxide and rise of defect oxide from O 1s signals (sulphur defect).
To correlate all results so far, here is the proposed mechanism of steel corrosion and inhibition. Firstly, the rust formation is different for the two acid conditions which will be distinguished using their respective anions. Chloride ions are a catalyst to oxide formation due to strong localized attacks that accumulate corrosion products at the site of attack, creating sporadic rust deposits of low specific density. Sulphate ions, on the other hand, suppress oxide formation and attack steel surface more evenly, a more general corrosion where they strongly hydrate and poison hydrogen evolution [Citation10] according to tafel results in Table . When corrosion inhibitor is added into the system, it is protonated (as expected of these COOH, C-OH, C-NH2 and C=NH groups found by ATR-FTIR, LCMS-MS) and adsorbed onto the steel surface, a process with which chloride ions do not react but instead act as catalyst thanks to its negative charge and electrostatic attraction, mediating between the positively charged steel surface and protonated CI. Thus, the nature of the oxide rust itself is not changed, only with more surface charge (as shown by more negative corrosion potential) due to CI adsorption [Citation38], and more uniform and stable (as evidenced by EIS, SEM and XPS) due to not being accelerated. It can also be said that the rate-determining step [Citation49] of the rust forming has been changed. Another explanation for the more negative corrosion potential in PD was that the anodic reactions were providing much more electrons than the rate of cathodic reactions, which the CI acted upon and slowed down, could consume, resulting in more surface charging and stronger pseudo-capacitor. In contrast, the H2SO4 condition did not feature a negative shift in corrosion potential, meaning the increased pseudo-capacitance was due to adsorbed CI species alone. In fact, sulphate ions do not help with the adsorption of corrosion inhibitor, they react with iron to form pyrite, react with corrosion products or simply absorbed onto the steel surface; they do, however, balance the excess charges of the CI. So instead of the synergistic working as that of chloride ions, there is a competition for adsorption sites between sulphate and the protonated corrosion inhibitor. This explains why the corrosion inhibitor can only be useful in H2SO4 in high concentrations, acting as a physical barrier that repels protons and thus retards hydrogen evolution. Support for this idea comes with the mixed acid condition where rust deposits are suppressed by sulphate ions and delivery of corrosion inhibitor to the steel surface is aided by chloride ions [Citation40,Citation50]. Nevertheless, rust formation and suppression contrast one another and there are only half of either ions when compared with the single acid conditions, resulting in corrosion rates somewhere between either of those conditions, as confirmed by electrochemical results.
Figure proposes an illustration for the corrosion mechanism for protonated CI in general. For the HCl and mixed acid conditions, they underwent a marked reduction in cathodic area, as pointed out in Figure (a), due to the electrostatic interaction between chloride and protonated CI: when CI adsorbed on cathodic site it attracted chloride ions which in turn attracted more CI and so on [Citation51,Citation52]. As for anodic sites, chloride absorbed first then came CI and so on. This way anodic area did not change, only with less localized rust formation as the negative charges are spread out more, even if the surface was more negatively charged due to the fact that the cathodic area was greatly diminished. However, the mismatch in anodic and cathodic reaction rates only accounted for reaction kinetics and so metal dissolution could not be entirely prevented. Eventually, when enough metal dissolved and escaped through the porous organic film, the film itself prevent self-healing because it had formed on both anodic and cathodic sites almost indiscriminately, leaving little space for CI diffusion from the bulk solution. In a sense, its strength in rapid protective film formation was its downfall. In fact, the higher CI concentration, the more initiation sites and the more overlapping boundaries there were speeding up the escape of dissolved metal and protective film failure. It could also be that protonated CI decomposed into neutral CI and released H2, losing its adhesion in the process. Furthermore, the reason for curved anodic Tafel was due to the breakdown of the pseudo-capacitance at a certain applied voltage as visualized in Figure (c). As for the H2SO4 condition, as in Figure (b), it experienced reduced electron activity. This effect was not so dominant as that of the HCl condition and so the lowered corrosion inhibition efficiency of mixed acid condition was likely due to chloride ions being more dilute. Furthermore, the comparison of present results with the results of other similar investigations in literature was comparatively given in Table .
Figure 12. Illustration for adsorption and corrosion inhibition of UBPE of steel in acidic environment (a) with a high concentration of chloride ions regardless of other present counterions, if any, and (b) with another counterion of hydronium such as sulphate instead of chloride. And (c) illustration of pseudo-capcitance breakdown of protective film (3000 ppm CI in HCl 1 M in this case).

Table 2. Comparison of some recent investigations (SS: stainless steel, BS: bright Steel, MS: mild steel, CS: Carbon steel NA: not achieve).
4. Conclusions
To sum up, UBPE has been successfully utilized as a corrosion inhibitor for carbon steel in various acidic environments, opening up waste matter recycling to new possibilities. Of all the investigated concentrations and acid conditions, 3000 ppm yield the best corrosion inhibition efficiency at 95.91%. For the HCl condition, it is due to having a compatible concentration of chloride ions, which is 1.0 M for this study and which acts as a catalyst for CI adsorption on the steel surface. For H2SO4, the active species in the CI must have a comparable concentration to that of sulphate ions, and at 3000 ppm CI concentration, 83.33% corrosion inhibition can be achieved. In addition, it is found that the corrosion inhibition efficiency of the mixed acid condition is higher than the average of the two single acid conditions, standing at 91.50% and ensuring the repeatability and validity of the proposed mechanism of rust formation and suppression, and corrosion inhibitor delivery. Finally, while the HCl condition surpassed 80% corrosion efficiency starting at 500 ppm, the H2SO4 condition required at least 3000 ppm to achieve a similar result. Therefore, this work encourages the use of UBPE as a corrosion inhibitor for steel in acidic media containing chloride ions (regardless of sulphate ions) such as in pickling process, while those containing only sulphate ions may have to consider using high concentrations of up to 3000 ppm.
Supporting information
Bode plots (impedance and phase angle vs frequency) for the EIS measurement, simulated circuit for fitting of EIS data, measured LPR results, low magnification SEM results, and liquid chromatography-mass spectrometry (LCMS-MS) result.
Supplemental Material
Download MS Word (5.5 MB)Acknowledgements
We are thankful to Dr. Thao Quynh Ngan Tran and Dr. S.V. Prabhakar Vattikuti for their technical assistance in ATR-FTIR and XPS measurements.
Disclosure statement
No potential conflict of interest was reported by the author(s).
References
- Mohapatra D, Mishra S, Sutar N. Banana and its by-product utilisation: an overview. J Sci Ind Res. 2010;69:323–329. http://nopr.niscpr.res.in/handle/123456789/8581
- Vu HT, Scarlett CJ, Vuong QV. Phenolic compounds within banana peel and their potential uses: a review. J Funct Foods. 2018;40:238–248. doi:10.1016/j.jff.2017.11.006
- Bankara A, Joshia B, Kumar RA, et al. Banana peel extract mediated novel route for the synthesis of silver nanoparticles. Colloids Surf A. 2010;368:58–63. doi:10.1016/j.colsurfa.2010.07.024
- Deyou Y, Lili W, Minghua W. Simultaneous removal of dye and heavy metal by banana peels derived hierarchically porous carbons. J Taiwan Inst Chem Eng. 2018;93:543–553. doi:10.1016/j.jtice.2018.08.038
- Sivakumar A, Murugesan B, Loganathan A, et al. Synthesis of ZnO nanowire and ZnO/CeO2 solid solution nanowire by bio-morphing and its characterization. J Taiwan Inst Chem Eng. 2017;78:462–470. doi:10.1016/j.jtice.2017.05.030
- Akpomie KG, Conradie J. Banana peel as a biosorbent for the decontamination of water pollutants. A review. Environ Chem Lett. 2020;18:1085–1112. doi:10.1007/s10311-020-00995-x
- Ji G, Anjum S, Sundaram S, et al. Musa paradisica peel extract as green corrosion inhibitor for mild steel in HCl solution. Corros Sci. 2015;90:107–117. doi:10.1016/j.corsci.2014.10.002
- Verma C, Haque J, Quraishi MA, et al. Aqueous phase environmental friendly organic corrosion inhibitors derived from one step multicomponent reactions: a review. J Mol Liq. 2019;275:18–40. doi:10.1016/j.molliq.2018.11.040
- Salleh SZ, Yusoff AH, Zakaria SK, et al. Plant extracts as green corrosion inhibitor for ferrous metal alloys: a review. J Cleaner Prod. 2021;304:127030. doi:10.1016/j.jclepro.2021.127030
- Jones DA. Principles and prevention of corrosion. Upper Saddle River (NJ): Prentice-Hall; 1996.
- Xu C, Tan B, Zhang S, et al. Corrosion inhibition of copper in sulfuric acid by Leonurus japonicus Houtt. extract as a green corrosion inhibitor: combination of experimental and theoretical research. J Taiwan Inst Chem Eng. 2022;139:104532. doi:10.1016/j.jtice.2022.104532
- Manh TD, Huynh TL, Thi BV, et al. Corrosion inhibition of mild steel in hydrochloric acid environments containing Sonneratia caseolaris leaf extract. ACS Omega. 2022;7:8874–8886. doi:10.1021/acsomega.1c07237
- Chen J, Wu Y, Guo L, et al. Insight into the anti-corrosion mechanism of Pisum sativum L leaves extract as the degradable inhibitor for Q235 steel in sulfuric acid medium. J Taiwan Inst Chem Eng. 2023;143:104664. doi:10.1016/j.jtice.2022.104664
- Jadaa RJ, Abd AN, Khadom AA. Polyacrylamide as a corrosion inhibitor for mild steel in 2 M phosphoric acid: experimental and theoretical studies. Chem Pap. 2021;75:5375–5386. doi:10.1007/s11696-021-01725-5
- Zhu MD, Xing N, Ai LS, et al. Development of polyacid corrosion inhibitor with 2-vinylpyridine residue. Chem Pap. 2021;75:6127–6135. doi:10.1007/s11696-021-01728-2
- Vuong BX, Huynh TL, Tran TQN, et al. Corrosion inhibition of carbon steel in hydrochloric acid solution by self-formation of a Malpighia glabra leaf extract-based organic film. Mater Today Commun. 2022;31:103641. doi:10.1016/j.mtcomm.2022.103641
- Hynes NRJ, Selvaraj RM, Mohamed T, et al. Aerva lanata flowers extract as green corrosion inhibitor of low-carbon steel in HCl solution: an in vitro study. Chem Pap. 2021;75:1165–1174. doi:10.1007/s11696-020-01361-5
- Trung DC, Pham TT, Phan Minh QB, et al. The use of piper betle leaf extract for forming a barrier layer on steel surface in hydrochloric acid solution. Prog Org Coat. 2021;158:106340. doi:10.1016/j.porgcoat.2021.106340
- Kaur J, Saxena A, Berdimurodov E, et al. Euphorbia prostrata as an eco-friendly corrosion inhibitor for steel: electrochemical and DFT studies. Chem Pap. 2022. doi:10.1007/s11696-022-02533-1
- Kaya F, Solmaz R, Gecibesler IH. Investigation of adsorption, corrosion inhibition, synergistic inhibition effect and stability studies of Rheum ribes leaf extract on mild steel in 1 M HCl solution. J Taiwan Inst Chem Eng. 2023;143:104712. doi:10.1016/j.jtice.2023.104712
- Leal da Silva MV, de Britto Policarpi E, Spinelli A. Syzygium cumini leaf extract as an eco-friendly corrosion inhibitor for carbon steel in acidic medium. J Taiwan Inst Chem Eng. 2021;129(December):342–349. doi:10.1016/j.jtice.2021.09.026
- Khatib LW E, Rahal HT, Abdel-Gaber AM. Synergistic effect between Fragaria ananassa and Cucurbita pepo L leaf extracts on mild steel corrosion in hydrochloric acid solutions. Prot Met Phys Chem. 2020;56(5):1096–1106.
- Fatma K, Ramazan S, İbrahim HG. The use of methanol extract of Rheum Ribes (Işgın) flower as a natural and promising corrosion inhibitor for mild steel protection in 1 M HCl solution. J Ind Eng Chem. 2023;122:102–117. doi:10.1016/j.jiec.2023.02.013
- Jiyaul H, Chandrabhan V, Vandana S, et al. Corrosion inhibition of mild steel in 1M HCl using environmentally benign Thevetia peruviana flower extracts. Sustainable Chem Pharm. 2021;19:100354. doi:10.1016/j.scp.2020.100354
- Kilo M, Rahal HT, El-Dakdouki MH, et al. Study of the corrosion and inhibition mechanism for carbon steel and zinc alloys by an eco-friendly inhibitor in acidic solution. Chem Eng Commun. 2021;208(12):1676–1685. doi:10.1080/00986445.2020.1811239
- Yangyang F, Jiahong H, Youli Z, et al. Insight into the anti-corrosion mechanism Veratrum root extract as a green corrosion inhibitor. J Mol Liq. 2021;334(15):116110. doi:10.1016/j.molliq.2021.116110
- Zongyi Z, Xuehong M, Shan W, et al. A novel green corrosion inhibitor extracted from waste feverfew root for carbon steel in H2SO4 solution. Results Eng. 2023;17:100971. doi:10.1016/j.rineng.2023.100971
- Chaubey N, Singh VK, Quraishi MA. Effect of some peel extracts on the corrosion behavior of aluminum alloy in alkaline medium. Int J Ind Chem. 2015;6:317–328. doi:10.1007/10.1007/s40090-015-0054-8
- Liao LL, Mo S, Luo HQ, et al. Longan seed and peel as environmentally friendly corrosion inhibitor for mild steel in acid solution: experimental and theoretical studies. J Colloid Interface Sci. 2017;499:110–119. doi:10.1016/j.jcis.2017.03.091
- Frankel GS. Fundamentals of corrosion kinetics. In: Hughes A, Mol J, Zheludkevich M, Buchheit R, editor. Active protective coatings. Dordrecht: Springer; 2016. p. 17–32. doi:10.1007/978-94-017-7540-3_2
- Hikal WM, Said-Al Ahl HAH, Bratovcic A, et al. Banana peels: A waste treasure for human being. Evidence-Based Complementary Altern Med. 2022;2022:761645. doi:10.1155/2022/7616452
- Umoren SA, Solomon MM, Obot IB, et al. A critical review on the recent studies on plant biomaterials as corrosion inhibitors for industrial metals. J Ind Eng Chem. 2019;76:91–115. doi:10.1016/j.jiec.2019.03.057
- Feng Y, Xiangyu L, Zhendong D, et al. Corrosion inhibition of polydopamine nanoparticles on mild steel in hydrochloric acid solution. Int J Electrochem Sci. 2017;12:7469–7480. doi:10.20964/2017.08.52
- Kabiru H, Luai MA, Tawfik AS. Graphene oxide grafted with dopamine as an efficient corrosion inhibitor for oil well acidizing environments. Surf Interfaces. 2021;24:101046. doi:10.1016/j.surfin.2021.101046
- Vasso A, Juliana A, Kathy T, et al. Let’s go bananas! Green bananas and their health benefits. Prilozi. 2017;38:147–151. doi:10.1515/prilozi-2017-0033
- Lotfollahi Z, Mello APQ, Costa ES, et al. Green-banana biomass consumption by diabetic patients improves plasma low-density lipoprotein particle functionality. Sci Rep. 2020;10:12269. doi:10.1038/s41598-020-69288-1
- Isakhani-Zakaria M, Allahkaram SR, Ramezani-Varzaneh HA. Evaluation of corrosion behaviour of Pb-Co3O4 electrodeposited coating using EIS method. Corros Sci. 2019;157:472–480. doi:10.1016/j.corsci.2019.06.023
- Sedik A, Lerari D, Salci A, et al. Dardagan fruit extract as eco-friendly corrosion inhibitor for mild steel in 1 M HCl: electrochemical and surface morphological studies. J Taiwan Inst Chem Eng. 2020;107:189–200. doi:10.1016/j.jtice.2019.12.006
- Orazem ME. Electrochemical impedance spectroscopy. Pennington (NJ): Wiley; 2017.
- Soltani N, Tavakkoli N, Attaran A, et al. Inhibitory effect of Pistacia khinjuk aerial part extract for carbon steel corrosion in sulfuric acid and hydrochloric acid solutions. Chem Pap. 2020;74:1799–1815. doi:10.1007/s11696-019-01026-y
- Tasić ŽZ, Petrović Mihajlović MB, Radovanović MB, et al. New trends in corrosion protection of copper. Chem Pap. 2019;73:2103–2132. doi:10.1007/s11696-019-00774-1
- Kuruvilla M, Anupama RP, Sam J, et al. Enhanced inhibition of the corrosion of metallic copper exposed in sulphuric acid through the synergistic interaction of cysteine and alanine: electrochemical and computational studies. J Bio- Tribo-Corros. 2017;3:5. doi:10.1007/s40735-016-0064-x
- Graf N, Yegen E, Gross T, et al. XPS and NEXAFS studies of aliphatic and aromatic amine species on functionalized surfaces. Surf Sci. 2009;603(18):2849–2860. doi:10.1016/j.susc.2009.07.029
- Hoai NT, Hien PV, Vu NSH, et al. An improved corrosion resistance of steel in hydrochloric acid using hibiscus sabdariffa leaf extract. Chem Pap. 2019;73:909–925. doi:10.1007/s11696-018-0649-6
- Moulder JF, Stickle WF, Sobol PE, et al. Handbook of X-ray photoelectron spectroscopy. Eden Prairie (MO): Perkin-Elmer Corporation; 1992.
- Bach LX, Dao TBN, Pham TT, et al. Role of SnO2 nanoparticles for a self-forming barrier layer on a mild steel surface in hydrochloric acid medium containing piper beetle leaf extract. ACS Omega. 2022;7:38061–38068. doi:10.1021/acsomega.2c05545
- Ramalingam V, Harshavardhan M, Hwang I. Titanium decorated iron oxide (Ti@Fe2O3) regulates the proliferation of bovine muscle satellite cells through oxidative stress. Bioorg Chem. 2020;105:104459. doi:10.1016/j.bioorg.2020.104459
- Khoshkhoo M, Dopson M, Shchukarev A, et al. Chalcopyrite leaching and bioleaching: An X-ray photoelectron spectroscopic (XPS) investigation on the nature of hindered dissolution. Hydrometallurgy. 2014;149:220–227. doi:10.1016/j.hydromet.2014.08.012
- Noor EA, Al-Moubaraki AH. Corrosion behavior of mild steel in hydrochloric acid solutions. Int J Electrochem Sci. 2008;3:806–818. doi:10.1016/S1452-3981(23)15485-X
- Khattabi M, Benhiba F, Tabti S, et al. Performance and computational studies of two soluble pyran derivatives as corrosion inhibitors for mild steel in HCl. J Mol Struct. 2019;1196:231–244. doi:10.1016/j.molstruc.2019.06.070
- Dao TBN, Lai XB, Duong Ngo KL, et al. Inhibition properties of Vang tea-water extract for carbon steel corrosion in acidic environments. J Taiwan Inst Chem Eng. 2023;149:104941. doi:10.1016/j.jtice.2023.104941
- Nam ND, Mathesh M, Hinton B, et al. Rare earth 4-hydroxycinnamate compounds as carbon dioxide corrosion inhibitors for steel in sodium chloride solution. J Electrochem Soc. 2014;161:C527–C534. doi:10.1149/2.0231412jes
- Ayoola AA, Babalola R, Durodola BM, et al. Corrosion inhibition of A36 mild steel in 0.5 M acid medium using waste citrus limonum peels. Results Eng. 2022;15:100490. doi:10.1016/j.rineng.2022.100490
- Ayodeji A, Bamidele D, Sunday F, et al. Corrosion inhibitive performance of the waste orange peels (citrus sinensis) on A36 mild steel in 1 M HCl. Int J Electrochem Sci. 2022;17:22011. doi:10.20964/2022.01.36
- Amodu OS, Odunlami MO, Akintola JT, et al. Artificial neural network and response surface methodology for optimization of corrosion inhibition of mild steel in 1 M HCl by Musa paradisiaca peel extract. Heliyon. 2022;8:e11955. doi:10.1016/j.heliyon.2022.e11955
- Pal S, Lgaz H, Tiwari P, et al. Experimental and theoretical investigation of aqueous and methanolic extracts of Prunus dulcis peels as green corrosion inhibitors of mild steel in aggressive chloride media. J Mol Liq. 2019;276:347–361. doi:10.1016/j.molliq.2018.11.099
- Singh MR, Gupta P, Gupta K. The litchi (Litchi Chinensis) peels extract as a potential green inhibitor in prevention of corrosion of mild steel in 0.5 M H2SO4 solution. Arabian J Chem. 2019;12:1035–1041. doi:10.1016/j.arabjc.2015.01.002
- Zhang M, Guo L, Zhu M, et al. Akebia trifoliate koiaz peels extract as environmentally benign corrosion inhibitor for mild steel in HCl solutions: integrated experimental and theoretical investigations. J Ind Eng Chem. 2021;101:227–236. doi:10.1016/j.jiec.2021.06.009
- Bhardwaj N, Sharma P, Guo L, et al. Molecular dynamic simulation, quantum chemical calculation and electrochemical behaviour of Punica granatum peel extract as ecofriendly corrosion inhibitor for stainless steel (SS-410) in acidic medium. J Mol Liq. 2022;346:118237. doi:10.1016/j.molliq.2021.118237
- Bhardwaj N, Sharma P, Guo L, et al. Molecular dynamic simulation and quantum chemical calculation of phytochemicals present in Beta vulgaris and electrochemical behaviour of Beta vulgaris peel extract as green corrosion inhibitor for stainless steel (SS-410) in acidic medium. Colloids Surf A. 2022;632:127707. doi:10.1016/j.colsurfa.2021.127707
- Rosli NR, Yusuf SM, Sauki A, et al. Musa spientum (Banana) peels as green corrosion inhibitor for mild steel. Key Eng Mater. 2019;797:230–239. doi:10.4028/www.scientific.net/KEM.797.230
- Vani R, Arpan B, Aishwarya Jain Y. Inhibition effects of banana and orange peel extract on the corrosion of bright steel in acidic media. IOP Conf. Series: Materials Science and Engineering. 2021;1065:012029. doi:10.1088/1757-899X/1065/1/012029