
ABSTRACT
An effective low-cost nano NiO-In2O3 electrode material for oxygen evolution (OER) is presented. Electrochemical studies uncovered electrocatalytic recital in Ascorbic Acid, Hydrogen Peroxide (H2O2), and ethanol. The cubic crystal structure of NiO-In2O3 was revealed by XRD. FT-IR, FE-SEM and HR-TEM studies exploit the structure and morphology of NiO-In2O3. Electrochemistry of NiO-In2O3 uncovered high current density (900mA/cm2) at substantially low overpotential (230mV), realizing its OER recital. On top, high mass activity and turnover frequency by NiO-In2O3 comprehend improved electrical and semiconductive properties in H2O2. The NiO-In2O3 durability beyond 90 hours was estimated by chronopotentiometry (CP). The Impedance analysis (EIS) revealed low charge transfer resistance and high exchange current density. Given electrocatalytic studies, we found a direct relationship between NiO-In2O3 nanocomposite and the degradation of H2O2 compared to its counterparts. Hence, this strategy can be an alternative and potential source of hydrogen and oxygen production at commercial scale.
Highlights
A facile and effectual low-cost NiO-In2O3 electrocatalyst is developed for efficient OER in aqueous hydrogen peroxide.
NiO-In2O3 nanocomposite showed high current density (900mA/cm2) at low overpotential grasping its oxygen evolution reaction (OER) concert.
NiO-In2O3 Impedance analysis revealed its low charge transfer resistance, high exchange current density (Jexc.), high mass Activity, and high turnover frequency (TOF) in hydrogen peroxide, advocating enhanced electrical and semiconductive properties.
NiO-In2O3 showed long-term durability (>90 h) at varying current densities, fostering its application as a potential electrocatalyst for OER/HER reactions.
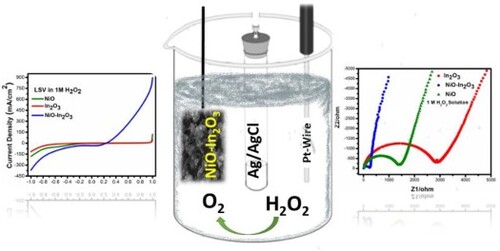
GRAPHICAL ABSTRACT
1. Introduction
With the decrease of remnant fuels and various environmental issues, there is an urgent need for sustainable energy resources. Among them, hydrogen and oxygen production by various aqueous mediums along with water is a known strategy [Citation1–5] by the electrolytic approach [Citation6]. Moreover, researchers have produced pure Hydrogen and Oxygen following the Oxygen and Hydrogen evolution reaction (OER and HER) [Citation7] from various mediums. Nevertheless, the corresponding oxidation evolution reaction (OER) with HER is a multistep proton-coupled electron transfer process that can be enhanced by tuning overpotential [Citation8]. Furthermore, it is known that the slow kinetic behaviour of OER affects hydrogen production [Citation9]. Therefore, several efforts in recent decades have been made to enhance this step for electrocatalytic hydrogen generation. Otherwise, there is a significant energy loss and a decreases in the overall efficiency of the electrocatalytic process [Citation10].
Numerous metal catalysts and their nanocomposites have benefited from boosting OER efficiency. Among them, noble metal-based catalysts are considered competent electrocatalytic materials [Citation10–14] because of their low overpotential, good stability, and effective overall water or other aqueous solution degradation. Such noble metals as catalysts or co-catalysts will support and enhance the overall electrocatalytic performance of OER and hydrogen generation. Their viability on a commercial scale is low due to high cost and limited supply. Therefore, it's always a challenge for scientists to develop a cost-effective and durable electrocatalyst for OER and HER reactions [Citation15–17]. A few transition metal electrocatalysts are known for their eco-friendly and reliable electrocatalytic nature. Cobalt [Citation18, Citation19], Cadmium [Citation20], MnO2@mpg-C3N4 [Citation14, Citation21], MnO2 [Citation21–23] and Nickel [Citation24, Citation25] chalcogenides are among the notable candidates of OER in electrocatalytic processes [Citation26]. Nickel and indium oxide materials are important in achieving better electrocatalytic OER in various -solutions and electrolytes [Citation24, Citation25, Citation27, Citation28]. In electrocatalysis, nickel-based nanocomposites are known for their low cost, high electrical conductivity, and three-dimensional microporous structures [Citation27, Citation28].
The synthesis of nanomaterials in the fabrication of electrocatalytic devices is of utmost importance. A straightforward approach is more advantageous than a prolonged and multistep strategy. Numerous methodologies, including hydrothermal [Citation29], solvothermal [Citation4], physiochemical [Citation30], lithographic [Citation31], chemical vapour deposition (CVD) [Citation32], and the aerosol assisted chemical vapour deposition (AACVD) [Citation33], are known. Each has merits and flaws, but the hydrothermal method has several advantages. The hydrothermal method of synthesis is a facile and straightforward method that avoids using sophisticated equipment for nanomaterial fabrication. Above all, the nanomaterial highly crystalline morphology can be achieved by varying the quantities of precursors, temperature, or solvent [Citation34, Citation35]. Herein, we are reporting a simple and fast hydrothermal method for the preparation of nickel oxide (NiO), Indium Oxide (In2O3), and NiO-In2O3 nanocomposites for electrocatalytic studies. The NiO, In2O3, and NiO-In2O3 nanocomposites were characterized by XRD, SEM, FT-IR, and UV-VIS techniques. These nanomaterials are also tested for electrocatalytic properties in aqueous solutions of hydrogen peroxide, ascorbic acid, and ethanol to explore a useful solvent for enhanced electrochemical oxidation or reduction process.
2. Experimental
2.1. Materials and chemicals
Nickel (II) nitrate hexahydrate [Ni(NO3)2.6H2O], Indium (III) nitrate [In(NO3)3], Hydrogen peroxide (H2O2), Ethanol (C2H5OH) and Ascorbic acid (C6H8O6) and urea were purchased from Sigma Aldrich. These precursors, chemicals, and solvents were purchased from Sigma Aldrich and used without further purification or pretreatment. Ethanol was used for the electrochemical process and washing of the products. Deionized water was used for synthesis and electrochemical procedures.
2.2. Synthesis of nickel (II) oxide [NiO]
In a typical experiment, 5.8160 g (20mmol) of Nickel (II) nitrate hexahydrate [Ni (NO3)2.6H2O] solution was prepared in 200 mL of DI water. The solution was transferred into a 100 mL Teflon-lined stainless-steel autoclave and heated at 200 °C for 24 h. The autoclave was automatically cooled to room temperature when the reaction was over. The white precipitates were collected by centrifugation (@ 6000 rpm for 10 min) and washed with DI water and ethanol six times. The NiO precipitates were dried in the air at 80 °C for 12 h. Finally, the NiO product was annealed in air at 400 °C for three hours (at heating rate of 5 °C/min) to obtain a light gray solid.
2.3. Synthesis of indium (III) oxide [In2O3]
In a typical experiment, 6.0166 g (20mmol) of Indium (III) nitrate [In (NO3)3] and 1.2012 g (20mmol) of urea were separately dissolved in two beakers in 50 mL of distilled water. The urea solution was stirred at 200 r/min magnetic stirring at room temperature for 15 min. Aqueous Indium Nitrate [In(NO3)3] was slowly added dropwise into the urea solution with continuous stirring. Once a homogenous mixture was obtained, it was transferred into a 100 mL Teflon-lined stainless-steel autoclave and heated at 200 °C for 24 h. Upon reaction completion, the autoclave was cooled to room temperature. The white precipitates were collected by centrifugation @ 6000 rpm for 10 min and washed with distilled water and ethanol several times before drying at 80 °C for 12 h in air.
2.4. Synthesis of Nickel (II) oxide-Indium (III) oxide [NiO-In2O3] nanocomposite
For nanocomposite preparation, 6.0166 g (20mmol) of Indium (III) nitrate [In (NO3)3] and 1.2012 g (20mmol) of urea were separately dissolved in two beakers in 100 mL of distilled water, respectively. The Urea solution was stirred at 200 r/min magnetic stirring at room temperature for 15 min. Indium nitrate solution was dropwise added to the above urea solution with continuous stirring for 15 more minutes.
In the next step, 5.8160 g (20mmol) of Nickel (II) nitrate hexahydrate [Ni (NO3)2.6H2O] was dissolved in 200 mL of distilled water. Afterward, an equal volume of both solutions was transferred into a 100 mL Teflon-lined stainless-steel autoclave and heated at 200 °C for 24 h. After the reaction was over, the autoclave was cooled to room temperature. The white precipitates were collected by centrifugation @ 6000 rpm for 10 min. The product was washed with distilled water and ethanol six times before drying at 80 °C for 12 h in air. The NiO-In2O3 nanocomposite was annealed at 400 °C for 5 h at a heating rate of 5 °C/min.
2.5. Fabrication of NiO, In2O3, and NiO–In2O3 electrodes
Indium tin oxide conducting glass (ITO) substrate of dimensions (1.5 × 3 cm2) was appropriately degassed and subsequently washed with water and ethanol under ultrasonication for 10 min and air-dried. Approximately 100 mg of each NiO, In2O3, and NiO-In2O3 was added separately to 2 ml of ethanol, and 2–3 drops of 5% Nafion solution were added to each mixture. The mixtures were stirred for 3 min to get homogenous suspensions. By drop casting technique, each material's very fine, thin film was deposited on the ITO substrate. Subsequently, the ITO anodes were dried in the air at 80 °C for 12 h to consolidate the coated material. A similar method was followed to prepare thin films of NiO and In2O3 and NiO-In2O3 nanomaterials over ITO glass substrates.
2.6. Characterization of NiO, In2O3, and NiO- In2O3 nanomaterials
X-ray diffraction (XRD) was employed to characterize the crystalline phases and purity of NiO, In2O3, and NiO-In2O3 composite. XRD analysis was carried out using the XRD-6100 by SHIMADZU, and the X-ray source was Cu Kα (wavelength of 1.5409 Å) operated at 80 mA/60 kV. The measurement was performed within the 2θ range of 10–80° with a step size of 5° min−1. The XRD pattern acquired was matched with the database of the ICDD-PDF-2 library, which confirmed the formation of NiO, In2O3, and NiO-In2O3. Further specification was regulated from the XRD library database. The Fourier transform spectroscopy (FTIR) technique was used to investigate the vibrational modes of the sample using a Shimadzu IR Affinity-1S spectrometer. The surface morphology of the synthesized nanomaterials was examined using a scanning electron microscope TESCAN Lyra 3 Field Emission Dual Beam (Electron/Focused Ion Beam) system combined with a high-end field-emission scanning electron microscope (FE-SEM). In addition, Energy dispersive X-ray spectroscopic (EDX) microanalysis was also conducted to evaluate the atomic ratio and their intensities in the composite. High-resolution transmission electron microscopy was also conducted to investigate the structure and morphology.
2.7. Electrochemical setup
All the electrochemical measurements were conducted using a three-electrode apparatus, IVIUM Technologies Potentiostat (Ivium-n-Stat Z.R.A.). In this three-electrode electrochemical apparatus, ITO-coated substrate electrodes acted as working electrodes, Pt wire electrode as the counter electrode, and Ag/AgCl electrode as the reference electrode. The electrochemical measurements were performed in a variety of electrolytes at different concentrations. Cyclic Voltammetry (CV), Linear Sweep Voltammetry (LSV), chronopotentiometry (CP), and Electrochemical impedance spectroscopy (EIS) were measured using this three-electrode electrochemical cell.
3. Results and discussion
3.1. X-Ray diffraction (XRD) studies
X-ray diffraction (XRD) analysis was carried out to investigate the crystalline features of NiO, In2O3, and NiO-In2O3 composition. Figure presents the XRD diffractogram of NiO, In2O3, and NiO-In2O3 composites.
Figure 1. XRD patterns of NiO, In2O3, and NiO-In2O3 composite displaying characteristic diffraction peaks.

The diffraction peaks indexed for NiO are observed at 2θ values of 39, 46, 64, 76, and 79, corresponding to hkl values (111), (200), (220), (311), and (222), respectively. The XRD peaks are labelled with corresponding hkl values after comparing the standard ICSD pattern of 19009 for NiO. The XRD diffraction of NiO showed a cubic Fm̄3m space group where Ni2+ is bounded to six equivalent O− atoms to form a mixture of corner and edge-sharing NiO6 octahedra. All Ni–O bond lengths are 2.09 Å. Consequently, O− is bound to six equivalent Ni2+ atoms to form a corner and edge-sharing ONi6 octahedra mixture [Citation36–38]. The 2θ peaks indexed for In2O3 are 22, 32, 39, 51, and 56, which correspond to hkl values (112), (222), (400), (440), and (622), respectively. All diffraction peaks are well aligned with ICSD pattern 22598, confirming In2O3 cubic structure with Iā3 space group. The cation In3+ contains two inequivalent sites. In one, the In3+ cations are attached to six equivalent O− atoms, thus developing a mixture of distorted corner and edge-sharing InO6 octahedral structure with corner-sharing octahedral tilt angles in the range of 54–55° and In-O bond lengths of 2.14–2.23 Å. In the other scenario, the cation In3+ is attached to six equivalent O− atoms, shaping a mixture of corner and edge-sharing InO6 octahedral structure with similar tilt angles (all at 54°) and In–O bond lengths (all 2.19 Å). However, anionic O− is bound to four In3+ cations, developing a blend of distorted corner and edge-sharing OIn4 trigonal pyramids [Citation36, Citation39, Citation40]. The 2θ peaks indexed for NiO-In2O3 nanocomposite are 22, 32,37, 39, 43, 46, 51, 56, 76 and 79, which corresponds to hkl values (112), (222), (111), (400), (200), (220), (440), (622), (311) and (222) respectively. The highest intensity peak is situated at a 2θ value of 22° corresponding to (112) hkl indices. It is evident from the diffraction peaks that the hkl miller indices of NiO (111,200,311 & 222) and hkl miller indices of In2O3 (112,222, 400,440 & 622) with significant peak height and intensity are present in NiO- In2O3 nanocomposite, hence revealing its cubic crystalline structure. We believe that during the hydrothermal reaction, the Ni (II)-O and In (III)-O species mixed interfacially, yielding a highly crystalline Ni-O-In2-O3 nanostructure that inhibits the fast electron–hole recombination and augmenting enhanced electrocatalytic performance as observed in electrochemical studies.
3.2. Fourier transform spectroscopy (FTIR) Analysis
Chemical bonding and functional groups were revealed by FTIR analysis. The FT-IR spectrum of NiO, In2O3 and NiO-In2O3 nanomaterials were measured in powdered sample using KBr pellet technique. The FT-IR measurement were carried out in the wavelength range of 4000–400 cm−1, the spectras obtained are presented in Figure .
Figure 2. FTIR spectra of NiO, In2O3, and NiO-In2O3 nanomaterials showing characteristics of IR vibrational bands.

In the FT-IR spectra of Ni-O nanoparticles, strong bands around 600–610 and 1392 cm−1 are assigned to the Ni–O stretching and bending modes; however, the vibration band observed at 1625–30 cm−1 is due to the OH bending vibration of water, these peaks are also observed in NiO-In2O3 nanocomposite. All the NiO FT-IR peaks observed in the sample are consistent with the literature and validate the presence of NiO nanoparticles in NiO-In2O3 [Citation41–43] nanocomposite. The FT-IR Spectra of NiO- In2O3 also show the peaks for In2O3.
The complete profile of FT-IR peaks recorded in NiO-In2O3 showed vibrational bands at wavenumber 3250-3450, 2250, 2110, 1813, 1624, 1500, 1392, 1145, 1050, 848, 775, 600 and 428 cm−1 respectively. The large absorption band at around 3250–3450 cm−1 shows OH stretching, whereas the peak at 2250 cm−1 has been attributed to the absorption of CO2 [Citation44]. This large absorption band at 3250–3450 cm−1 shows OH stretching in the sample due to moisture from air [Citation45]. However, additional vibrational bands at 1392, 1500, 1624, and 1810 cm−1 were assigned to the nitrate group and water bending deformation, respectively [Citation46].
The presence of 428 and 600 cm−1 peaks corresponds to the In-O phononic vibrations, characteristic peaks of cubic In2O3 [Citation47, Citation48]. The absorption bands observed at 1500 and 1183 cm−1 show bending deformation of water [Citation46]. A minor vibration shift in NiO and In-O relative intensities, observed in the NiO- In2O3 nanocomposite, is due to In and Ni distribution in the nanocomposite's interstitial sites. The literature revealed that such a scenario evolves due to cationic sensitivity to oxygen vacancies and other defects during fabrication [Citation49]. Therefore, the FTIR spectra of NiO-In2O3 comprehend the characteristics of vibration peaks observed in NiO and In2O3, thus conforming NiO-In2O3 formation via a hydrothermal approach. These findings further uncovered cubic phase development in NiO-In2O3 without forming organic intermediates or other by-products during NiO-In2O3 nanocomposite synthesis.
3.3. Surface and morphology analysis
FE-SEM and HR-TEM investigated the surface morphology of NiO, In2O3 and NiO-In2O3 nanomaterials—the respective scanning electron micrographs are shown in Figure (a-c). Figure (a) shows that very fine NiO nanoparticles of various dimensions (50-200 nm) were formed by hydrothermal reaction followed by annealing. The small dimensions of NiO will provide a large surface area with more active sites and thus could help enhance NiO electrochemical properties in the nanomaterials. In addition, the low dimension will also play an imperative role in the interfacial growth of a nanocomposite material upon interaction with In2O3. Figure (b) presents the formation of In2O3 nanoplates with varying proportions, such as less than 100 nm and some bigger nanoplates of 500nm. The nanoplate-like morphology amplifies reactive sites for electron–hole generation during electrochemical reactions. Figure (c) shows SEM micrographs of NiO-In2O3 nanoparticle composite and their tiny chunks of varying sizes between 50- 300nm. It is observed from the micrograph that the nanocomposite chunks contain tiny NiO nanoparticles embedded in In2O3 nanoplates. Figure (d & e) depicts the EDX analysis of the NiO-In2O3 nanocomposite, and it can be seen that the atomic ratios and intensities significantly support Ni and In metal presence in the oxides composite. Yet again, the nanosized morphology of NiO and In2O3 assisted by hydrothermal impregnation of both precursors followed by annealing of the product at higher temperatures. It is observed that the nanoplate-like morphology of In2O3 has changed to nanosized chunks upon hydrothermal treatment at 200°C for 24 h with NiO impregnation, leading to formation NiO-In2O3 nanoparticle composite.
Figure 3. The FE-SEM Micrograph of (a) NiO nanoparticles, (b) In2O3 nanoplates and (c) NiO-In2O3 nanocomposite, (d & e) EDX analysis of NiO-In2O3 nanocomposite and corresponding SEM micrograph, representing good atomic ratios with significant intensities of Ni and In.

High-resolution transmission electron microscopy was performed to investigate the structure–property relationship of NiO-In2O3 nanocomposite. The low- and high-resolution TEM micrographs of NiO-In2O3 nanocomposite are presented in Figure (a–d), respectively. The NiO-In2O3 nanoparticles are homogenously dispersed during hydrothermal impregnation, as seen in Figure b. The orientation of nanoparticles in the different orientations of lattices in different grains is also observable. The globular-shaped particles vary from 5–20 nm. In addition, Figure c presents the lattice spacing (≤ 2 nm), which follows the lattice constant of indium oxide and nickel oxide [Citation50]. Figure (d) illustrates a speckled ring pattern of NiO, In2O3, the high-resolution selected area diffraction pattern (SAED) of the NiO-In2O3 nanocomposite. Hence, it confirms the polycrystalline nature of the hydrothermally synthesized NiO-In2O3 nanocomposite, which aligns well with the XRD findings.
Figure 4. (a & b) Low and high-resolution TEM micrographs of NiO-In2O3 nanocomposites (c) Fringe spacing of polycrystalline NiO-In2O3 nanocomposites (d) SAED pattern of NiO-In2O3 nanocomposites.

3.4. Electrochemical studies
A three-electrode system was employed for all electrochemical measurements with an Ag/AgCl reference electrode, a Platinum counter electrode, and a working electrode with nanomaterial coating. 1 M Ascorbic acid, 1 M Ethanol, 0.1 M H2O2, 0.25 M H2O2, 0.5 M H2O2, 0.75 M H2O2, and 1 M H2O2 solutions were used as solvents. The results obtained from each electrochemical technique conducted are discussed below:
3.4.1. Cyclic voltammetry (CV)
Cyclic Voltammetry (CV) is the most active technique in electrochemistry to analyze the various semiconducting properties. In atypical measurement via an electrochemical cell, voltage is applied, and the corresponding current is measured. CV is used to appraise an electrocatalyst for its stability and reaction kinectics31,32. In electrocatalytic reactions, i.e. oxygen evolution reaction (OER) and hydrogen evolution reaction (HER), or to analyze oxidation–reduction, CV analysis is a decisive study. Herein, we performed the cyclic voltammetry to evaluate the electro-catalytical properties of NiO, In2O3, and NiO-In2O3 nanomaterials in a variety of electrolytic solutions (1 M Ascorbic acid, 1 M Ethanol, and 1 M H2O2) and the results are presented in Figure (a-d)
Figure 5. (a) CV scan for NiO, In2O3, and NiO-In2O3 in 1 M H2O2 (b) CV scan for NiO, In2O3 and NiO-In2O3 in 1 M ascorbic acid (c) CV scan for NiO, In2O3, and NiO-In2O3 in 1 M Ethanol (d) CV scan for NiO-In2O3 in 1 M M H2O2, ethanol and ascorbic acid. All CV scans showed enhanced electrocatalytic performance and OER via NiO-In2O3.

Figure (a) displays the CV curves obtained for NiO, In2O3, and NiO-In2O3 nanomaterials in 1 M H2O2 solution at a scan rate of 100mV and at an applied potential of 0.4 to −0.6 V. All materials showed good redox properties, but NiO-In2O3 performed superior and significantly higher current densities (400 mA/cm2) were observed. NiO and In2O3 electrochemical behaviour are much lower, and current densities in the microampere range are recorded. Such a good response of NiO-In2O3 is credited to the nanoscale dimensions of the nanocomposite material, which contains more reactive sites for electron–hole generation and helps avoid electron whole recombination; therefore, enhanced electrocatalytic performance is recorded. Figure (a) shows the anodic and cathodic currents at distinctive levels in 1M H2O2. However, the oxygen evolution reaction (OER) or oxidation reaction (OR) measured by the current density of 400mA/cm2 is two folds faster and higher than the reduction reaction (RR) or Hydrogen evolution reaction (HER), where the current density produced is near 200 mA/cm2. Thus, the electrochemical decomposition of H2O2 is greatly influenced by the NiO-In2O3 nanocomposite. This behaviour is also explained in Figure (d), where the electrocatalytic recital of NiO and In2O3 are compared with NiO-In2O3. Nevertheless, the enhanced current density profile of NiO-In2O3 augments the slow recombination of electron–hole pairs at the interface of NiO-In2O3 nanocomposite in H2O2 solution. In comparison, a very low response is observed from NiO and In2O3, respectively.
The electrocatalytic performance of NiO, In2O3, and NiO-In2O3 is also investigated in other solutions. CV is performed in 1M aqueous solutions of ascorbic acid and ethanol. In Figure (b), CV curves for NiO, In2O3, and NiO-In2O3 nanomaterials showed good oxidation reactions for 1 M ascorbic acid, while reduction reactions were negligible. The nanocomposite NiO-In2O3 showed a better oxidation reaction than NiO and In2O3. Similarly, in the 1 M ethanol solution, as shown in Figure (c), the current density observed from NiO-In2O3 showed improved redox properties compared to NiO and In2O3. However, the CV curve of the NiO curve shows more oxidation. In summary, the OER and oxygen generation rate is comprehensively enhanced in 1 M H2O2 compared to 1 M ascorbic acid, and 1 M ethanol using NiO-In2O3 nanocomposite.
3.4.2. Linear sweep voltammetry (LSV)
To assess the electrocatalytic characteristics of NiO, In2O3, and NiO-In2O3, linear sweep voltammetry was conducted at varying electrical potentials, and the resulting graphs are depicted in Figure (a-d).
Figure 6. (a) LSV for NiO, In2O3 and NiO-In2O3 in 1 M H2O2 (b) LSV for NiO, In2O3 and NiO-In2O3 in 1 M ascorbic acid (c) LSV for NiO, In2O3 and NiO-In2O3 in 1 M ethanol (d) LSV for NiO-In2O3 in 1 M H2O2, ascorbic acid and ethanol.

The linear sweep voltammetry experiments were performed at a scan rate of 100mV/Sec in the potential range of 1V−1V. The LSV findings further supplement the observation of CV. Figure (a) shows that the current density enhances to ∼900 mA/cm2 at higher potential values (1V). The NiO-In2O3 nanocomposite in 1 M H2O2 solution supported OER/OR more than the HER/RR reaction and recorded 350 mA/cm2 of current density at an applied potential of −1V. Alternatively, in 1 M ascorbic acid, Figure (b), the oxidation reaction overshadowed the reduction reaction for all three tested materials. Again, the nanocomposite NiO-In2O3 showed a better oxidation reaction with a current density of 300 mA/cm2 than NiO, which showed 50 mA/cm2, and In2O3, which showed the least current density >25 mA/cm2. In comparison, the HER/RR reactions were observed at far lower values. In Figure (c), 1 M ethanol solution, the oxidation is more pronounced than the reduction for NiO-In2O3, NiO and In2O3 nanomaterials. The current densities of 250 mA/cm2 from NiO-In2O3, 150 mA/cm2 from NiO and > 50 mA/cm2 from In2O3 are recorded augmenting pronounced OER/OR than HER/RR. To gauge the impact of electrolyte nature on the OER/OR and HER/RR, Figure (d) is developed. We compared the behaviour of NiO-In2O3 nanocomposite in different electrolytes. It is apparent that redox reaction is more perceptible in 1M H2O2, as compared to NiO and In2O3, whose electrocatalytic behaviour has diminished under the same experimental conditions. The fast kinetics, high current density, and predominant OER/OR from NiO-In2O3 nanocomposite are complemented by its high surface area and superior interfacial charge transfer dynamics compared to NiO and In2O3. Secondly, higher electron/hole (e-/h+) separability [Citation51] and restricted electron hole recombination improved its electrocatalytic efficiency. Hence, the most significant achievement acclaimed in these studies is high OER/OR in lower overpotential ranges from the NiO-In2O3 electrocatalysts. In addition, as it is observed from CV scans Figure (a & d) and LSV measurements and Figure (a & b) for NiO-In2O3, fast reaction kinetics are evident. Therefore, it supports the faster decomposition of 1M H2O2 in producing Hydrogen and Oxygen species in the solution. As observed, the current density recorded for OER/RR is two-fold higher than HER/RR, so we can conclude that this electrocatalytic decomposition favours oxygen generation. Furthermore, combining NiO and In2O3 has generated an effectual NiO-In2O3 electrocatalyst where H2O2 can degrade to produce green fuels such as hydrogen and oxygen and is a potential entrant in the renewable energy sector.
Recognizing excellent electrochemical recital NiO-In2O3 in H2O2, a deeper insight into electrochemical properties of the electrocatalysts for OER is studied by linear sweep voltammetry. All potentials were converted to RHE, and the Tafel slope, decade current density, and maximum current densities were estimated as described in Figure . In Figure (a) LSV polarization curves present current density vs. potential profiles, again it is evident that NiO-In2O3 exhibited superior OER activity in 1 M H2O2 i.e. showing current density ≥ 900 mA/cm2 at E (RHE) = 1.46 V. Figure (b) shows Tafel plot of NiO, In2O3, and NiO-In2O3 in 1 M H2O2. Tafel plot is a well-known parameter to evaluate an electrochemical process [Citation52]. From Tafel plot, a subsequent Tafel slope is projected from the LSV curves in such a way that its linear part is extrapolated. The NiO-In2O3 has the lowest Tafel slope of 86 mV/dec compared to 104.86 mV/dec for In2O3 and 139.37 mV/dec for NiO-respectively. Hence, the lower Tafel slope implied the faster reaction rate observed by the NiO-In2O3 electrocatalyst during OER process.
Figure 7. (a) Polarization curves (LSV) for NiO, In2O3, and NiO-In2O3 in 1 M H2O2 (b) Tafel plot used for estimation of Tafel slope for NiO, In2O3, and NiO-In2O3 in 1 M ascorbic acid (c) Decade current density recorded for NiO, In2O3, and NiO-In2O3 in 1 M H2O2 (d) Peak current density recorded for NiO-In2O3 NiO, In2O3, and NiO-In2O3 in 1 M H2O2.

Figure (c & d) depicts the effectiveness of NiO-In2O3, NiO, and In2O3 electrocatalysts in H2O2 by finding the decade and peak current densities at different potentials. An electrochemical process is productive in electrocatalysis if the decade current density (10 mA/cm2) is realized at low potential [Citation53]. NiO-In2O3 showed this current decade at a very low potential as compared to NiO and In2O3 electrocatalysts. A similar trend was observed upon sweeping the potential to higher values to recorded peak current densities. Once again, NiO-In2O3 showed the highest peak current density (900 mA/cm2) just at 230 mV of overpotential with respect to its competing In2O3 (100 mA/cm2) and NiO (57 mA/cm2) electrocatalysts, which at the same overpotential showed remarkably low peak currents. Such electrocatalytic performance by NiO-In2O3 is endorsed by a facile hydrothermal approach, nanoparticle-like morphology that provides a large surface area, ample reaction sites, and restricted electron–hole recombination, thus resulting in enhanced electrochemical performance. This strategy will open new directions for OER in renewable energy, energy storage, and conversion devices.
3.4.3. Electrochemical impedance spectroscopy (EIS)
Electrochemical impedance spectroscopy (EIS) is carried out in a typical three-electrodes electrochemical setup, with multiple electrolytes to examine the electrocatalytic and conductivity of prepared electrodes. Figure (a-d) represents the outcomes (Nyquist plots) of the EIS to study and compare the ion diffuse behaviour and conductivity of NiO, In2O3, and NiO-In2O3 catalysts by observing the charge transfer resistance (Rct). A typical EIS semicircle in the high-frequency region relates to the electron transfer processes, i.e. kinetics. In contrast, the straight slope in the low-frequency region corresponds to the electrode's ion diffusion or mass transport. Therefore, the charge transfer resistance (Rct) value is directly proportional to the diameter of the semicircle [Citation54]. In 1 M solutions of ascorbic acid, ethanol and H2O2 as of Figure (a, b & c), NiO-In2O3 nanocomposite showed lower charge transfer resistance than In2O3 and NiO, respectively. Correlating the enhanced electrocatalytic performance of NiO-In2O3 nanocomposite in H2O2 in CV and LSV studies, we compared EIS of NiO-In2O3 nanocomposite in different concentrations of H2O2 solutions. Figure (d) depicts the EIS curves for NiO-In2O3 in 0.1, 0.25, 0.5, 0.75, and 1 M H2O2 solutions, which showed good charge transfer resistance ratio at different concentrations. Thus, a direct relationship between charge transfer resistance (Rct) and molarity can be deduced. It can be observed that the radius of the semi-circular capacitive loop tends to increase with a decrease in H2O2 concentration. Hence, it indicates that as the concentration of H2O2 increases, the Rct decreases. Thus, a large semicircle at lower concentrations may be due to the mass transfer control mechanism associated with reducing the surface concentration of hydrogen peroxide on the electrode. These are the possible reasons why NiO-In2O3 nanocomposite material showed enhanced electrocatalytic properties as observed in CV and LSV measurements for the decomposition of H2O2 in pronounced OER reactions. This significant electrocatalytic behaviour of NiO-In2O3 is also attributed to the median band gap, high surface area, nanoparticles-like morphology of NiO-In2O3 nanocomposite material that provided more active sites on the material, ample reactive oxide species at the interface of electrocatalyst and electrolyte both benefit in inhibiting faster electron–hole recombination. All the factors mentioned above bolstered the enhanced electrochemical behaviour of the hydrothermally synthesized NiO-In2O3 nanocomposite.
Figure 8. (a) Impedance spectroscopy analysis (Nyquist Plot) of NiO, In2O3 and NiO-In2O3 in 1 M ascorbic acid (b) Impedance spectroscopy analysis (Nyquist Plot) of NiO, In2O3 and NiO-In2O3 in 1 M ethanol (c) Impedance spectroscopy analysis (Nyquist Plot) of NiO, In2O3 and NiO-In2O3 in 1 M H2O2 (d) Impedance spectroscopy analysis (Nyquist Plot) of NiO-In2O3 in different concentration of H2O2.

Impedance analysis of NiO-In2O3 in 1 M H2O2 described enhanced OER activity. Figure (a) presents the comparison of charge transfer resistance (RCT) and exchange current density jexc (mA/cm2) observed. Exchange current density (Jexc) is another parameter for analyzing the inherent electrochemical endeavour of electrocatalysts [Citation55, Citation56]. The exchange current density of NiO, In2O3, and NiO-In2O3 electrocatalysts is calculated in 1 M H2O2 considering charge transfer resistance at electrode-electrocatalyst/electrolyte interphase using the EIS data. It is noteworthy from Figure (a) that NiO-In2O3 shows a high Jexc of 2.73 × 10⁻⁵ mA/cm2. Meanwhile, Jexc of In2O3 and NiO are observed as 2.23 × 10⁻⁶ mA/cm2 and 4.55 × 10⁻⁶, respectively. Figure (b) shows a histogram of peak current densities observed at 230 mV overpotential for NiO, In2O3, and NiO-In2O3 in 1 M H2O2. The current density recorded by NiO-In2O3 is significantly higher than NiO and In2O3 at such a low overpotential.
Figure 9. (a) Plot of charge transfer resistance vs exchange current density for NiO, In2O3 and NiO-In2O3 in 1 M 1 M H2O2 (b) Over potential vs Peak current density of NiO, In2O3 and NiO-In2O3 in 1 M H2O2 (c) Current density vs Potential in RHE and (d) Turn over frequency vs potential in RHE estimated for NiO, In2O3 and NiO-In2O3 in 1 M H2O2.

Figure (c) presents the highest current density generated across the applied potential range. However, Figure (d) illustrates turnover frequency (TOF) [Citation57] for electrocatalysts to appraise their electrocatalytic efficiency. TOF was calculated using a standard procedure (details provided in supplementary information, Table S1) at various sweeping potentials during LSV measurements. The TOFs observed for NiO, In2O3, and NiO-In2O3 are 0.55, 0.32, and 5.0 s−1, respectively, which depicts the highest TOF by NiO-In2O3. It is assumed that NiO-In2O3 electrocatalysts offer plentiful active sites for substantially fast electron transfer reactions without any electron–hole recombination. Hence, augmenting NiO-In2O3 superior electrocatalytic OER activity compared to its counterparts, which also leads to understanding the feasible kinetics of the electrochemical process over the electrode surface. The high TOF reflects a quicker charge transfer process at the electrode surface, making it diffusion-controlled and kinetically fast. These findings illustrate that NiO-In2O3 electrocatalysts have optimum electroactive sites [Citation58] over their nano-surfaces that derive the OER process at low overpotentials and demonstrate feasible reaction kinetics under employed electrochemical conditions.
3.4.4. Stability analysis of NiO-In2O3 electrocatalysts
Chropotentiometry was exploited to examine the durability of the electrocatalysts. In chronopotentiometry, a constant current at the working electrode is maintained for a given period. Normally, the current is kept steady among working and counter electrodes while the potential is determined at the working electrode, compared to the reference electrode. During a CP measurement, electrochemically active species can disperse on the surface of the working electrode to balance the applied current until the diffusion restricted concentration of such electroactive species reaches zero on the electrode's surface. The CP measurements of all the nanomaterials NiO, In2O3, and NiO-In2O3 were done in 1M H2O2 solution based on their excellent electrocatalytic performance in CV, LSV, and EIS measurements. The ensuing data is presented in Figure (a). It shows that the NiO-In2O3 nanocomposite has long-term durability for several hours (>90 h), complementing its stable behaviour in 1 M H2O2. The straight-line overpotential response against three applied current densities underpins the protracted stability of NiO-In2O3 electrocatalyst during the electrocatalysis of H2O2. Regarding potential, its endurance has greatly increased compared to its constituents NiO and In2O3. Hence augmenting the fast decomposition of H2O2 while keeping the NiO-In2O3 nanocomposite material stable on the surface of electrode for an extended period.
Figure 10. (a) Chronopotentiometry response of NiO-In2O3 in 1 M H2O2 prepared hydrothermally. The CP profiles show enhanced overpotential and long-term durability of NiO-In2O3 10, 20, and 30 mA cm−2 beyond >90 h. (b) LSV polarization curves for NiO-In2O3 before and after the durability test show a similar current density profile for the entire potential.

Figure (b) elucidates a comparative LSV polarization curve analysis before and after durability tests for NiO-In2O3 electrocatalyst. After the stability analysis, the LSV polarization curve shows consistent behaviour throughout the sweeping potential window tested. Hence, it further imitates that NiO-In2O3 electrocatalyst prepared hydrothermally showed long-term stability and similar LSV current density profiles before and after the stability experiments. So NiO-In2O3 electrocatalyst is a potential electrocatalyst that has strong and consistent electrocatalytic activity, durability with other enormous electrochemical properties that have made NiO-In2O3 electrocatalyst great potential catalyst that can work under severe environments for prolonged experimental investigations. In summary, the hydrothermally fabricated NiO-In2O3 nanocomposite with such superior electrocatalytic properties will expose new-fangled prospects in scheming modest, economical, and innovative nanostructured electrocatalysts that can meet the heightened future energy/renewable energy challenges.
4. Conclusion
In this work, we presented hydrothermal fabrication and characterization of NiO, In2O3, and NiO-In2O3 nanomaterials. The electrochemical studies demonstrated that NiO-In2O3 holds excellent electrocatalytic properties as it appears to be a high-performance and extraordinary electrode material for oxygen/hydrogen evolution reactions in aqueous solutions. Electrochemical measurements confirmed that the NiO-In2O3 electrode exhibits superior OER catalytic performance in all aqueous solutions. Hence, higher activity is achieved in 1M H2O2 solution many folds, showing a current density of 900 mA/cm2. The electrochemical impedance spectroscopy also revealed that increasing the concentration of H2O2 decreases the charge transfer resistance for NiO-In2O3 nanomaterial. Therefore, its enhanced electrochemical nature led to faster decomposition of H2O2 solution and more contribution to higher OER activity. The chronopotentiometry also revealed the durability and stability of NiO-In2O3 nanomaterials for longer periods. We presume that our research endeavours will improve research and development to design simple and cost-effective strategies for synthesizing innovative nanostructured electrocatalysts with a highly efficient electrochemical recital for eclectic energy/renewable energy applications.
Supplemental Material
Download MS Word (115.8 KB)Acknowledgments
All the authors extend appreciation to the Deanship of Scientific Research (DSR), University of Hafr Al Batin, Hafr Al Batin, Kingdom of Saudi Arabia, for funding this work through the research group grant project number 0010-1443-S.
Disclosure statement
No potential conflict of interest was reported by the author(s).
Additional information
Funding
References
- Fujishima A, Honda K. Electrochemical photolysis of water at a semiconductor electrode. Nature. 1972;238(5358):37–38.
- Maeda K, Domen K. Photocatalytic water splitting: recent progress and future challenges. J Phys Chem Lett. 2010;1(18):2655–2661.
- Osterloh FE, Parkinson BA. Recent developments in solar water-splitting photocatalysis. MRS Bull. 2011;36(01):17–22.
- Iqbal N, Khan I, Yamani ZH, et al. Sonochemical assisted solvothermal synthesis of gallium oxynitride nanosheets and their solar-driven photoelectrochemical water-splitting applications. Sci Rep. 2016;6:32319.
- Iqbal N, Khan MS, Zubair M, et al. Advanced photoelectrochemical hydrogen generation by CdO-g-C3N4 in aqueous medium under visible light. Molecules. 2022;27(24):8646.
- Greeley J, Jaramillo TF, Bonde J, et al. Computational high-throughput screening of electrocatalytic materials for hydrogen evolution. Nat Mater. 2006;5(11):909–913.
- Xu Y-Z, Yuan C-Z, Chen X-P. One-pot synthesis nickel sulfide/amorphous molybdenum sulfide nanosheets array on nickel foam as a robust oxygen evolution reaction electrocatalyst. J Solid State Chem. 2017;256:124–129.
- Toma FM, Sartorel A, Iurlo M, et al. Efficient water oxidation at carbon nanotube–polyoxometalate electrocatalytic interfaces. Nat Chem. 2010;2(10):826–831.
- Zhang C, Antonietti M, Fellinger T-P. Blood ties: Co3O4 Decorated blood derived carbon as a superior bifunctional electrocatalyst. Adv Funct Mater. 2014;24(48):7655–7665.
- Ehsan MA, Hakeem AS, Rehman A. Hierarchical growth of CoO nanoflower thin films influencing the electrocatalytic oxygen evolution reaction. Electrocatalysis. 2020;11(3):282–291.
- Li C, Baek J-B. Recent advances in noble metal (Pt, Ru, and Ir)-based electrocatalysts for efficient hydrogen evolution reaction. ACS Omega. 2020;5(1):31–40.
- Ehsan MA, Rehman A, Afzal A, et al. Highly effective electrochemical water oxidation by millerite-phased nickel sulfide nanoflakes fabricated on Ni foam by aerosol-assisted chemical vapor deposition. Energy Fuels. 2021;35(19):16054–16064.
- Rehman A, Ehsan MA, Afzal A, et al. Aerosol-assisted nanostructuring of nickel/cobalt oxide thin films for viable electrochemical hydrazine sensing. Analyst. 2021;146(10):3317–3327.
- Elmacı G, Ertürk AS, Sevim M, et al. MnO2 nanowires anchored on mesoporous graphitic carbon nitride (MnO2@ mpg-C3N4) as a highly efficient electrocatalyst for the oxygen evolution reaction. Int J Hydrogen Energy. 2019;44(33):17995–18006.
- Yin L, Ding X, Wei W, et al. Improving catalysis for electrochemical water splitting using a phosphosulphide surface. Inorg Chem Front. 2020;7(12):2388–2395.
- Suryanto BHR, Wang Y, Hocking RK, et al. Overall electrochemical splitting of water at the heterogeneous interface of nickel and iron oxide. Nat Commun. 2019;10(1):5599.
- Elmaci G. Microwave assisted green synthesis of Ag/AgO nanocatalyst as an efficient OER catalyst in neutral media. Hittite J Sci Eng. 2020;7(1):61–65.
- Ma X, Zhang W, Deng Y, et al. Phase and composition controlled synthesis of cobalt sulfide hollow nanospheres for electrocatalytic water splitting. Nanoscale. 2018;10(10):4816–4824.
- Chauhan M, Deka S. Hollow cobalt sulfide nanoparticles: a robust and Low-cost pH-universal oxygen evolution electrocatalyst. ACS Appl Energy Mate. 2020;3(1):977–986.
- Swathi S, Yuvakkumar R, Ravi G, et al. Silver-doped cadmium sulfide for electrochemical water oxidation. Appl Nanosci. 2020;10(11):4351–4358.
- Elmacı G, Özgenç G, Kurz P, et al. Enhanced water oxidation performances of birnessite and magnetic birnessite nanocomposites by transition metal ion doping. Sustainable Energy Fuels. 2020;4(6):3157–3166.
- Elmaci G, Icten O, Ozer D, et al. Manganese oxoborate-based nanostructures as novel oxygen evolution catalysts in neutral media. Chem Nano Mat. 2021;7(12):1340–1347.
- Icten O, Ozer D, Elmaci G. Boron doped cryptomelane as a highly efficient electrocatalyst for the oxygen evolution reaction. Int J Hydrogen Energy. 2021;46(80):39810–39821.
- Zheng X, Han X, Zhang Y, et al. Controllable synthesis of nickel sulfide nanocatalysts and their phase-dependent performance for overall water splitting. Nanoscale. 2019;11(12):5646–5654.
- Tiwari AP, Yoon Y, Novak TG, et al. Continuous network of phase-tuned nickel sulfide nanostructures for electrocatalytic water splitting. ACS Appl Nano Mater. 2019;2(8):5061–5070.
- Huang R, Chen W, Zhang Y, et al. Well-designed cobalt-nickel sulfide microspheres with unique peapod-like structure for overall water splitting. J Colloid Interface Sci. 2019;556:401–410.
- Jin S, Zhu Y, He Z, et al. Revealing the effects of oxygen defects on the electrocatalytic activity of nickel oxide. Int J Hydrogen Energy. 2020;45(1):424–432.
- Gong M, Zhou W, Tsai MC, et al. Nanoscale nickel oxide/nickel heterostructures for active hydrogen evolution electrocatalysis. Nat commun. 2014;5(1):1–6.
- Ibrahim AA, Khan I, Iqbal N, et al. Facile synthesis of tungsten oxide – Bismuth vanadate nanoflakes as photoanode material for solar water splitting. Int J Hydrogen Energy. 2017;42(5):3423–3430.
- Wrede S, Tian H. Towards sustainable and efficient p-type metal oxide semiconductor materials in dye-sensitised photocathodes for solar energy conversion. Phys Chem Chem Phys. 2020;22(25):13850–13861.
- Zhang M, Lin Y, Mullen TJ, et al. Improving hematite’s solar water splitting efficiency by incorporating rare-earth upconversion nanomaterials. J Phys Chem Lett. 2012;3(21):3188–3192.
- Ehsan MA, Naeem R, Rehman A, et al. Facile fabrication of CeO2–TiO2 thin films via solution based CVD and their photoelectrochemical studies. J Mater Sci: Mater Electron. 2018;29(15):13209–13219.
- Rehman A, Ehsan MA, Afzal A, et al. Aerosol-assisted nanostructuring of nickel/cobalt oxide thin films for viable electrochemical hydrazine sensing. Analyst. 2021;146(10):3317–3327.
- Komarneni S. Nanophase materials by hydrothermal, microwave-hydrothermal and microwave-solvothermal methods. Curr Sci. 2003;85(12):1730–1734.
- Dem’yanets LN, Lyutin VI. Status of hydrothermal growth of bulk ZnO: latest issues and advantages. J Cryst Growth. 2008;310(5):993–999.
- Jain A, Ong SP, Hautier G, et al. Commentary: the materials project: a materials genome approach to accelerating materials innovation. APL Mater. 2013;1(1):011002.
- Belsky A, Hellenbrandt M, Karen VL, et al. New developments in the Inorganic Crystal Structure Database (ICSD): accessibility in support of materials research and design. Acta Crystallogr, Sect B: Struct Sci. 2002;58(3-1):364–369.
- El-Kemary M, Nagy N, El-Mehasseb I. Nickel oxide nanoparticles: synthesis and spectral studies of interactions with glucose. Mater Sci Semicond Process. 2013;16(6):1747–1752.
- Nistor M, Seiler W, Hebert C, et al. Effects of substrate and ambient gas on epitaxial growth indium oxide thin films. Appl Surf Sci. 2014;307:455–460.
- Ma X, Zhu H, Yu L, et al. Rare earth doped indium oxide nanospheres based gas sensor for highly sensitive formaldehyde detection at low temperature. Nanoscale. 2023;15(4):1609–1618.
- Li J, Yan R, Xiao B, et al. Preparation of nano-NiO particles and evaluation of their catalytic activity in pyrolyzing biomass components. Energy Fuels. 2008;22(1):16–23.
- Alanazi HS, Alotaibi H, AL-Shehri HS, et al. Structural, morphological and optical behavior of green synthesized NiO nanoparticle for methylene blue photo-degradation. J Nanoelectron Optoelectron. 2021;16(10):1684–1689.
- Sharma AK, Desnavi S, Dixit C, et al. Extraction of nickel nanoparticles from electroplating waste and their application in production of bio-diesel from biowaste. Int J Chem Eng Appl. 2015;6(3):156.
- Chandradass J, Han KS, Bae DS. Synthesis and characterization of zirconia-and silica-doped zirconia nanopowders by oxalate processing. J Mater Process Technol. 2008;206(1-3):315–321.
- Kulkarni SC, Patil DS. Synthesis and characterization of uniform spherical shape nanoparticles of indium oxide. J Mater Sci: Mater Electron. 2016;27:3731–3735.
- Singh VN, Mehta BR. A two-step synthesis procedure for In2O3 nanoparticle films having well-defined particle size. Jpn J Appl Phys. 2003;42(7R):4226.
- Poznyak SK, Golubev AN, Kulak AI. Correlation between surface properties and photocatalytic and photoelectrochemical activity of In2O3 nanocrystalline films and powders. Surf Sci. 2000;454:396–401.
- Robinson JW. Practical handbook of spectroscopy. Boca Raton, FL: CRC press; 1991.
- Mondal A, Ram S. Reconstructive phase formation of ZrO2 nanoparticles in a new orthorhombic crystal structure from an energized porous ZrO (OH) 2· xH2O precursor. Ceram Int. 2004;30(2):239–249.
- Habib A, Khan MS, Zubair M, et al. Ni-Doped In2O3 nanoparticles and their composite with rGO for efficient degradation of organic pollutants in wastewater under visible light irradiation. Int J Mol Sci. 2023;24(9):7950.
- Iqbal N, Afzal A, Khan I, et al. Molybdenum impregnated g-C3N4 nanotubes as potentially active photocatalyst for renewable energy applications. Sci Rep. 2021;11(1):16886.
- Shinagawa T, Garcia-Esparza AT, Takanabe K. Insight on Tafel slopes from a microkinetic analysis of aqueous electrocatalysis for energy conversion. Sci Rep. 2015;5(1):13801.
- Ehsan MA, Ullah Z, Nazar MF, et al. One step fabrication of nanostructured nickel thin films on porous nickel foam for drastic electrocatalytic oxygen evolution. Int J Hydrogen Energy. 2023.
- Chang BY, Park SM. Electrochemical impedance spectroscopy. Annu Rev Anal Chem. 2010;3(1):207.
- McCrory CCL, Jung S, Peters JC, et al. Benchmarking heterogeneous electrocatalysts for the oxygen evolution reaction. J Am Chem Soc 2013;135(45):16977–16987.
- Ehsan MA, Babar N-U-A. Straightforward preparation of Fe-based electrocatalytic films at various substrates for IrO2-like water oxidation activity. Energy Fuels. 2023.
- Costentin C, Drouet S, Robert M, et al. Turnover numbers, turnover frequencies, and overpotential in molecular catalysis of electrochemical reactions. cyclic voltammetry and preparative-scale electrolysis. J Am Chem Soc 2012;134(27):11235–11242.
- Babar N-U-A, Khan A, Hakeem AS, et al. NiPd nano-alloy film as a promising low overpotential electrocatalyst for high activity water oxidation reaction. J Environ Chem Eng. 2022;10(3):107959.