
ABSTRACT
The East Asian westerly jet (EAJ) plays a crucial role in affecting the East Asian summer rainfall (EASR). Therefore, evaluations of EAJ simulations are vital for improving the understanding and projections of climate change in East Asia. This study evaluates the simulations of the climatology and interannual variability in the present-day summer EAJ in the CMIP6 models and compares the results with those in the CMIP5 models by analyzing the historical climate simulations of 29 CMIP5 models and 21 CMIP6 models during the period from 1986–2005. In general, the CMIP6 models capture the EAJ more realistically than the CMIP5 models. The results show that the CMIP6 models reasonably capture the spatial features of the climatological zonal wind at 200 hPa and simulate a smaller zonal wind bias along the EAJ. The locations of the EAJ’s core are at the observed location in nearly all CMIP6 models but in only approximately two-thirds of the CMIP5 models. The EAJ’s intensity is closer to the observed value and exhibits a smaller intermodel dispersion in the CMIP6 models. The CMIP6 models also show an improved ability to reproduce the interannual variability in the EAJ’s meridional displacement and have a stronger relationship with the EASR.
Graphical Abstract
摘要
东亚高空西风急流 (简称急流) 对东亚夏季降水有着重要影响, 因此, 评估气候系统模式对急流的模拟能力对理解东亚气候变化至关重要。本文利用21个CMIP6气候系统模式历史气候模拟试验数据, 结合NCEP和GPCP再分析资料, 评估了CMIP6模式对现代 (1986–2005年) 急流气候态和年际变率的模拟能力, 并与CMIP5模式模拟结果进行了对比。结果表明, CMIP6模式模拟的200 hPa纬向风的空间分布特征更加真实, 沿急流方向的偏差更小。在CMIP6模式中, 急流中心位置几乎与观测一致, 但只有约三分之二的CMIP5模式能模拟出急流中心位置。CMIP6模式模拟的急流强度也更接近于观测值, 并且模式间不确定性减小。另外, CMIP6模式也改进了对急流经向位移年际变率的模拟能力, 因而模拟的急流与东亚夏季降水的相关关系更强。总体而言, 相对于CMIP5模式, CMIP6模式明显改进了对急流的模拟效果。
1. Introduction
The East Asian westerly jet (EAJ) in the upper troposphere is an important component of the East Asian summer (June–July–August) monsoon. The EAJ is located north of the East Asian subtropical rainy belt, and its intensity and location significantly affect the East Asian summer rainfall (EASR) (Lu Citation2004; Xuan, Zhang, and Sun Citation2011). Therefore, evaluations of the current EAJ simulations by coupled atmosphere-ocean general circulation models (AOGCMs) are vital to improve the understanding and projecting climate change in East Asia.
Several studies have evaluated the ability of models to represent the observed EAJ climatology, location, intensity, and interannual variability. It has been reported that some individual models can generally capture the spatial structure of climatological summer EAJ (Song and Zhou Citation2013; Du, Bao, and Xie Citation2017; Zhao et al. Citation2018) and its interannual relationship to the EASR (Lu and Fu Citation2010). However, by analyzing the output of the Community Climate Model Version 3, Zhang and Guo (Citation2005) found a large bias in the simulated intensity and location of the EAJ, which caused unreasonable maximum precipitation to be simulated over East Asia.
Moreover, large intermodel discrepancy exists among the individual models in representing the observed EAJ. Based on 14 CMIP5 models, Huang et al. (Citation2013) reported that large differences existed in both the intensity and location of the simulated EAJ, which contributed to the uncertainty in the simulation of the EASR. Ma, Xu, and Lin (Citation2015) also showed substantial meridional position biases for the EAJ among 20 CMIP5 models, although the multimodel ensemble (MME) was able to present a very realistic EAJ. Recently, Lin, Fu, and Lu (Citation2019) also noted that the CMIP5 models exhibited large discrepancies in the longitudinal locations of the core of the EAJ.
The CMIP6 has been carried out on a new set of coordinated climate model experiments using a new generation of AOGCMs (Eyring et al. Citation2016). Compared to the earlier versions of AOGCMs used in the CMIP5, the CMIP6 models have been improved in many aspects, such as higher resolutions in the atmosphere and ocean, an improved representation of physics (e.g. Wu et al. Citation2019), and improved representation of aerosols (e.g. Wyser et al. Citation2019). Therefore, the output data provide an opportunity to estimate the abilities of these new AOGCMs to simulate the EAJ, which is the motivation for the present study.
In this study, we evaluate the abilities of the CMIP6 models to simulate the summer EAJ and attempt to determine whether they exhibit improvements in comparison with the CMIP5 models. The rest of the paper is organized as follows: Section 2 describes the data and methods; Section 3 displays the simulation of the EAJ in the CMIP6 models and the comparisons with the simulations in the CMIP5 models. The conclusions are provided in Section 4.
2. Data and methods
The outputs of 29 CMIP5 models (1850–2005) and 21 CMIP6 models (1850–2014) were downloaded for their historical climate simulations. Only one realization of the ensembles is selected for each model. lists the key information about the models. For the observations, the National Center for Environmental Prediction (NCEP) reanalysis data (Kalnay et al. Citation1996) and Global Precipitation Climatology Project (GPCP) precipitation data (Adler et al. Citation2003) were used in this study.
Table 1. Basic information of the CMIP5 and CMIP6 models used in this study
The simulation results from 1986–2005 were used to depict the present-day climate to ensure that the times for the observations and CMIP5 and CMIP6 model outputs were consistent. The climatology was calculated as the 20-year mean. Additionally, all simulations were interpolated onto a common 2.5° × 2.5° grid by bilinear interpolation to enable the MME analyses. The MME result was obtained by simply averaging the outputs of the individual models with equivalent weights. The correlations and regressions were first calculated for each model, and then the MME was created. The interannual standard deviation was used to depict the intensity of interannual variability. The interannual variability component was obtained by applying a nine-year Gaussian filter to the detrended data. The methodologies are all the same as those in Lu and Fu (Citation2010).
3. Results
3.1 Simulation of the zonal wind at 200 hPa over East Asia
shows the summer mean zonal winds at 200 hPa (U200) in the observations, CMIP6 MME, and 21 CMIP6 models averaged over 1986–2005. In the observations, a strong westerly jet prevails at midlatitude over Asia, with the maximum speed exceeding 25.0 m s−1 along the EAJ’s axis at approximately 40°N, and a relatively weak core appears over Japan. The spatial pattern of U200 in the CMIP6 MME result bears high similarity to the observations, but the intensity is slightly weaker. The results also show that almost all CMIP6 models simulate the observed summer U200 reasonably well, except for several models (e.g. CNRM-CM6-1, CNRM-ESM2-1, and IPSL-CM6A-LR) that decelerate the zonal wind speed along the EAJ. The results suggest that the CMIP6 models generally capture the basic spatial features of the climatological U200.
Figure 1. The summer mean U200 in NCEP reanalysis, the CMIP6 MME, and the individual models averaged over 1986–2005. Shading depicts region with U200 exceeding 25 m s–1. Units: m s–1

The agreement between the observed U200 and that simulated in the CMIP6 models over (20°–60°N, 60°–180°E) during the period from 1986–2005 is further evaluated with a Taylor diagram () (Taylor Citation2001). The diagram shows that almost all CMIP6 models can sufficiently reproduce the observed characteristics of the summer U200. With the exception of one model (MCM-UA-1-0), all models have correlation coefficients with the observation larger than 0.9, normalized standard deviations between 0.75 and 1.25, and root-mean-square errors less than 0.5. In comparison with the results of the CMIP5 models, which are the same as those presented by Fu and Guo (Citation2020, ), the CMIP6 models are more centralized and closer to the observations, especially for the correlation coefficients. The smaller intermodel spread suggests a notable improvement in the U200 simulations by the CMIP6 models.
Figure 2. (a) Taylor diagram of U200 over (20°–60°N, 60°–180°E) between the NCEP Reanalysis data and CMIP5 (blue) and CMIP6 (red) model outputs during the period of 1986–2005. The solid line indicates the root-mean-square error; the dashed line indicates the normalized standard deviation; the dot line indicates the correlation coefficient of 0.6 and 0.9. (b) The CMIP5 MME summer U200 bias (shading) and the inter-model standard deviation of biases (contour lines). Units: m s–1. (c) As in (b), but for the CMIP6 MME

Furthermore, the CMIP6 models simulate smaller biases of U200 than the CMIP5 models (). The biases of U200 are characterized by a ‘positive–negative–positive’ tripole pattern, which is depicted by the shading in ), from south to north in the CMIP5 MME, which is similar to the results of Ma, Xu, and Lin (Citation2015). The maximum and minimum biases are approximately 4.0 and −3.0 m s−1, respectively. The biases in the CMIP6 MME show a similar pattern to that in the CMIP5 MME ()). However, the biases are weaker to the south of 50°N along the EAJ’s axis and on its southern side, with maximum and minimum biases of approximately 2.0 and −2.0 m s−1, respectively, but the biases are larger to the north of 50°N on the northern side of the EAJ, with a maximum bias of approximately 4.0 m s−1 ()). Considering that the main body of the EAJ is located between 30°N and 50°N, the results suggest that the CMIP6 models represent the EAJ more realistically and with less bias.
Moreover, the intermodel spread of the U200 biases, which are depicted by the contours in , in the CMIP6 models is smaller than that in the CMIP5 models. The standard deviation decreases by approximately 2.0 m s−1 in the CMIP6 models, especially along the EAJ’s axis region, in comparison with that in the CMIP5 models.
3.2 Simulation of the location and intensity of the EAJ
) shows the climatological locations of the EAJ’s core in the NCEP reanalysis data and CMIP5 models. The EAJ’s core is defined as the location with the maximum U200 in the domain (20°–60°N, 60°–180°E), according to Lin, Fu, and Lu (Citation2019). In the NCEP reanalysis data, the EAJ’s core is located at (40°N, 90°E). However, there is uncertainty among the different reanalysis/observation datasets. For example, the location of the western Pacific subtropical high differs by approximately one degree in latitude among the reanalysis datasets (He and Zhou Citation2015), and the uncertainty of the rainfall among the observational datasets is even greater than the intermodel spread in some cases (Collins et al. Citation2013). Therefore, we also determine the location of the EAJ’s core using the ERA-Interim reanalysis (Dee et al. Citation2011). In the ERA-Interim reanalysis, the EAJ’s core is also located at (40°N, 90°E), which is the same as that in the NCEP reanalysis.
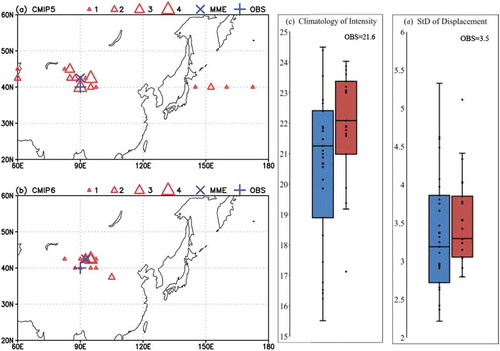
Figure 3. (a) Climatological locations of the summer EAJ’s core in 29 CMIP5 models (red triangles), the MME (blue multiplication sign), and the observation (blue cross), where U200 is maximum over the domain (20°–60°N, 60°–180°E). Sizes of triangles depict numbers of models. (b) As in (a), but for the CMIP6 models. (c) Boxplot of EAJ-intensity indices. Black line in box indicates the median, the black multiplication sign indicates the MME, and black dots indicate the individual models. The observed value in the NCEP reanalysis is given in top-right corner. Units: m s–1

Similar to the results by Lin, Fu, and Lu (Citation2019), the location of the EAJ’s core is extremely variable among the 29 CMIP5 models ()). Only approximately two-thirds (21 in 29) of the CMIP5 models capture the longitudinal location across the domain of 80°–100°E, which is close to the observed longitudinal location at 90°E, despite the similarity between the MME and the observations. For the remaining one-third of the CMIP5 models, the EAJ’s core is located at approximately 60°E over Asia in three models and to the east of 120°E over the western North Pacific in five models, all being far away from the observed location. However, the longitudinal locations of the EAJ in the CMIP6 MME and nearly all CMIP6 models are within the domain of 80°–100°E, which are almost at the same location as the observations ()). In addition, the CMIP6 models also simulate the latitudinal locations of the EAJ’s core more reasonably than the CMIP5 models. We then conclude that the CMIP6 models perform better than the CMIP5 models in representing the locations of the EAJ’s core.
To facilitate the quantitative estimation of the abilities of models to simulate the EAJ intensity, the EAJ intensity index was defined by the mean U200 averaged over its core region (30°–50°N, 70°–120°E) for the period from 1986–2005, which is similar to the definition used by Fu and Guo (Citation2020). ) shows the boxplot of the EAJ intensity index in the CMIP5 and CMIP6 models. Clearly, the CMIP6 models exhibit smaller dispersion in the EAJ’s intensity than exhibited by the CMIP5 models. The intensity ranges from approximately 15.5 to 24.5 m s−1 in the CMIP5 models, while it ranges from approximately 19.2 to 24.0 m s−1 in the CMIP6 models (except for one outlier, MCM-UA-1-0), which is closer to the observed value (approximately 21.9 m s−1 in the NCEP reanalysis and 22.0 m s−1 in the ERA reanalysis). Moreover, the CMIP6 models simulate stronger intensities than the CMIP5 models, with the median and MME values of the CMIP6 models being approximately 22.1 and 21.9 m s−1 compared with values of approximately 21.2 and 20.7 m s−1 in the CMIP5 models, respectively. Additionally, between the 25th and 75th quartiles, the EAJ’s intensity ranges from approximately 18.9 to 22.4 m s−1 in the CMIP5 models, but the spread decreases from approximately 21.0 to 23.6 m s−1 in the CMIP6 models.
3.3 Simulation of the interannual variability in the EAJ and relation to the EASR
Lin and Lu (Citation2005) showed that meridional displacement of the EAJ dominates the year-to-year variations in U200 over East Asia. As mentioned before, the interannual meridional displacement of the EAJ directly affects the EASR (Lu Citation2004). According to Lu (Citation2004), the meridional displacement index is defined by the difference between the U200 averaged over (30°–40°N, 120°–150°E) and (40°–50°N, 120°–150°E). A positive (negative) meridional displacement index indicates a southward (northward) displacement of the EAJ. ) shows the interannual variability in the EAJ’s meridional displacement simulated in the CMIP5 and CMIP6 models. The interannual variability in the EAJ in the CMIP6 models is closer to the observed value, and its intermodel spread is smaller. This value ranges from approximately 2.2 to 5.3 m s−1 in the CMIP5 models but from approximately 2.8 to 4.4 m s−1 in the CMIP6 models (except for one outlier, NorCPM1). Moreover, the median and MME values are approximately 3.2 and 3.4 m s−1 in the CMIP5 models, respectively, while these values increase to approximately 3.3 and 3.5 m s−1 in the CMIP6 models, which are closer to the observed value (3.5 m s−1).
Figure 4. (a) Boxplot of the interannual variability in EAJ’s meridional displacement, which is depicted by standard deviation, in the CMIP5 and CMIP6 models, respectively (Units: m s–1). Black line in box indicates the median, the black multiplication sign indicates the MME, and black dots indicate the individual models. The observed value is given in top-right corner. (b) The summer precipitation regressed onto the standardized EAJ meridional displacement index in the observation (Units: mm d–1). The contour lines indicate the regression coefficient, with the interval being 0.2, and the values significant at the 0.05 level are shaded (yellow, negative; blue, positive). The parallelogram indicates the region used to define the EASRI. (c) As in (b), but for the CMIP5 MME. (d) As in (b), but for the CMIP6 MME. (e) As in (a), but for the correlation coefficients between the EAJ meridional displacement index and the EASRI

The improved interannual variability in the EAJ’s meridional displacement slightly improves the related summer rainfall over East Asia in the MME results. shows the summer precipitation regressed onto the normalized EAJ meridional displacement index in the observations, CMIP5 MME, and CMIP6 MME. In the observations, a southward shift of the EAJ corresponds to more precipitation along the East Asian rain belt and less precipitation in north and northeast China ()), which is consistent with previous results (Lu and Fu Citation2010). The MMEs of both CMIP5 and CMIP6 basically reproduce the observed EAJ-related precipitation anomalies, although the simulated precipitation anomalies are relatively weaker than the observations (). However, the positive and negative rainfall anomalies in the CMIP6 MME are more significant and stronger than those in the CMIP5 MME.
This improved relationship can be quantitatively verified by the boxplots of the correlation coefficient between the EAJ meridional displacement index and the EASR index (EASRI). The EASRI is defined as the summer precipitation averaged over the parallelogram region determined by the following points: (25°N, 100°E), (35°N, 100°E), (30°N, 160°E), and (40°N, 160°E) to mimic the East Asian summer rainband and is identical to that in Lu and Fu (Citation2010). Except for the outliers, the EAJ-EASR correlation coefficient ranges from 0.1 to 0.8 in the CMIP5 models, while it increases to 0.2 to 0.9 in the CMIP6 models, although the relationships in the CMIP6 median and MME are relatively weaker. However, there is still a large discrepancy between the individual CMIP6 models. In addition, the relationships are statistically significant at the 0.05 level in approximately three-quarters of both the CMIP5 and CMIP6 models.
4. Conclusions
This study evaluates the simulation of the climatology and interannual variability in the present-day EAJ in the CMIP6 models and compares the results with those in the CMIP5 models using the historical climate simulations of 29 CMIP5 models and 21 CMIP6 models during the period from 1986–2005.
Almost all CMIP6 models were found to reasonably capture the observed climatological U200 spatial features, with higher correlation coefficients and lower root-mean-square errors with the observations compared to those in the CMIP5 models. The CMIP6 models simulate a smaller bias for U200 and exhibit a smaller intermodel dispersion of the bias than the CMIP5 models. In addition, the climatological longitudinal and latitudinal locations of the EAJ’s core are almost at the same location as the observations (40°N, 80°–100°E) in nearly all CMIP6 models; however, only approximately two-thirds of the CMIP5 models reproduce the observed longitudinal locations between 80°E and 100°E. The simulated intensity of the EAJ in the CMIP6 models is stronger and closer to the observations and has a smaller intermodel spread than the CMIP5 models.
The CMIP6 models improve the simulation of interannual variability in EAJ’s meridional displacement, with stronger standard deviations that are close to the observations and have a smaller intermodel spread. In the meantime, the EAJ’s meridional displacement-related rainfall anomalies are more significant and stronger in the CMIP6 MME than those in the CMIP5 MME. The CMIP6 models simulate a relatively stronger relationship with the EASR, although intermodel dispersion remained in the EAJ-EASR relationship.
The present study shows the improvements in the simulation of the EAJ in the CMIP6 models, with an improved description of the intensity and longitudinal location as well as reduced uncertainty. The improvements are likely induced by the improved AOGCMs in the CMIP6, for example, the higher resolutions in the atmosphere and ocean, improved representations of physical processes (Wu et al. Citation2019) and improved representation of aerosols (Wyser et al. Citation2019). However, how the changes in the AOGCMs improve the simulation of the EAJ in the CMIP6 models is unclear. This phenomenon is beyond the scope of this study and requests further study in the future.
Acknowledgments
We acknowledge the World Climate Research Programme, which, through its Working Group on Coupled Modelling, coordinated and promoted CMIP6. We thank the climate modeling groups for producing and making available their model output, the Earth System Grid Federation (ESGF) for archiving the data and providing access, and the multiple funding agencies that support CMIP6 and ESGF.
Disclosure Statement
No potential conflict of interest was reported by the authors.
Additional information
Funding
References
- Adler, R. F., G. J. Huffman, A. Chang, R. Ferraro, P.-P. Xie, J. Janowiak, B. Rudolf, et al. 2003. “The Version-2 Global Precipitation Climatology Project (GPCP) Monthly Precipitation Analysis (1979-present).” Journal of Hydrometeorology 4: 1147–1167. doi:10.1175/1525-7541(2003)004<147:tvgpcp>2.0.CO;2.
- Collins, M., K. KAchutaRao, K. Ashok, S. Bhandari, A. Mitra, S. Prakash, R. Srivastava, and A. Turner. 2013. “Observational Challenges in Evaluating Climate Models.” Nature Climate Chang 3: 940–941. https://doi.org/10.1038/nclimate2012.
- Dee, D. P., S. M. Uppala, A. J. Simmons, P. Berrisford, P. Poli, S. Kobayashi, U. Andrae, et al. 2011. “The ERA-Interim Reanalysis: Configuration and Performance of the Data Assimilation System.” Quarterly Journal of the Royal Meteorological Society 137: 553–597. doi:10.1002/qj.828.
- Du, Y., Q. Bao, and Z. Xie. 2017. “FGOALS Model Simulation of Variation of East Asian Subtropical Westerly Jet during Meiyu Period.” Chinese Journal of Atmospheric Sciences 41 (D3): 603–617. doi:10.3878/j..1006-9895.1609.16185.
- Eyring, V., S. Bony, G. A. Meehl, C. A. Senior, B. Stevens, R. J. Stouffer, and K. E. Taylor. 2016. “Overview of the Coupled Model Intercomparison Project Phase 6 (CMIP6) Experimental Design and Organization.” Geoscientific Model Development 9 (5): 1937–1958. doi:10.5194/gmd-9-1937-2016.
- Fu, Y. H., and D. Guo. 2020. “Projection of the East Asian Westerly Jet under Six Global Warming Targets.” Atmospheric and Oceanic Science Letters 13 (2): 129–135. doi:10.1080/16742834.2020.1715199.
- He, C., and T. Zhou. 2015. “Responses of the Western North Pacific Subtropical High to Global Warming under RCP4.5 And RCP8.5 Scenarios Projected by 33 CMIP5 Models: The Dominance of Tropical Indian Ocean–Tropical Western Pacific SST Gradient.” Journal of Climate 28 (1): 365–380. doi:10.1175/JCLI-D-13-00494.1.
- Huang, D., J. Zhu, Y. Zhang, and A. Huang. 2013. “Uncertainties on the Simulated Summer Precipitation over Eastern China from the CMIP5 Models.” Journal of Geophysical Research–Atmospheres 118: 9035–9047. doi:10.1002/jgrd.50695.
- Kalnay, E., M. Kanamitsu, R. Kistler, W. Collins, D. Deaven, L. Gandin, M. Iredell, et al. 1996. “The NCEP/NCAR 40-year Reanalysis Project.” Bulletin of the American Meteorological Society 77: 437–470. doi:10.1175/1520-0477(1996)077<0437:tnyrp>2.0.CO;2.
- Lin, Z., and R. Lu. 2005. “Interannual Meridional Displacement of the East Asian Upper-tropospheric Jet Stream in Summer.” Advances in Atmospheric Sciences 22: 199–211. doi:10.1007/BF02918509.
- Lin, Z., Y. Fu, and R. Lu. 2019. “Intermodel Diversity in the Zonal Location of the Climatological East Asian Westerly Jet’s Core in Summer and Association with Rainfall over East Asia in CMIP5 Models.” Advances in Atmospheric Sciences 36 (6): 614–622. doi:10.1007/s00376-019-8221-z.
- Lu, R. 2004. “Associations among the Components of the East Asian Summer Monsoon System in the Meridional Direction.” Journal of the Meteorological Society of Japan 82 (1): 155–165. doi:10.2151/jmsj.82.155.
- Lu, R., and Y. Fu. 2010. “Intensification of East Asian Summer Rainfall Interannual Variability in the Twenty-first Century Simulated by 12 CMIP3 Coupled Models.” Journal of Climate 23: 3316–3331. doi:10.1175/2009JCLI3130.1.
- Ma, J., H. Xu, and P. Lin. 2015. “Meridional Position Biases of East Asian Subtropical Jet Stream in CMIP5 Models and Their Relationship with Ocean Model Resolutions.” International Journal of Climatology 35: 3942–3958. doi:10.1002/joc.4256.
- Song, F., and T. Zhou. 2013. “FGOALS-s2 Simulation of Upper-level Jet Streams over East Asia: Mean State Bias and Synoptic-scale Transient Eddy Activity.” Advances in Atmospheric Sciences 30 (3): 739–753. doi:10.1007/s00376-012-2212-7.
- Taylor, K. E. 2001. “Summarizing Multiple Aspects of Model Performance in a Single Diagram.” Journal of Geophysical Research–Atmospheres 106 (D7): 7183–7192. doi:10.1029/2000JD900719.
- Wu, T., Y. Lu, Y. Fang, X. Xin, L. Li, W. Li, W. Jie, et al. 2019. “The Beijing Climate Center Climate System Model (BCC-CSM): The Main Progress from CMIP5 to CMIP6.” Geoscientific Model Development 12: 1573–1600. doi:10.5194/gmd-12-1573-2019.
- Wyser, K., T. Noije, S. Yang, J. Hardenberg, D. O’Donnell, and R. Döscher. 2019. “On the Increased Climate Sensitivity in the EC-Earth Model from CMIP5 to CMIP6.” Geoscientific Model Development Discussions. doi:10.5194/gmd-2019-282.
- Xuan, S., Q. Zhang, and S. Sun. 2011. “Anomalous Midsummer Rainfall in Yangtze River-Huaihe River Valleys and Its Association with the East Asia Westerly Jet.” Advances in Atmospheric Sciences 28 (2): 387–397. doi:10.1007/s00376-010-0111-3.
- Zhang, Y., and L. Guo. 2005. “Relationship between the Simulated East Asian Westerly Jet Biases and Seasonal Evolution of Rainbelt over Eastern China.” Chinese Science Bulletin 50 (14): 1503–1508. https://doi.org/10.1360/982004-361.
- Zhao, Y., X. Yu, J. Yao, and X. Dong. 2018. “Evaluation of the Subtropical Westerly Jet and Its Effects on the Projected Summer Rainfall over Central Asia Using multi-CMIP5 Models.” International Journal of Climatology 38: 1176–1189. doi:10.1002/joc.5443.