
ABSTRACT
The High Resolution Model Intercomparison Project (HighResMIP) is a unique model intercomparison project in phase 6 of the Coupled Model Intercomparison Project (CMIP6), which is focused on the impact of horizontal resolutions. The outputs of the high- and low-resolution versions of CAS FGOALS-f3-H and CAS FGOALS-f3-L for the experiments of the HighResMIP simulations in CMIP6 are described in this paper. The models and their configurations, experimental settings, and post-processing methods are all introduced. CAS FGOALS-f3-H, with a 0.25° horizontal resolution, and CAS FGOALS-f3-L, with a 1° horizontal resolution, were forced by the standard external conditions, and two coordinated sets of simulations were conducted for 1950–2014 and 2015–50 with the Experiment IDs of ‘highresSST-present’ and ‘highresSST-future’, respectively. The model outputs contain multiple time scales including the required hourly mean, three-hourly mean, six-hourly transient, daily mean, and monthly mean datasets. It is reported that the 0.25° CAS FGOALS-f3-H successfully simulates some of the key challenges in climate modeling, including the average lifetime of tropical cyclones, particularly in the western parts of the northern Pacific Ocean, and the diurnal cycle of hourly precipitation. These datasets will contribute to the benchmarking of current models for CMIP, and studies of the impacts of horizontal resolutions on climate modeling issues.
GRAPHICAL ABSTRACT
摘要
高分辨率模式比较计划 (HighResMIP) 是CMIP6中新增的模式间比较计划, 旨在关注水平分辨率对气候模拟的影响。本文介绍了中国科学院大气物理研究所全球25km FGOALS-f3-H和100km FGOALS-f3-L模式的基本信息, 以及参与HighResMIP的试验设计, 强迫数据, 数据后处理方法等信息。水平分辨率25km的 FGOALS-f3-H模式和100km FGOALS-f3-L模式由标准外强迫场驱动, 且分别在1950–2014和2015–50时段进行两组协同试验, 试验编号分别为‘highresSST-present’ 及‘highresSST-future’。模拟和预估数据集包含多种输出频率: 1小时平均, 3小时平均, 6小时瞬时, 日平均和月平均等。评估结果表明: 水平分辨率的提高能够显著改进模式在热带气旋、日变化和极端降水的模拟性能。相较于全球100km低分辨率的FGOALS-f3-L, 全球25km的FGOALS-f3-H能够更好的刻画热带气旋的生命周期和全球降水的日变化主要特征, 特别是能够准确再现亚洲夏季风的降水日变化峰值时间。该数据集的发布将大大促进水平分辨率对气候模拟和预估影响的相关研究。
1. Introduction
With improvement in high-performance computing resources, high-resolution climate models are increasingly able to provide more sophisticated climate simulations. Phase 6 of the Coupled Model Intercomparison Project (CMIP6) (Eyring et al. Citation2016) includes a new model intercomparison project called the High Resolution Model Intercomparison Project (HighResMIP) (Haarsma et al. Citation2016). This intercomparison seeks to assess the impact of horizontal resolutions on regional and global climate simulations and multi-model projections. The horizontal resolution in HighResMIP is better than the typical resolutions of 1.5°–2.0° in CMIP5. A coordinated set of experiments was designed to evaluate the standard-resolution and high-horizontal-resolution atmospheric simulations. The HighResMIP experiments are divided into three tiers consisting of simulation and projection of the period 1950–2050. The aim of the HighResMIP simulation is to address the question: “What are the causes and consequences of climate system model deviations? (Haarsma et al. Citation2016).
The high-resolution and low-resolution (standard) versions of the Chinese Academy of Science FGOALS climate system model, CAS FGOALS-f3-H (FGOALS-f3-H for short) and CAS FGOALS-f3-L (FGOALS-f3-L for short) respectively, were developed at the State Key Laboratory of Numerical Modeling for Atmospheric Sciences and Geophysical Fluid Dynamics (LASG), Institute of Atmospheric Physics, Beijing, China (Bao et al. Citation2019; He et al. Citation2019; Li et al. Citation2019; Bao and Li Citation2020). The model completed the simulations of HighResMIP Tier 1 in early 2019, and finished the projection of HighResMIP Tier 3 in early 2020. The model outputs were released in their entirety on the Earth System Grid Federation maintained by LASG on 20 June 2020 (https://esgf-node.llnl.gov/search/cmip6/). The experimental methods, configuration, and model outputs of the model are documented in this paper for FGOALS-f3-H and FGOALS-f3-L. Section 2 provides an introduction to FGOALS-f3-H and FGOALS-f3-L. Section 3 describes the design of the coordinated set of experiments. Section 4 presents a technical evaluation of the model outputs from the FGOALS-f3-H and FGOALS-f3-L experiments. Finally, usage notes are provided in Section 5.
2. FGOALS-f3-H and FGOALS-f3-L
FGOALS-f3-H and FGOALS-f3-L are participating in HighResMIP of CMIP6. Both models have completed the Tier 1 and 3 experiments of HighResMIP. Tier 1 and 3 are to have an ensemble up to 2050 to benefit studies on the detection and attribution of changes in weather and seasonal climate extremes. In addition, integrations of Tier 3 also provide another potential way for decadal predictions. These two models have the same atmospheric and land components: FAMIL (Bao et al. Citation2019; He et al. Citation2019; Li et al. Citation2019; He et al. Citation2020) and CLM4. Regarding the Tier 1 and 3 experiments, the sea-ice and ocean components are data models. FGOALS-f3-H has a high horizontal resolution of 0.25° for the atmosphere and land grids, whereas FGOALS-f3-L has a standard horizontal resolution of 1°. Both FGOALS-f3-H and FGOALS-f3-L have 32 sigma-pressure hybrid vertical levels, with the uppermost level at 2.16 hPa. In accordance with HighResMIP, both FGOALS-f3-H and FGOALS-f3-L have exactly the same model physics processes. The only differences between the two model versions are the horizontal resolutions and time steps in the cubed-sphere dynamic core (Lin Citation2004; Zhou et al. Citation2015). Given that the details of the models have been well documented in the above references (Bao et al. Citation2019; He et al. Citation2019; Li et al. Citation2019), only the unique advantages of FGOALS-f3-H and FGOALS-f3-L are described here.
Firstly, a scale-awareness scheme for resolving convective precipitation (RCP) is used in the physics modules of both model versions (Bao and Li Citation2020), in which the convective and stratiform precipitation are explicitly calculated with the same parameters. Models that include RCP have outstanding performance in mitigating the long-standing problems of climate system models, such as the unrealistic doubling of the ITCZ and a weakened MJO (He et al. Citation2019, Citation2020; Guo et al. Citation2020). In addition, models that include RCP can provide seasonal predictions of the Niño3.4 index in the tropics (Bao et al. Citation2019) and the Arctic sea-ice concentrations in the high-latitude regions (Bhatt et al. Citation2020), which are used operationally in three national operation centers in real-time: the Beijing Climate Center, the National Marine Environmental Forecasting Center, and the Information Center of the Ministry of Water Resources.
3. Coordinated experiments
Following the design of the Tier 1 and Tier 3 experiments of HighResMIP (Haarsma et al. Citation2016), we conducted four groups of simulations (). Compared with the experiments of AMIP in CMIP6, the SST and sea-ice concentration (SIC) in HighResMIP are quite different. Instead of monthly mean SST and SIC in the coarse resolution, daily SST and SIC with a 0.25° resolution are obtained, such that the possible impacts from SST gradients associated with fronts and ocean eddies can be modeled. In addition, the other sources of external forcing are defined by their monthly mean observation values, as recommended by HighResMIP. Historical greenhouse gas concentrations, solar forcing, and ozone concentrations are from the main standard forcing parameters of CMIP6. Both FGOALS-f3-H and FGOALS-f3-L use the aerosol mass concentrations, which are prescribed and taken from CMIP5. The land forcing datasets are from the modes of ‘20 century transient’ for Tier 1 and ‘2000 control’ for Tier 3 in the land component. They include the datasets of urban land use, leaf area index, organic soil carbon, max fractional saturated area, soil color, soil texture, and plant functional type (Olesen et al. Citation2010).
Table 1. Experimental design
The experiment_id and variant_label are presented to identify each experiment and the corresponding outputs (). The characters in r1i1p1f1 denote the realization_index, initialization_index, physics_index, and forcing_index, respectively. There is only one ensemble number for all four groups of simulations for FGOALS-f3-H and FGOALS-f3-L.
4. Data quality
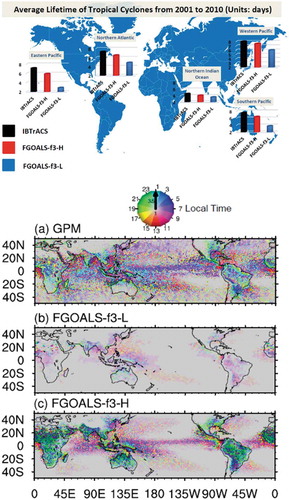
Simulation of synoptic-scale phenomenona and high-frequency variability remains a challenge for climate models. To address the main objective of HighResMIP, we investigated the impacts of the horizontal resolutions on simulations of tropical cyclones (TCs) using the model outputs. Most TCs that reach landfall typically have a longer duration, which causes substantial direct economic losses and threatens human life. shows the average lifetime of the TCs on a global scale, with the observed average lifetimes obtained from IBTrACS, version v03r09 (Knapp et al. Citation2010). The results show that, in the western North Pacific Ocean, which is the most active TC basin worldwide, TCs have an average lifetime of ~8 d. The average lifetime of TCs in the southern and eastern Pacific oceans is ~7.0 d, compared with only 4.3 d in the northern Indian Ocean. The simulated average lifetimes of the TCs were derived from the high- and low-resolution model results using an objective method (Li et al. Citation2019). Notably, the results showed there is an encouraging improvement for the higher-resolution model. Globally, the average lifetime of TCs increases by 35% from 4.9 d in FGOALS-f3-L to 6.6 d in FGOALS-f3-H. The average lifetimes of TC increase by 21% and 39% in the western North Pacific and the northern Atlantic, respectively, and the durations increase from 6.2 to 7.5 d and from 4.9 to 6.8 d, respectively. In the northern Indian Ocean, the simulated durations of TCs increases by 14% increased from 3.5 to 4.0 d. For ocean basins with weak TC activity, there is also a significant improvement in comparison between the high-resolution model and observations, with an increase in TC duration of 103% and 58% in the eastern and southern Pacific oceans, respectively. Therefore, results show that increasing the horizontal resolution leads to significantly improved simulations of the average lifetimes of TCs.
Figure 1. The average lifetimes of TCs in the global regions of the western Pacific, southern Pacific, northern Indian Ocean, northern Atlantic, and eastern Pacific, from 2001 to 2010, in units of days. IBTrACS, version v03r09, is used as the observation (black bars). The average lifetimes of TCs in the 0.25° FGOALS-f3-H and 1° FGOALS-f3-L are shown as red and blue bars, respectively

The diurnal variation associated with the hourly precipitation in climate models is another fundamental variable in climate modeling that exhibits distinct regional features. We firstly evaluated the annual-mean simulations of the diurnal variation over the tropics and midlatitude regions (40°S–40°N), with the hourly outputs from HighResMIP Tier1 r1i1p1f1 of FGOALS-f3-H and FGOALS-f3-L. The Global Precipitation Measurement (GPM) mission was used for the reference precipitation observations (Skofronick-Jackson et al. Citation2017), which are available hourly and at a spatial resolution of 0.1° × 0.1°. The GPM data were interpolated from 0.1° to 1°, to match the model. Over most land regions, both FGOALS-f3-H and FGOALS-f3-L models show a nocturnal peak, which is consistent with the results from GPM (). However, a previous study reported that most models tend to predict rain too early, at around noon (Dai Citation2006). Over the tropical oceans, the diurnal peak precipitation phase obtained from both FGOALS-f3-H and FGOALS-f3-L is in the early morning, around sunrise, which is also similar to the GPM observations. Therefore, both FGOALS-f3-H and FGOALS-f3-L provide reasonable timings for the peak phase of hourly precipitation. With respect to the amplitude of the diurnal cycle associated with the hourly precipitation, FGOALS-f3-H shows a significant improvement in terms of the hourly precipitation over both land and oceans. The amplitude of hourly precipitation can be 3.5 mm h−1 in terms of hourly mean results, which is consistent with GPM observations. This suggests that increasing the horizontal resolution of the model improves simulations of the hourly precipitation, whereas it has little effect on simulations of diurnal precipitation on a global scale. These conclusions are consistent with those of a previous study using other models (Xie et al. Citation2019), which showed the higher resolution leads to more precipitation being resolved as grid-scale precipitation.
Figure 2. Annual mean timing phase (color) and amplitude (color density) of the total precipitation (units: mm h−1) in the tropics and midlatitudes from seven years of hourly averaged data for (a) GPM, (b) 1° FGOALS-f3-L highresSST-present r1i1p1f1, and (c) 0.25° FGOALS-f3-H highresSST-present r1i1p1f1. GPM, FGOALS-f3-L, and FGOALS-f3-H are from 2008–14. In this figure, GPM and FGOALS-f3-H are interpolated to 1°, the same as the resolution of FGOALS-f3-L. The domain is the tropical and midlatitude region (50°S–50°N)

During boreal summer, the diurnal variation in precipitation associated with the Asian Summer Monsoon (ASM) shows unique regional features because of the stronger air–sea–land interactions and the complex topographic thermal and dynamic forcing, which modulate the monsoon flow on the multiple time-scales (Yu et al. Citation2007). The boreal summer diurnal cycle of precipitation from GPM products ()) in the middle–lower reaches of the Yangtze River shows an early morning peak, which has some similarities with equatorial ocean regions, whereas the diurnal cycle of the precipitation in Southwest China (downstream of the Tibetan Plateau) shows a nocturnal peak phase that is similar to most continental midlatitude areas. FGOALS-f3-H ()) simulates these morning and evening peaks, whereas FGOALS-f3-L ()) shows mainly the peaks around sunset for both regions. Over southern Asia and the Indochina Peninsula, the diurnal cyclone of precipitation from FGOALS-f3-H shows a near uniform nocturnal peak similar to GPM observations, which represents an improvement in model performance as compared with FGOALS-f3-L. According to GPM observations, it should also be noted that the intensity of the hourly precipitation during boreal summer from FGOALS-f3-H is more accurate than that from FGOALS-f3-L. This suggests that the model biases exhibited by FGOALS-f3-L (i.e. the peak phase and weakened intensity) have been significantly reduced in FGOALS-f3-H on a regional scale for the ASM.
Figure 3. The boreal summer mean timing phase (color) and amplitude (color density) of the total precipitation (units: mm h−1) in the Asian regions from seven years of hourly averaged data for (a) GPM, (b) 1° FGOALS-f3-L highresSST-present r1i1p1f1, and (c) 0.25° FGOALS-f3-H highresSST-present r1i1p1f1. GPM, FGOALS-f3-L, and FGOALS-f3-H are from 2008–14. In this figure, GPM and FGOALS-f3-H are interpolated to 1°, the same as the resolution of FGOALS-f3-L. The thick black lines mask the elevation of 2000 m

5. Usage notes
The original atmospheric model grids are in the cube-sphere grid system with a resolution of C384 for FGOALS-f3-H and C96 for FGOALS-f3-L. There are six tiles in the cube-sphere grid system and it is irregular in the horizontal direction. We merge and interpolate the tiles to nominal resolutions of 0.25° for FGOALS-f3-H and 1° for FGOALS-f3-L on the standard global latitude–longitude grids scaled by one-order conservation interpolation for public use as required by CMIP6. The format of datasets is NetCDF (https://www.unidata.ucar.edu/software/netcdf/workshops/2012/third_party/CDO.html), and the post-processing is done by the NetCDF Operator (http://nco.sourceforge.net), NCAR Command Language (http://www.ncl.ucar.edu), and Python (https://www.python.org).
The descriptions of the output variables follow the standards of CMIP6 requirements (http://clipc-services.ceda.ac.uk/dreq/tab01_3_3.html).
Data availability statement
The data that support the findings of this study are available from the following sources: https://esgf-node.llnl.gov/projects/cmip6/.
Disclosure statement
No potential conflict of interest was reported by the authors.
Additional information
Funding
References
- Bao, Q., and J. Li. 2020. “Progress in Climate Modeling of Precipitation over the Tibetan Plateau.” National Science Review. 7(3): 486–487. doi:10.1093/nsr/nwaa006.
- Bao, Q., X. F. Wu, J. X. Li, L. Wang, B. He, X. C. Wang, Y. M. Liu, and G. X. Wu. 2019. “Outlook for El Nino and the Indian Ocean Dipole in Autumn-winter 2018–2019.” Chinese Science Bulletin (In Chinese) 64 (1): 73–78. doi:10.1360/N972018-00913.
- Bhatt, U. S., P. Bieniek, C. Bitz, E. Blanchard-Wrigglesworth, H. Eicken, H. Goessling, L. C. Hamilton, et al. 2020. “2019 Sea Ice Outlook Full Post-Season Report.” February.
- Dai, A. 2006. “Precipitation Characteristics in Eighteen Coupled Climate Models.” Journal of Climate 19 (18): 4605–4630. doi:10.1175/JCLI3884.1.
- Eyring, V., S. Bony, G. A. Meehl, C. A. Senior, B. Stevens, R. J. Stouffer, and K. E. Taylor. 2016. “Overview of the Coupled Model Intercomparison Project Phase 6 (CMIP6) Experimental Design and Organization.” Geoscientific Model Development 9: 1937–1958. doi:10.5194/gmd-9-1937-2016.
- Guo, Y., Y. Q. Yu, P. F. Lin, H. L. Liu, B. He, Q. Bao, B. An, S. W. Zhao, and L. J. Hua. 2020. “Simulation and Improvements of Oceanic Circulation and Sea Ice by a Coupled Climate System Model FGOALS-f3- L.” Advances in Atmospheric Sciences. ( in press). doi:10.1007/s00376-020-0006-x.
- Haarsma, R. J., M. J. Roberts, P. L. Vidale, C. A. Senior, A. Bellucci, Q. Bao, P. Chang, et al. 2016. “High Resolution Model Intercomparison Project (Highresmip V1.0) For CMIP6.” Geoscientific Model Development 9 (11): 4185–4208. doi:10.5194/gmd‐9‐4185‐2016.
- He, B., Q. Bao, X. C. Wang, L. J. Zhou, X. F. Wu, Y. M. Liu, G. X. Wu, et al. 2019. “CAS FGOALS-f3-L Model Datasets for CMIP6 Historical Atmospheric Model Intercomparison Project Simulation.” Advances in Atmospheric Sciences 36 (8): 771–778. doi:10.1007/s00376-019-9027-8.
- He, B., Y. Q. Yu, Q. Bao, P. F. Lin, H. L. Liu, J. X. Li, L. Wang, et al. 2020. “CAS FGOALS-f3-L Model Datasets Descriptions for CMIP6 DECK Experiments.”Atmospheric and Oceanic Science Letters. 13(6). doi:10.1080/16742834.2020.1778419.
- Knapp, K. R., M. C. Kruk, D. H. Levinson, H. Diamond, and C. J. Neumann. 2010. “The International Best Track Archive for Climate Stewardship (Ibtracs) Unifying Tropical Cyclone Data.” Bulletin of the American Meteorological Society 91 (3): 363–376. doi:10.1175/2009BAMS2755.1.
- Li, J., Q. Bao, Y. M. Liu, G. X. Wu, L. Wang, B. He, X. C. Wang, and J. D. Li. 2019. “Evaluation of FAMIL2 in Simulating the Climatology and Seasonal-to-interannual Variability of Tropical Cyclone Characteristics.” Journal of Advances in Modeling Earth Systems 11 (4): 1117–1136. doi:10.1029/2018MS001506.
- Lin, S. J. 2004. “A Vertically Lagrangian” Finite-volume Dynamical Core for Global Models.” Monthly Weather Review 132 (10): 2293–2307. doi:10.1175/1520-0493(2004)132<2293:AVLFDC>2.0.CO;2.
- Oleson, K. W., D. M. Lawrence, G. B. Mark, B. Gordon, M. G. Flanner, K. Erik, L. Samuel, et al. 2010. “Technical Description of Version 4.0 Of the Community Land Model (CLM)”. NCAR/TN–461 + STR, 173.
- Skofronick-Jackson, G., W. A. Petersen, W. Berg, C. Kidd, E. F. Stocker, D. B. Kirschbaum, R. Kakar, et al. 2017. “The Global Precipitation Measurement (GPM) Mission for Science and Society.” Bulletin of the American Meteorological Society 98: 1679–1695. doi:10.1175/BAMS-D-15-00306.1.
- Xie, S., Y. C. Wang, W. Y. Lin, H. Y. Ma, Q. Tang, S. Q. Tang, X. Zheng, J. C. Golaz, G. J. Zhang, and M. H. Zhang. 2019. “Improved Diurnal Cycle of Precipitation in E3SM with a Revised Convective Triggering Function.” Journal of Advances in Modeling Earth Systems 11: 2290–2310. doi:10.1029/2019MS001702.
- Yu, R., Y. P. Xu, T. J. Zhou, and J. Li. 2007. “Relation between Rainfall Duration and Diurnal Variation in the Warm Season Precipitation over Central Eastern China.” Geophysical Research Letter 34 (13): L13703. doi:10.1029/2007GL030315.
- Zhou, L., Q. Bao, Y. M. Liu, G. Wu, W. C.- Wang, X. C. Wang, B. He, H. Y. Yu, and J. D. Li. 2015. “Global Energy and Water Balance: Characteristics from Finite-volume Atmospheric Model of the IAP/LASG (FAMIL1).” Journal of Advances in Modeling Earth Systems 7 (1): 1–20. doi:10.1002/2014ms000349.