
ABSTRACT
The spatiotemporal features of carbon and nitrogen fluxes over China between 1979 and 2015 were simulated by the Atmosphere–Vegetation Interaction Model (AVIM). The carbon fluxes of gross primary production and net primary production captured the distribution pattern in China better than MODIS and TRENDY data. The results for nitrogen deposition and biological nitrogen fixation show the good performance of the AVIM simulation compared with the CMIP6 and CABLE data, with a deposition rate >4 g N m−2 yr−1 in south China. The variation in the gross primary production and net primary production can be up to 300 and 200 g C m−2 yr−1 in south and southeast China, respectively, and there is a discrepancy between the AVIM and the data from MODIS and TRENDY. This shows the difficulty in simulating the carbon flux in a monsoon climate region and the importance of coupling the nitrogen–carbon fluxes. The standard deviation of nitrogen deposition and biological nitrogen fixation is simulated well by the AVIM and there is a large range in nitrogen deposition of 0.8–1.2 g N m−2 yr−1 in south China. The climatological mean of the fluxes performs better than the variation in the standard deviation and anomaly and this variation in the carbon–nitrogen flux is the key to decreasing bias in future modeling studies.
Graphical abstract
摘要
在陆面模式AVIM中模拟了1979–2015年中国碳氮通量的时空特征, 碳通量GPP和NPP的模拟优于MODIS和TRENDY资料的结果。与CMIP6和CABLE模式的结果相比, AVIM对氮沉降和生物固氮模拟效果良好, 在中国南部地区大于4 g N m−2 yr−1。模拟GPP和NPP在中国南方地区变化可达300和200 g C m−2 yr−1, 这与MODIS和TRENDY结果有差异, 反映了季风区碳氮耦合的难度和必要性。中国南部氮沉降和生物固氮标准差可达0.8–1.2 g N m−2 yr−1, 距平和标准差评估是减小碳氮通量模拟偏差的关键。
1. Introduction
The carbon cycle is source of uncertainty in climate simulation and projection models (IPCC Citation2013). It is therefore important to quantify accurately the magnitude and variation of carbon fluxes in regions with a complex climate and topography, such as China, which is affected by strong interactions between ecosystems and the monsoon climate (Fu et al. Citation2002; Dan, Cao, and Gao Citation2015). However, it is difficult to reproduce accurately the flux of carbon and nitrogen in China as a result of a lack of global- and regional-scale observations of the nitrogen cycle and the complex climate–vegetation system. Almost none of the models in the Fifth Assessment Report of the Intergovernmental Panel on Climate Change include the nitrogen cycle and the mechanism of carbon–nitrogen interactions is still not clearly understood (Yu and Piao Citation2014). Peng and Dan (Citation2015) and Peng et al. (Citation2018) showed that nitrogen can limit the carbon cycle in Earth systems models and that the carbon flux is smaller and varies less if it is coupled with nitrogen.
The carbon fluxes in gross primary production (GPP) and net primary production (NPP) have been studied over several decades (Ji Citation1995; Foley et al. Citation1998; Cox et al. Citation2000; Ji, Huang, and Li Citation2008; Dan and Ji Citation2007; Mao et al. Citation2010) and there are large uncertainties in different models and the estimated data for China (Shao et al. Citation2016). China has experienced enhanced nitrogen deposition (NDEP) over the last 30 years and is the world’s largest consumer of nitrogen fertilizer (Wang, Lin, and Li Citation2016). China, Europe, and North America are currently the regions with the highest NDEP (Galloway et al. Citation2008). NDEP is a serious climate–environmental problem in China and we need to study the carbon–nitrogen cycle under the dynamic framework of a single model (Yu et al. Citation2013).
This study couples the nitrogen cycle and carbon processes into the Atmosphere–Vegetation Interaction Model (AVIM) land surface model based on the work of Yang et al. (Citation2019) with the aim of improving the accuracy of the carbon flux simulation with reasonable nitrogen dynamics and to increase our understanding of the variations in the carbon–nitrogen flux in the monsoon region of China. This work establishes a high-quality benchmark for the carbon–nitrogen flux in future simulations by the AVIM.
2. Model, data, and experiments
The AVIM was one of the earliest land surface models to consider dynamic vegetation processes (Ji Citation1995). It has been validated in different ecosystem types at site (Ji Citation1995; Lu and Ji Citation2006), regional (Dan, Ji, and He Citation2007; Ji, Huang, and Li Citation2008), and global scales (Dan, Ji, and Li Citation2005; Dan and Ji Citation2007). The model was used in the Ecosystem Model and Data Intercomparison initiated by the International Geosphere–Biosphere Programme and showed the best performance in the simulation of NPP (Dan, Ji, and He Citation2007).
This study used a model run from 1979 to 2015 with hourly time steps. The atmospheric forcing included air temperature, precipitation, specific humidity, wind field, surface air pressure, and short- and longwave radiation released by the Institute of Tibetan Plateau Research, Chinese Academy of Sciences (Yang et al. Citation2010). The spatial resolution was 10 km. The carbon flux data used to validate the AVIM included satellite data from the Moderate-resolution Imaging Spectroradiometer (MODIS) and GPP, NPP, and TRENDY data from nine global models () produced by Le Quere et al. (Citation2013). The MODIS GPP and NPP data were provided by Zhao et al. (Citation2005) and have been used previously with good reliability for the validation of the carbon flux in China (Dan, Ji, and He Citation2007; Lin et al. Citation2019). The nitrogen data of NDEP estimated by Lu and Tian (Citation2014), the biological nitrogen fixation (BNF) simulated by CABLE (Lu et al. Citation2013; Peng et al. Citation2018), and the forcing data of NDEP from the Coupled Model Intercomparison Project Phase 6 (CMIP6) were used to validate the AVIM. The BNF is simulated in the NPP function of the AVIM as Nfix = 1.8(1− exp(−0.003NPP)), which was used in previously reported work (Cleveland et al. Citation1999; Thornton et al. Citation2007; Wieder et al. Citation2015).
Table 1. The model information of TRENDY data of carbon fluxes
3. Results
3.1 Carbon flux simulations
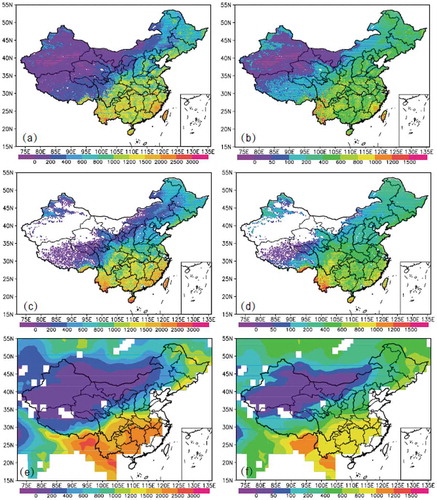
shows the GPP and NPP for the simulations in China. The simulated GPP of the AVIM ()) is >2000 g C m−2 yr−1 to the south of 30°N and can be up to 2500–3000 g C m−2 yr−1 in southern China, including Fujian, Taiwan, Hainan, and Yunnan, which agrees well with the MODIS GPP data ()). The GPP ranges from 800 to 1200 g C m−2 yr−1 in northeast China and is <600 g C m−2 yr−1 in western China, with a change in gradient from north to south.
Figure 1. Multi-year carbon flux over China. (a) Gross primary production (GPP) from the AVIM; (b) net primary production (NPP) from the AVIM; (c) GPP from the MODIS data; (d) NPP from the MODIS data; (e) GPP from the TRENDY data; (f) NPP from the TRENDY data. Units: g C m−2 yr−1. AVIM and MODIS data averaged for the time period 2000–15; TRENDY data averaged for the time period 2000–10

To show the ability of the model to capture the carbon flux, the ensemble GPP from the seven TRENDY global models ()) was compared with the AVIM simulation. The TRENDY data generally show a higher GPP, with an overestimate >500 g C m−2 yr−1 in south China and 200 g C m−2 yr−1 in northeast China. This reflects the limiting effect of nitrogen on the carbon flux in China, because the major difference between the AVIM and TRENDY data is the nitrogen dynamics, which shows the importance of incorporating the nitrogen cycle in land surface models for the simulation of the carbon flux in China.
The simulated value of the NPP is about half that of the GPP and this proportion is captured by the AVIM ()), MODIS ()), and TRENDY models ()). The NPP shows the largest flux of up to 1500 g C m−2 yr−1 in Fujian, Taiwan, and Yunnan in southern China, as well as in the southeast of the Tibetan Plateau. The TRENDY data show a higher estimation to the south of 30°N and in the forests of northeast China.
To explore the variation in the carbon flux, we used the standard deviation of the annual mean outputs to show the dispersion of the GPP and NPP (). The AVIM gave a standard deviation of the GPP ()) >100 g C m−2 yr−1 to the south of 30°N and a maximum of up to 300 g C m−2 yr−1 in the mid- to lower reaches of the Yangtze river basin and in Taiwan, Hainan, and Yunnan provinces to the southeast of the Tibetan Plateau. By contrast, the MODIS GPP standard deviation was generally <100 g C m−2 yr−1 in south China with a maximum <150 g C m−2 yr−1 ()). The simulated standard deviation of the GPP in northeast China was also higher than in the MODIS data. The standard deviation of the ensemble GPP of the TRENDY data ()) generally showed a higher value across east China and the standard deviation was 250–300 g C m−2 yr−1 in south and northeast China. This discrepancy shows the difficulty in capturing the variations of the carbon flux in China where the monsoon climate is dominant, leading to complexities in the simulation of the ecosystem. The standard deviation of the NPP also showed a similar difference in south and northeast China (). The AVIM simulated a larger standard deviation of the NPP than the MODIS data and a smaller standard deviation than the TRENDY data, which again shows how nitrogen limits the variation in the carbon flux.
Figure 2. Multi-year standard deviation of the carbon flux over China. (a) Gross primary production (GPP) from the AVIM; (b) net primary production (NPP) from the AVIM; (c) GPP from the MODIS data; (d) NPP from the MODIS data; (e) GPP from the TRENDY data; (f) NPP from the TRENDY data. Units: g C m−2 yr−1. AVIM and MODIS data averaged for the time period 2000–15; TRENDY data averaged for the time period 2000–10

3.2 Nitrogen flux simulations
The nitrogen flux simulation was assessed by the rate of the total NDEP and BNF. shows the NDEP in the AVIM ()), the estimated NDEP data combined with observations from Lu and Tian (Citation2014) ()) and depositional data from CMIP6 ()). The simulated NDEP from the AVIM revealed a decrease in gradient from south to north over eastern China, with a rate >4 g N m−2 yr−1 in south China. The rate of NDEP was between 1 and 2 g N m−2 yr−1 in northeast China. This distribution is close to the pattern of the data reported by Lu and Tian (Citation2014), although the simulation for the North China Plain was lower than that reported by Lu and Tian (Citation2014). As a result of a lack of observation data at the regional scale, we validated the NDEP using forcing data from CMIP6. These data gave a high rate of 2.5 g N m−2 yr−1 centered around north China, which is lower than the AVIM and Lu and Tian (Citation2014) data for eastern China. The BNF is a key variable used to depict the nitrogen cycle of terrestrial ecosystems. The AVIM simulated the largest rate of nitrogen fixation of >4 g N m−2 yr−1 in Fujian, Taiwan, and southwest China. The BNF in northeast China was 1.5–3 g N m−2 yr−1. We were unable to obtain a global or regional observed BNF and therefore the simulation of the BNF from the CABLE model ()) was chosen for comparison with the AVIM. The CABLE data also showed the larger BNF in south China of 2.5–3.5 g N m−2 yr−1, which was lower than the BNF simulated by the AVIM.
Figure 3. Multi-year nitrogen flux over China. (a) Nitrogen deposition (NDEP) from the AVIM; (b) biological nitrogen fixation (BNF) from the AVIM; (c) NDEP estimated by Lu and Tian (Citation2014); (d) BNF from the CABLE model; (e) NDEP from the CMIP6 data. Units: g N m−2 yr−1. The AVIM and CABLE are averaged for the time period 1979–2015, the Lu and Tian (Citation2014) data for the time period 1979–2005 and the CMIP6 data for the time period 1979–2014

shows the standard deviation of the annual mean NDEP and BNF of the AVIM, the Lu and Tian (Citation2014) data, the CMIP6 NDEP and the CABLE BNF data. The AVIM captured a larger NDEP >0.8 g N m−2 yr−1 in southern China, which was also reflected in the Lu and Tian (Citation2014) data, although with a slight lower value. The standard deviation of the CMIP6 NDEP ()) had the same magnitude as that in the AVIM and the Lu and Tian (Citation2014) data, but the pattern shifted northward to north China and showed a large variation in deposition in northeast China. The largest rate of the BNF of 0.8–1 g N m−2 yr−1 occurred in Fujian province and southwest China in the AVIM ()). The BNF was similar in the CABLE simulation ()), with a slightly lower BNF in north and northeast China.
Figure 4. Standard deviation of the multi-year nitrogen flux over China. (a) Nitrogen deposition (NDEP) from the AVIM; (b) biological nitrogen fixation (BNF) from the AVIM; (c) NDEP estimated by Lu and Tian (Citation2014); (d) BNF from the CABLE model; (e) NDEP from the CMIP6 data. Units: g N m−2 yr−1. The AVIM and CABLE are averaged for the time period 1979–2015, the Lu and Tian (Citation2014) data for the time period 1979–2005 and the CMIP6 data for the time period 1979–2014

shows the anomaly in the fluxes after the removal of the climatological mean impact (Jones and Hulme Citation1996). The AVIM showed a reasonable variation trend of the carbon and nitrogen fluxes, except for the lower anomaly in the GPP from 1979 to 2005 and the BNF from 1979 to 2003. The nitrogen flux trend showed a larger variation than the GPP and NPP anomalies and the deposition of Lu and Tian (Citation2014) showed a sharper increase than the other data.
Figure 5. Area-averaged anomaly of the annual carbon flux and nitrogen flux over China during the time period 1979–2015. (a) Carbon flux anomaly; units: g C m−2 yr−1. (b) Nitrogen flux anomaly; units: g N m−2 yr−1. Black bars are the standard error of each variation in flux

4. Discussion and conclusions
Nitrogen dynamics were coupled into the latest version of the AVIM land surface model and the carbon and nitrogen fluxes simulated at the regional scale reflect the good performance of the AVIM compared with the data from MODIS, TRENDY, the CABLE BNF, and the CMIP6. The simulated GPP and NPP of the AVIM were lower than the TRENDY carbon flux without detailed nitrogen dynamics and were closer to the satellite data of MODIS. This shows the need to couple nitrogen dynamics to better capture the variation of carbon fluxes in China to decrease uncertainties (Mao et al. Citation2010; Shao et al. Citation2016).
The nitrogen fluxes of deposition and fixation were also simulated well in the AVIM, providing useful tools to study carbon–nitrogen feedbacks in China and a potential baseline for carbon–nitrogen fluxes in future simulations in the regional vegetation–climate coupled model of the Weather Research and Forecasting Model with the AVIM. The carbon–nitrogen flux is clearly understood in the current climatological state (Dan, Cao, and Gao Citation2015; Peng et al. Citation2018), but the variation is complex and needs more detailed validation with observational data.
The variation amplitude of the TRENDY carbon fluxes was larger than that of the AVIM and MODIS data, which was also seen for the carbon flux of the CMIP5 models (Gao et al. Citation2020). This accounts for the present performance of the carbon flux simulation in land surface models. The use of coupled carbon–nitrogen fluxes in climate models will be a new direction for the study of land–air interactions.
Disclosure statement
No potential conflict of interest was reported by the authors.
Additional information
Funding
References
- Cleveland, C. C., A. R. Townsend, D. S. Schimel, H. Fisher, R. W. Howarth, L. O. Hedin, S. S. Perakis, et al. 1999. “Global Patterns of Terrestrial Biological Nitrogen (N2) Fixation in Natural Ecosystems.” Global Biogeochemical Cycles 13 (2): 623–645. doi:10.1029/1999GB900014.
- Cox, P. M., R. A. Betts, C. D. Jones, S. A. Spall, and L. J. Totterdell. 2000. “Acceleration of Global Warming Due to Carbon-cycle Feedbacks in a Coupled Climate Model.” Nature 408: 184–187.
- Dan, L., F. Q. Cao, and R. Gao. 2015. “The Improvement of A Regional Climate Model by Coupling A Land Surface Model with Eco-physiological Processes: A Case Study in 1998.” Climatic Change 129 (3–4): 457–470. doi:10.1007/s10584-013-0997-8.
- Dan, L., and J. J. Ji. 2007. “The Surface Energy, Water, Carbon Flux and Their Intercorrelated Seasonality in a Global Climate-vegetation Coupled Model.” Tellus B 59: 425–438. doi:10.1111/j.1600-0889.2007.00274.x.
- Dan, L., J. J. Ji, and Y. He. 2007. “Use of ISLSCP II Data to Intercompare and Validate the Terrestrial Net Primary Production in a Land Surface Model Coupled to a General Circulation Model.” Journal of Geophysical Research 112: D02S90. doi:10.1029/2006JD007721.
- Dan, L., J. J. Ji, and Y. Li. 2005. “Climatic and Biological Simulations in a Two-way Coupled Atmosphere-biosphere Model (CABM).” Global and Planetary Change 47: 153–169.
- Foley, J. A., S. Levis, I. C. Prentice, D. Pollard, and S. L. Thompson. 1998. “Coupling Dynamical Models of Climate and Vegetation.” Global Change Biology 4: 561–579.
- Fu, C. B., G. Wen, L. Xie, M. S. Zhao, and H. L. Yuan. 2002. “The Diagnosis and Simulation Studies on Climate and Ecosystem Interactions in East Asia Monsoon Region.” Journal of Nanjing University (Natural Sciences) 38: 281–294 (In Chinese).
- Galloway J. N., A. R. Townsend, J. W. Erisman, M. Bekunda, Z. Cai, J. R. Freney, L. A. Martinelli, S. P. Seitzinger, and M. A. Sutton. 2008. “Transformation of the nitrogen cycle: Recent trends, questions, and potential solutions.” Science 320 (5878): 889–892.
- Gao, D. D., L. Dan, G. Z. Fan, H. Q. Tian, J. Peng, X. J. Yang, F. Q. Yang, and Y. Y. Li. 2020. “Spatiotemporal Variations of Carbon Flux and Nitrogen Deposition Flux Linked with Climate Change at the Centennial Scale in China.” Science China-Earth Sciences63: 731–748. doi:10.1007/s11430-018-9548-3.
- IPCC (Intergovernmental Panel on Climate Change). 2013. “Climate Change 2013: The Physical Science Basis.” In Contribution of Working Group I to the Fifth Assessment Report of the Intergovernmental Panel on Climate Change, edited by T. F. Stocker, D. Qin, G. K. Plattner, M. Tignor, S. K. Allen, J. Boschung, A. Nauels, Y. Xia, V. Bex, and P. M. Midgley. Cambridge University Press, Cambridge, United Kingdom and New York, USA, 1535 pp.
- Ji, J. J. 1995. “A Climate-vegetation Interaction Model: Simulating Physical and Biological Processes at the Surface.” Journal of Biogeography 22: 445–451.
- Ji, J. J., M. Huang, and K. R. Li. 2008. “Prediction of Carbon Exchanges between China Terrestrial Ecosystem and Atmosphere in 21st Century.” Science in China Series D: Earth Sciences 51 (6): 885–898. doi:10.1007/s11430-008-0039-y.
- Jones, P. D., and M. Hulme. 1996. “Calculating Regoinal Climatic Time Series for Temperature and Precipitation: methods and Illusions.” International Journal of Climatology 16 (4): 361–377.
- Le Quere, C., R. J. Andres, T. Boden, T. Conway, R. A. Houghton, J. I. House, G. Marland et al. 2013. “The Global Carbon Budget 1959-2011.” Earth System Science Data 5: 165–185.
- Lin, S., G. X. Wang, J. M. Feng, L. Dan, X. Y. Sun, Z. Y. Hu, X. P. Chen, and X. Xiao. 2019. “A Carbon Flux Assessment Driven by Environmental Factors over the Tibetan Plateau and Various Permafrost Regions.” Journal of Geophysical Research: Biogeosciences 124 (5): 1132–1147. doi:10.1029/2018JG004789.
- Lu, C. Q., and H. Q. Tian. 2014. “Half-Century Nitrogen Deposition Increase across China: A Gridded Time-Series Data Set for Regional Environmental Assessments.” Atmospheric Environment 97: 68–74. doi:10.1016/j.atmosenv.2014.07.061.
- Lu, J. H., and J. J. Ji. 2006. “A Simulation and Mechanism Analysis of Long-term Variations at Land Surface over Arid/semi-arid Area in North China.” Journal of Geophysical Research 111: D09306. doi:10.1029/2005JD006252.
- Lu, X. J., Y. P. Wang, T. Ziehn, and Y. J. Dai. 2013. “An Efficient Method for Global Parameter Sensitivity Analysis and Its Applications to the Australian Community Land Surface Model (CABLE).” Agricultural and Forest Meteorology 182-183 (15): 292–303.
- Mao, J. F., L. Dan, B. Wang, and Y. J. Dai. 2010. “Simulation and Evaluation of Terrestrial Ecosystem NPP with M-SDGVM over Continental China.” Advances in Atmospheric Sciences 27: 427–442.
- Peng, J., and L. Dan. 2015. “Impacts of CO2 Concentration and Climate Change on the Terrestrial Carbon Flux Using Six Global Climate-carbon Coupled Models.” Ecological Modelling 304: 69–83. doi:10.1016/j.ecolmodel.2015.02.016.
- Peng, J., L. Dan, Y. P. Wang, X. B. Tang, X. J. Yang, F. Q. Yang, X. J. Lu, and B. Pak. 2018. “Role Contribution of Biological Nitrogen Fixation to Future Terrestrial Net Land Carbon Accumulation under Warming Condition at Centennial Scale.” Journal of Cleaner Production 202: 1158–1166.
- Shao, J. J., X. H. Zhou, Y. Q. Luo, G. D. Zhang, W. Yan, J. X. Li, B. Li, et al. 2016. “Uncertainty Analysis of Terrestrial Net Primary Productivity and Net Biome Productivity in China during 1901–2005.” JGR-Biogeosciences 121 (5): 1372–1393.
- Thornton, P. E., J. F. Lamarque, N. A. Rosenbloom, and N. M. Mahowald. 2007. “Influence of Carbon‐nitrogen Cycle Coupling on Land Model Response to CO2 Fertilization and Climate Variability.” Global Biogeochemical Cycles 21: GB4018. doi:10.1029/2006GB002868.
- Wang, J. G., S. Lin, and B. G. Li. 2016. “Nitrogen Cycling and Management Strategies in Chinese Agriculture.” Scientia Agricultura Sinica 49 (3): 503–517.
- Wieder, W. R., C. C. Cleveland, D. M. Lawrence, and G. B. Bonan. 2015. “Effects of Model Structural Uncertainty on Carbon Cycle Projections: Biological Nitrogen Fixation as a Case Study.” Environmental Research Letters 10 (4): 044016.
- Yang, K., J. He, W. J. Tang, J. Qin, and C. C. K. Cheng. 2010. “On Downward Shortwave and Longwave Radiations over High Altitude Regions: Observation and Modeling in the Tibetan Plateau.” Agricultural and Forest Meteorology 150 (1): 38–46.
- Yang, X. J., L. Dan, F. Q. Yang, J. Peng, Y. Y. Li, D. D. Gao, J. J. Ji, and M. Huang. 2019. “The Integration of Nitrogen Dynamics into a Land Surface Model. Part 1: Model Description and Site-scale Validation.” Atmospheric and Oceanic Science Letters 12 (1): 50–57.
- Yu, G. R., Y. Gao, Q. F. Wang, S. R. Liu, and W. J. Shen. 2013. “Discussion on the Key Processes of Carbon-nitrogen-water Coupling Cycles and Biological Regulation Mechanisms in Terrestrial Ecosystem.” Chinese Journal of Eco-Agriculture 21 (1): 1–13 (In Chinese).
- Yu, L., and S. L. Piao. 2014. “Key Scientific Points on Carbon and Other Biogeochemical Cycles from the IPCC Fifth Assessment Report.” Climate Change Research 10 (1): 33–36 (In Chinese).
- Zhao, M., F. A. Heinsch, R. R. Nemani, and S. W. Running. 2005. “Improvements of the MODIS Terrestrial Gross and Net Primary Production Global Data Set.” Remote Sensing of Environment 95 (2): 164–176.