
 ?Mathematical formulae have been encoded as MathML and are displayed in this HTML version using MathJax in order to improve their display. Uncheck the box to turn MathJax off. This feature requires Javascript. Click on a formula to zoom.
Abstract
Transverse Liquid Composite Moulding (LCM) processes for the impregnation of thick parts have been gaining interest recently. Simulations of transverse LCM processes require accurate input of constitutive data to make useful predictions; however, accurate constitutive data are not always available and the magnitudes of deviations due to interpolation and extrapolation errors are not entirely known. The international out-of-plane compressibility and permeability benchmark exercises have shown large variations in both quantities, for each participant, and between different participants. In this work, a simulation model of transverse impregnation and compression for LCM processes is utilised to study the sensitivity of processing predictions to variations in constitutive data resulting from different fitting techniques. It is shown through a case study on saturated permeability measurements that significantly different predictions of the flow rate during permeability measurements arise from relatively small differences in the constitutive data. This study demonstrates the importance of accurate measurement and modelling of the compaction stress gradient and permeability for input into simulations.
Graphical abstract
1. Introduction
Many recent developments in Liquid Composite Moulding (LCM) processes have focused on the benefits of through-thickness flow for the impregnation of thick parts [Citation1], for example, Compression Resin Transfer Moulding (CRTM) [Citation2]. A comprehensive computational model of combined transverse impregnation and compression has been previously developed by the authors [Citation3].
Simulation models require accurate input data to make useful predictions, particularly the fabric permeability and compaction behaviour. However, accurate constitutive data are not always available, so input data with a good fit to only some regions of the experimental data are inevitably used in simulations [Citation4]. The recent transverse permeability [Citation1] and compressibility [Citation5] benchmark exercises highlight the increased demand for efficient process design through accurate characterisation of these quantities, but also showed large variations, for each participant, and between different participants. The compaction stress and permeability should be measured for the full range of fibre volume fraction (FVF) expected for the specific process; however, the actual range is often unknown a priori. In practice, the permeability is typically measured at 3 to 5 levels of FVF [Citation1,Citation4,Citation6], and the compaction stress is measured for a given range of FVF [Citation6,Citation7]. The relaxed FVF (at zero stress) is usually found by measuring the FVF at a small nominal stress and then extrapolating to zero stress. Hydrodynamic compaction of saturated preforms results in unknown deviations from the target FVF [Citation6,Citation8]; therefore, the constitutive data often needs to be extrapolated outside the measured range. Klunker et al. [Citation6] demonstrated that different extrapolations of the permeability significantly influence predictions of the flow rate during transverse permeability measurements. Inaccurate representation of the constitutive data introduces errors in simulation predictions which are unrelated to the experimental procedure, simplifying assumptions, computational (e.g. discretisation) errors and/or variation from multiple repeats of experiments.
Various models have been developed to describe the compressibility of reinforcements with respect to FVF [Citation9]. Empirical models are commonly used due to their simplicity and function invertibility, e.g. the power law model [Citation5,Citation10],
(1)
(1)
where
is the effective stress of the reinforcement,
and
are empirical fitting constants,
is the FVF and
is the stress-free initial FVF. For any model, it is important that the compaction stress is monotonically increasing, and the gradient is positive [Citation11].
For the permeability, the most common relation is the Carman-Kozeny model [Citation1,Citation2,Citation4,Citation12]:
(2)
(2)
where
is the through-thickness permeability,
is a material parameter and
The Carman-Kozeny relation is often modified to allow
to improve the fitting quality [Citation13]. A study by Zarandi et al. [Citation14] comparing frequently used permeability models to experiments and simulations found that most theoretical models over-predict transverse permeability.
The current study focuses on quantifying errors made in simulations of processes involving concurrent transverse impregnation and compaction, resulting from errors in fitting different models to experimental compaction and permeability data.
2. Modelling of flow through deformable porous media
The governing equation for incompressible flow through a deformable porous solid (assuming 1D flow in transverse direction) is:
(3)
(3)
(4)
(4)
where
is the voids ratio,
is the Lagrangian coordinate measured from the top of the stack,
the viscosity, and
is the voids ratio in the reference (initial) configuration. Derivations are detailed in [Citation3]. From EquationEquation (4)
(4)
(4) , it is evident that the combination of the permeability and derivative of stress influences the flow dynamics in transverse impregnation and compression processes.
2.1. Case study: saturated transverse permeability measurements
The current study focuses on saturated transverse permeability measurements to highlight the sensitivity of predictions to constitutive data. When experimentally measuring the transverse permeability, a linear fluid pressure gradient is usually assumed; this ‘apparent permeability’ is defined, from Darcy’s law, as:
(5)
(5)
where
and
are the inlet and outlet pressures, respectively,
is the flow rate,
is the cross-sectional area and
is the flow length. Experiments carried out by Klunker et al. [Citation6] are replicated using the simulation model developed by the authors [Citation3], and the experimental parameters described in [Citation6]. A dry sample placed between two plates is compacted at a stress corresponding to the initial FVF
and infiltrated at an injection pressure
with a draining surface at the bottom. The cavity height is constrained to
therefore, the effective stress at the inlet
varies in time as hydrodynamic compaction causes the stack to relax near the inlet and compact near the outlet. This stress
is updated iteratively within each time step to enforce a constant stack thickness. The boundary conditions are given by:
(6)
(6)
(7)
(7)
The volumetric flow rate predicted from simulations is used to calculate the apparent permeability (EquationEquation (5)(5)
(5) ) and compared against the simulation and experimental results provided in Klunker et al. [Citation6].
2.2. Constitutive data and fitting models
The experimental compaction data [Citation6] is fitted using SciPy functions in Python to the ‘power law’ EquationEquation (1)(1)
(1) (fitting constants given in ) and ‘piecewise cubic interpolation’ models (, with root-mean-square-difference (RMSD) values given in ). To investigate the effect of the derivative of stress
(see EquationEquation (4)
(4)
(4) ), two additional models are constructed from the piecewise cubic interpolation model by scaling the stress by 110% (i.e. modify both the magnitude and derivative of stress), and by shifting the stress by +10 kPa (i.e. modify the magnitude of stress only). The derivative of stress is given in , showing good agreement with respect to the scale shown. The relative error in stress magnitude and relative deviation of the stress derivative to the piecewise cubic interpolation model are given in , showing greater errors for lower levels of FVF.
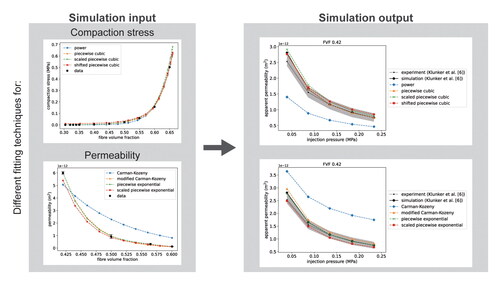
Figure 1. (a) Power law and piecewise cubic interpolation models fitted to compaction stress data in [Citation6], and (b) compaction derivative. (c) Relative error in stress magnitude to experimental data. (d) Relative deviation in stress derivative to the piecewise cubic interpolation model. (e) Carman-Kozeny, modified Carman-Kozeny and piecewise exponential interpolation models fitted to the permeablity data in [Citation6], and (f) extrapolated permeability in the interval [0.3, 0.7]. (g) Relative error in permeability to experimental data.
![Figure 1. (a) Power law and piecewise cubic interpolation models fitted to compaction stress data in [Citation6], and (b) compaction derivative. (c) Relative error in stress magnitude to experimental data. (d) Relative deviation in stress derivative to the piecewise cubic interpolation model. (e) Carman-Kozeny, modified Carman-Kozeny and piecewise exponential interpolation models fitted to the permeablity data in [Citation6], and (f) extrapolated permeability in the interval [0.3, 0.7]. (g) Relative error in permeability to experimental data.](/cms/asset/a403da3d-de79-456a-91db-dd7e595a1aaf/yadm_a_2266288_f0001_c.jpg)
Table 1. Fitting coefficients for the power law compaction model.
Table 2. The fitting quality for the compaction stress and permeability constitutive models.
shows the ‘Carman-Kozeny’ EquationEquation (2)(2)
(2) , ‘modified Carman-Kozeny’ (fitting constants given in ), and ‘piecewise exponential interpolation’ models fitted to the experimental permeability data (
) [Citation6]. The relative error of the permeability models to the experimental data are shown in .
Table 3. Fitting coefficients for the Carman-Kozeny permeability models.
Due to hydrodynamic compaction, fluid injection causes the FVF of the stack to relax/compact relative to the initial pre-compacted FVF, with larger deviations with increasing injection pressure, and the permeability must be extrapolated to outside the range of the measured data (). The permeability data is extrapolated to and
in Klunker et al. [Citation6] by applying linear logarithmic gradients at the boundary data points. The piecewise exponential interpolation model uses these extrapolated points (marked with ‘X’s in ) to closely match the input data used in [Citation6]. An additional model is constructed by scaling the piecewise exponential interpolation model by 80% to investigate the effect of the permeability magnitude.
3. Results and discussion
In the following simulations, when the compaction model is varied, the permeability is modelled using the piecewise exponential interpolation model; when the permeability model is varied, the compaction is modelled using the piecewise cubic interpolation model. shows the apparent permeability against injection pressure for and
with the shaded regions representing the range observed in experiments [Citation6].
Figure 2. Apparent permeability from experiments and simulations in [Citation6] and the developed model using different compaction stress models for initial FVF of (a) 0.42 and (b) 0.50 (with piecewise cubic permeability), and different permeability models for initial FVF of (c) 0.42 and (d) 0.50 (with piecewise exponential compaction stress). The shaded regions represent the range of the apparent permeability observed in the experiments in [Citation6].
![Figure 2. Apparent permeability from experiments and simulations in [Citation6] and the developed model using different compaction stress models for initial FVF of (a) 0.42 and (b) 0.50 (with piecewise cubic permeability), and different permeability models for initial FVF of (c) 0.42 and (d) 0.50 (with piecewise exponential compaction stress). The shaded regions represent the range of the apparent permeability observed in the experiments in [Citation6].](/cms/asset/836f32d9-7625-4494-a6a3-20785f880d12/yadm_a_2266288_f0002_c.jpg)
In , the shifted piecewise cubic interpolation model for the compaction stress gives the largest relative error. However, the predicted apparent permeabilities in for this model matches the experimental values well. The stress derivative has a larger effect on predictions than the magnitude of stress; the relative deviation in the stress derivative () of the different compaction models is directly reflected in the deviations in the predicted apparent permeability. At the relative deviation in the stress derivative is much larger for the power law than the other models, and at
the relative deviation for the power law and scaled piecewise cubic interpolation models are similar. The RMSD of the simulated apparent permeability () for the shifted piecewise cubic interpolation is lower than for the scaled piecewise, and identical to the unmodified piecewise for
further reinforcing that it is more important to accurately capture the stress gradient than the magnitude of stress itself. For higher injection pressures, hydrodynamic compaction can cause the fabric to lose contact with the tool at the inlet, and at the inlet
For
(), the shifted interpolation model (which has a modified
) therefore results in larger errors in the predicted apparent permeability than the scaled piecewise model for higher injection pressures.
The Carman-Kozeny relation for the permeability results in significant over-predictions of the apparent permeability (). In , the relative error in the permeability for the Carman-Kozeny model increases with increasing FVF, which explains the larger deviations in than in .
Piecewise interpolation functions will fit through given data exactly, but they are also heavily influenced by potential outliers. An empirical model (e.g. power law) is typically better at extrapolation. Piecewise functions are relatively difficult to invert (required for pressure-controlled boundary conditions [Citation3]) and, therefore, piecewise compaction stress interpolation models are computationally more expensive. The simulation time for the piecewise cubic compaction stress model is more than six times longer than for the power law model ().
Table 4. The root-mean-squared difference (RMSD) of the simulated apparent permeability to experiments in [Citation6] for the different compaction stress and permeability constitutive models and corresponding total simulation times when carried out using 20 elements on an Intel Core [email protected] GHz with 32 GB RAM.
4. Conclusions
A simulation model is utilised to investigate the sensitivity of processing predictions to input data from out-of-plane compressibility and permeability characterisation tests. The main conclusions were:
The commonly used Carman-Kozeny permeability relation results in poor predictions and is not recommended for transverse impregnation/compression simulations.
It is more important to accurately capture the derivative than the magnitude of the compaction stress, especially for lower levels of FVF, where the relative error is usually larger than for higher levels of FVF.
Piecewise interpolation models are more accurate than empirical models; however, extrapolation can be unreliable, and in the case of compaction stress models, simulation times are multiple times greater for piecewise interpolation models than for empirical models.
The errors resulting from inaccurate constitutive models result in unreliable process predictions and can lead to undesirable manufacturing outcomes, such as incomplete infiltration, underestimated mould forces and inaccurate predictions of process times.
Disclosure statement
No potential conflict of interest was reported by the authors.
Data availability statement
The data that support the findings of this study are available from the corresponding author, J. L., upon reasonable request.
References
- Yong A, Aktas A, May D, et al. Out-of-plane permeability measurement for reinforcement textiles: a benchmark exercise. Compos A: Appl Sci Manuf. 2021;148:106480. doi: 10.1016/j.compositesa.2021.106480.
- Merotte J, Simacek P, Advani S. Resin flow analysis with fiber preform deformation in through thickness direction during compression resin transfer molding. Compos A: Appl Sci Manuf. 2010;41(7):881–887. doi: 10.1016/j.compositesa.2010.03.001.
- Lee J, Duhovic M, Allen T, et al. Computational modelling and analysis of transverse liquid composite moulding processes. Compos A: Appl Sci Manuf. 2023;167:107433. doi: 10.1016/j.compositesa.2023.107433.
- Merotte J, Simacek P, Advani S. Flow analysis during compression of partially impregnated fiber preform under controlled force. Compos Sci Technol. 2010;70(5):725–733. doi: 10.1016/j.compscitech.2010.01.002.
- Yong A, Aktas A, May D, et al. Experimental characterisation of textile compaction response: a benchmark exercise. Compos A: Appl Sci Manuf. 2021;142:106243. doi: 10.1016/j.compositesa.2020.106243.
- Klunker F, Danzi M, Ermanni P. Fiber deformation as a result of fluid injection: modeling and validation in the case of saturated permeability measurements in through thickness direction. J Compos Mat. 2015;49(9):1091–1105. doi: 10.1177/0021998314530766.
- Danzi M, Klunker F, Ermanni P. Experimental validation of through-thickness resin flow model in the consolidation of saturated porous media. J Compos Mater. 2017;51(17):1–9.
- Willenbacher B, May D, Mitschang P. Metrological determination of inhomogeneous hydrodynamic compaction during unsaturated out-of-plane permeability measurement of technical textiles. Adv Manuf : Polym Compos Sci. 2019;5(2):51–54. doi: 10.1080/20550340.2019.1598049.
- Kelly PA, Wijaya W. Transverse compression properties of composite reinforcements. In: Boisse P, editor. Composite reinforcements for optimum performance. 2nd ed. Cambridge: Woodhead Publishing; 2021, p. 333–374.
- Ouagne P, Ouahbi T, Park C, et al. Continuous measurement of fiber reinforcement permeability in the thickness direction: experimental technique and validation. Compos B. 2013;45(1):609–618. doi: 10.1016/j.compositesb.2012.06.007.
- Billi L, Farina A. Unidirectional infiltration in deformable porous media: mathematical modelling and self-similar solution. Q Appl. Math. 2000;58(1):85–101. doi: 10.1090/qam/1738559.
- Carman PC. Fluid flow through granular beds. Trans Inst Chem Eng. 1937;15:150–166.
- Gutowski T. Advanced composites manufacturing. New York (NY): John Wiley & Sons; 1997.
- Zarandi M, Arroyo S, Pillai K. Longitudinal and transverse flows in fiber tows: evaluation of theoretical permeability models through numerical predictions and experimental measurements. Compos A: Appl Sci Manuf. 2019;119:73–87. doi: 10.1016/j.compositesa.2018.12.032.