
ABSTRACT
Cytoplasmic vacuolization is commonly induced by bacteria and viruses, reflecting the complex interactions between pathogens and the host. However, their characteristics and formation remain unclear. Nervous necrosis virus (NNV) infects more than 100 global fish species, causing enormous economic losses. Vacuolization is a hallmark of NNV infection in host cells, but remains a mystery. In this study, we developed a simple aptamer labelling technique to identify red-spotted grouper NNV (RGNNV) particles in fixed and live cells to explore RGNNV-induced vacuolization. We observed that RGNNV-induced vacuolization was positively associated with the infection time and virus uptake. During infection, most RGNNV particles, as well as viral genes, colocalized with vacuoles, but not giant vacuoles > 3 μm in diameter. Although the capsid protein (CP) is the only structural protein of RGNNV, its overexpression did not induce vacuolization, suggesting that vacuole formation probably requires virus entry and replication. Given that small Rab proteins and the cytoskeleton are key factors in regulating cellular vesicles, we further investigated their roles in RGNNV-induced vacuolization. Using live cell imaging, Rab5, a marker of early endosomes, was continuously located in vacuoles bearing RGNNV during giant vacuole formation. Rab5 is required for vacuole formation and interacts with CP according to siRNA interference and Co-IP analysis. Furthermore, actin formed distinct rings around small vacuoles, while vacuoles were located near microtubules. Actin, but not microtubules, plays an important role in vacuole formation using chemical inhibitors. These results provide valuable insights into the pathogenesis and control of RGNNV infections.
KEYWORDS:
Introduction
Unlike plants, animal cells do not usually contain vacuoles as organelles. However, after infection with pathogens or exposure to chemicals, animal cells also exhibit cytoplasmic vacuolization, which is often accompanied by cell damage and even cell death. At present, research on animal cell vacuolization is limited; therefore, the formation mechanism and function of most cytoplasmic vacuolization are still unclear.
Several viruses such as Alphavirus, simian virus (SV40), and Semliki Forest Virus (SFV) have been shown to cause dramatic cytoplasmic vacuolization [Citation1–3]. SV40 is the only known polyomavirus with obvious vacuolizing activities and usually induces vacuoles at late infection stages, suggesting that vacuolization may be coincident with progeny virus release. SV40-induced vacuolization is triggered by the interaction between the major viral capsid protein (VP1) and the cell surface ganglioside receptor (GM1) [Citation3].
In aquatic animals, nervous necrosis virus (NNV) infection can cause vacuolation of tissues and cells. NNV belongs to the Betanovirus genus of the Nodaviridae family and is a causative agent of viral nervous necrosis (VNN) disease. The virus infects more than 100 fish species globally and causes severe mortality and economic losses to the global aquaculture industry [Citation4]. NNVs are approximately 25–30 nm in diameter, with a non-enveloped icosahedral structure. The genome comprises two single-stranded positive-sense RNA molecules, RNA1 and RNA2. RNA1 encodes RNA-dependent RNA polymerase (RdRp) and RNA2 encodes viral capsid protein (CP) [Citation5]. During RNA replication, an RNA1 subgenome, RNA3, is generated that encodes B1 and B2 proteins [Citation6]. NNV is typically classified into four genotypes: striped jack nervous necrosis virus (SJNNV), red spotted grouper nervous necrosis (RGNNV), tiger puffer nervous necrosis virus (TPNNV), and barfin flounder nervous necrosis virus (BFNNV) [Citation7]. RGNNV is the most serious genotype and is prevalent mainly in Asia, Europe, Australia, and North America [Citation8]. Despite the simple structure of NNV, its interactions with hosts are complex and largely unexplored. Typical symptoms of NNV-infected fish include vacuolization and necrosis of the central nervous system [Citation9]. NNV-infected cells are also characterized by cellular vacuoles during infection [Citation10]. Huang et al. showed that RGNNV-induced vacuole formation from lysosomes was highly associated with cell death [Citation11]. However, the characteristics of the NNV-induced vacuoles remain unclear.
The direct observation of individual virions in host cells provides critical insights into virus biology; however, challenges arise when fluorescently labelling viral particles. Several strategies have been used for virus labelling, such as dye molecules, fluorescent proteins, antibodies, and quantum dots [Citation12,Citation13]. Fluorescent dyes are relatively convenient, but the process requires viral purification to remove interference from cellular debris [Citation14,Citation15]. Similarly, purification typically requires complex and long-term preparation procedures. In addition, some viruses such as NNV are difficult to purify because of their small particle size. Thus, rapid and convenient fluorescence labelling remains a challenge.
Aptamers are promising tools for use in molecular imaging. Aptamers are single-stranded oligonucleotides (DNA or RNA) that specifically bind to several targets, including cells, bacteria, parasites, viruses, proteins, ions, and toxins, and are widely used in multiple fields including detection, imaging, clinical diagnostics, and therapy [Citation16]. Aptamers exhibit low toxicity, are easily synthesized and modified, and their convenient functionalization facilitates the easy production of aptamer dyes for imaging [Citation17]. Fluorescent light-up RNA aptamers have been developed for visualizing RNAs in living cells and are used in ratiometric RNA analysis of target RNAs in single cells [Citation18]. The distribution of matrix metalloproteinase-14 on the cell membrane was characterized by combining the aptamer probe and dSTORM [Citation19]. DNA aptamers that bind to glial tumour cells can be used for fluorescence-guided surgery of brain tumours [Citation20].
Here, we report a new method to track RGNNV using a fluorescently labelled aptamer, which is simple to use and does not affect viral infectivity. We then comprehensively investigated the formation of RGNNV-induced giant vacuoles, which furthers our understanding of RGNNV infectivity, especially the unusual cytopathic effects of viral infection, and benefits virus prevention and control.
Materials and methods
Cells, viruses and reagents
The grouper spleen (GS) cell line used in this study was established in our laboratory [Citation21]. Briefly, the cells derived from the spleen of orange spotted grouper, Epinephelus coioides were cultivated and maintained at 28 °C in Leibovitz’s L-15 medium supplemented with 10% foetal bovine serum (FBS, Gibco, USA). RGNNV was isolated in our laboratory and propagated into GS cells. viruses were stored at −80 °C until use.
Cytochalasin D (Cyto D, #C2618) and nocodazole (#M1404) were purchased from Sigma-Aldrich (MO, USA) and dissolved in dimethyl sulphoxide (DMSO, #8418). Alexa Fluor 488 phalloidin (#A12379) was purchased from Invitrogen (CA, USA). The lipophilic dye DiO (#60015) was purchased from Biotium (CA, USA). The plasmid pEGFP-Rab5 was maintained in our laboratory.
The primary antibodies used in this study were as follows: anti-GFP (Abcam, ab 290), anti-β-tubulin (Abcam, ab 6046), anti-HA (Sigma-Aldrich, H3663), and anti-CP (prepared in our laboratory). FITC- and horseradish peroxidase (HRP)- conjugated goat anti-rabbit (#SA00003–2, #SA00001–2) and anti-mouse (#SA00003–1, #SA00001–1) antibodies were purchased from Proteintech (Chicago, USA).
Aptamers and small interfering RNA (siRNA) sequences
The aptamer B11 sequence (5′-TTCTTTTATTAGTTGATTTTTTTGATTTTGGCAGCTACTGCTTTGGGGGT-3′) was generated against RGNNV-CP based on our previous study [Citation22]. Aptamer B11 was synthesized and labelled with Alexa Fluor 647 (5’ end) by Invitrogen Biotechnology Co., Ltd. (Shanghai, China). Rab5-specific siRNA (siRab5: sense 5′-3′: AGACUGCUAUGAAUGUCAAUGAGAU, antisense 5′-3′: AUCUCAUUGACAUUCAUAGCAGUCU) was synthesized by Invitrogen.
Fluorescent labelling of RGNNV
RGNNV was used to infect GS cells at a multiplicity of infection (MOI) of approximately 1. When cytopathic effects were evident, RGNNV was harvested in the medium, underwent repeated freeze/thaw cycles, and stored at −80℃. The Alex-Fluor 647-labelled aptamer was denatured at 92℃ for 8 min and placed on ice for another 5 min. Then, 200 nM aptamer was incubated with lysed RGNNV-infected cells with intermittent shaking to facilitate fluorescence labelling. Fluorescently labelled RGNNV particles were freshly prepared before the infection studies.
Immunofluorescence assay (IFA)
The immunofluorescence assay was performed as described previously [Citation23]. Briefly, cells were fixed with 4% paraformaldehyde at room temperature for 1 h, and permeabilized with 0.2% Triton X-100 (#T8787, Sigma-Aldrich, USA) for 15 min. After washing with phosphate buffer saline (PBS), the cells were blocked with 2% bovine serum albumin (BSA, #SRE0096, Sigma-Aldrich, USA) and incubated with anti-CP (1:200). The cells were then incubated with a secondary antibody (FITC-conjugated goat anti-rabbit IgG) followed by staining with Hoechst 33,342 (#C1022, Beyotime, Shanghai, China). Finally, cells were observed under a fluorescence microscope (Zeiss, Germany).
Cell transfection
Cell transfection followed the protocol in our previous study [Citation24]. GS cells were seeded in 35-mm glass bottom culture dishes or 24-well plates for 18–24 h, and transfection was carried out using Lipofectamine 2000 (#11668019, Invitrogen, USA) according to the manufacturer’s instructions. Briefly, 800 ng of plasmid, 3 μL of siRNA (20 μM), and 2 μL of Lipofectamine 2000 were mixed and added to the cells. After incubation for 6 h, the medium was replaced with fresh medium and then the cells were cultured at 28 °C for further study.
Confocal imaging analysis and real-time virus tracking assay
Fluorescent images were obtained using a confocal laser scanning microscope (CLSM) (Zeiss LSCM 7 DUO, Germany). Alexa Fluor 647 was excited using a 633 nm helium neon laser and a 650–700 nm bandpass filter for emission. A 533 nm laser was used to excite the Cy3 signal, and a 540–590 nm bandpass filter was used for emission. A 488 nm Ar-Kr laser was used to excite EGFP signals, and a 500–550 nm bandpass filter was used for emission. A 100 × oil immersion objective lens with a numerical aperture of 1.4 was used to observe fluorescence.
To calculate the internalized RGNNV, confocal images were further analysed by noise filtering, edge detection, and fluorescence signal extraction using MATLAB, a program for the quantification analysis of fluorescence signal intensity. To calculate vacuole diameters, confocal images were analysed using ImageJ software.
For live cell fluorescence imaging, GS cells were rinsed in foetal bovine serum-free, phenol red-free medium prior to fluorescence studies, and maintained in this medium for confocal imaging and real-time studies.
Fluorescence in situ hybridization (FISH)
FISH was performed using an RNA FISH Probe Kit (GenePharma, Shanghai, China) according to the manufacturer’s instructions. Briefly, GS cells were seeded in 35 mm glass bottom culture dishes for 24 h, and RGNNV was added at the indicated times. After washing in phosphate buffered saline (PBS), the cells were fixed in 4% paraformaldehyde for 1 h and permeabilized in 0.1% Triton X-100 for 15 min. After washing with PBS, cells were incubated in 2×SSC buffer for 30 min at 37℃. After washing in absolute ethanol, cells were incubated with a FISH probe targeting CP for a 5 min denaturation step at 73 °C, then hybridized and incubated overnight at 37 °C. The next day, after washing separately in Tween-20 and SSC buffer, the cells were stained with nuclear Hoechst 33,342 stain and observed under CLSM.
RNA extraction and qRT-PCR
RNA extraction and qRT-PCR was performed as described previously [Citation25]. Total RNA isolation was performed using the SV Total RNA Isolation System (#Z3100, Promega, USA) according to the manufacturer’s instructions, and reverse transcription was carried out using ReverTraAce (#FSQ-101, Toyobo, Japan). qRT-PCR was performed on a Roche 480 Real-Time Detection System (Roche, German). Each assay was performed in triplicates. The Data are represented as mean ± SEM, and statistical significance was determined using Student’s t-test. The significance level was defined as p < 0.05(*).
Western Blot (WB) analysis
The cells were collected and lysed in PierceTM IP Lysis Buffer (#87787, Thermo Scientific, USA). Proteins were separated by 10% SDS-PAGE and transferred onto Immobilon-polyvinylidene difluoride (PVDF) membranes (Millipore, USA). After blocking with 5% skim milk dissolved in PBST (0.1% Tween 20), the membrane was incubated with the indicated primary antibodies: anti-β-tubulin (1:2,000 dilution, #10094–1-AP, Proteintech, USA) and anti-RGNNV capsid protein (CP) (1:1,000 dilution). The secondary antibody was horseradish peroxidase (HRP)-conjugated goat anti-rabbit IgG (1:5,000 dilution, #SA00001–2, Proteintech, USA). Immunoreactive proteins were visualized using an Enhanced HRP-DAB Chromogenic Substrate Kit (#PA110, Tiangen, China). The data were obtained from three independent experiments.
CO-Immunoprecipitation (CO-IP)
To verify the interaction between Rab5 and CP-RGNNV, pEGFP-C1 and pEGFP-Rab5 plasmids were transfected into GS cells. At 24 h post-transfection, the cells were infected with RGNNV, as previously described. At the indicated times post-infection, cells were lysed in IP lysis buffer supplemented with a protease inhibitor cocktail and centrifuged at 12,000 × g for 3 min, and the supernatant was collected for western blotting and CO-IP using the DynabeadsTM Protein G Immunoprecipitation Kit (#10007D, Invitrogen, USA). Briefly, magnetic beads were prepared and incubated with anti-GFP for 10 min at room temperature. Beads were incubated with the sample containing the antigen for 30 min. After washing in the wash buffer, the target antigens were eluted and subjected to western blotting. Primary antibodies specific for GFP and CP were used to detect protein expression and interactions.
Results
Fluorescent dye aptamers label and recognize RGNNV particles
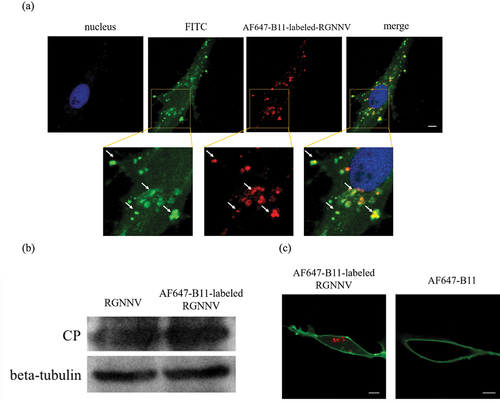
Based on previously selected aptamers targeting RGNNV with high specificity and affinity [Citation22], the Alexa Fluor 647-labelled B11 aptamer AF647-B11 was used to prepare fluorescently labelled RGNNV (AF647-B11-labelled RGNNV). To confirm that AF647-B11 specifically labelled RGNNV, an antibody against RGNNV-CP was used for immunofluorescence. Approximately 100% of AF647-B11-labelled RGNNV particles exhibited CP signals, suggesting highly efficient labelling of RGNNV with AF647-B11 (). In addition, given that aptamers inhibit RGNNV infection in a concentration-dependent manner [Citation22], we investigated AF647-B11 optimization without affecting RGNNV infection. As shown (), 200 nM of B11 had no effect on RGNNV infection. We demonstrated that AF647-B11 entered the cells only after incubation with RGNNV (). These results strongly suggest that AF647-B11 specifically fluorescently labels RGNNV without affecting viral infection.
Figure 1. Imaging aptamer-labelled RGNNV particles (a) AF647-B11-labelled RGNNV (red) colocalizes with the anti-CP antibody labelling (green). GS cells were infected with AF647-B11-labelled RGNNV and fixed at 1 hpi for further IFA. The nucleus was stained with Hoechst 33,342. (b) AF647-B11 (200 nM) exerted no significant effects on RGNNV replication. GS cells were separately infected with RGNNV or AF647-B11-labelled RGNNV and collected at 36 hpi for western blotting. (c) AF647-B11 enters GS cells only when incubated with RGNNV particles. GS cells were separately incubated with AF647-B11-labelled RGNNV or AF647-B11 and fixed at 1 hpi. Cells were stained with DiO to highlight the cell membrane (green). Scale bar = 5 μm.
Time course of RGNNV-induced vacuolization
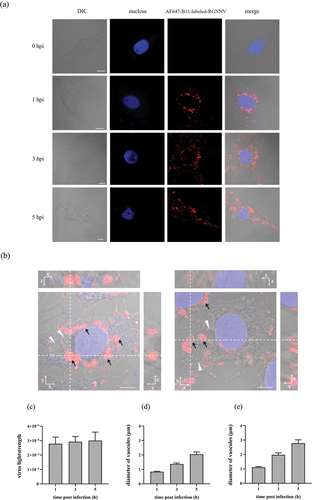
The time course of RGNNV-induced vacuoles was monitored using CLSM. During RGNNV infection, abundant vacuoles with gradually increasing sizes appeared in the cytoplasm in a time-dependent manner, with most co-localizing with RGNNV particles (). Interestingly, some RGNNV particles were inside the vacuoles, whereas others were located on the vacuole membranes (). Furthermore, RGNNV levels and vacuole diameters were quantified at different time points after RGNNV infection (MOI = 20). At 1, 3, and 5 h post infection (hpi), the number of internalized RGNNV particles showed no significant difference, suggesting that RGNNV entry was roughly completed within 1 hpi (). The result is similar to one report that orange-spotted grouper nervous necrosis (OGNNV) invaded into Asian sea bass (SB) cells is a very rapid process and accumulated near the nucleus almost within 60 min [Citation26]. In addition, the average vacuole diameter/cell significantly increased with prolonged infection time (). At 1 hpi, the average vacuole diameter/cell was 1 μm, whereas at 5 hpi, it was 2 μm. A similar trend was observed when the average diameter of the largest vacuoles/cell was calculated (). Additionally, NNV signals rarely appeared in vacuoles >3 μm in size ().
Figure 2. The time course of RGNNV-induced cytoplasmic vacuoles (a) imaging of RGNNV and vacuoles at different hpi. GS cells were incubated with AF647-B11-labelled RGNNV followed by fixation at 0, 1, 3, and 5 hpi for imaging. The nucleus was stained with Hoechst 33,342. (b) Three-dimensional (3D) images of vacuoles in RGNNV infected cells. GS cells were incubated with AF647-B11-labelled RGNNV and fixed at 5 hpi for imaging. Successive Z-stacks spaced by 200 nm were recorded to construct 3D images. The xz image plane was used for recording and was approximately 1 μm thick. small vacuoles (<3 μm) were indicated by the black arrows, and large vacuoles (>3 μm) were indicated by white arrowheads. Red fluorescence represented RGNNV. (c) Quantification analysis of internalized RGNNV levels; > 80 cells were randomly selected and analysed by MATLAB. (d-e) quantitative analysis of the diameters of all vacuoles/cell (d) and the biggest vacuoles/cell (e) during RGNNV infection. Vacuole diameters were analysed by image J. Scale bar = 5 μm.
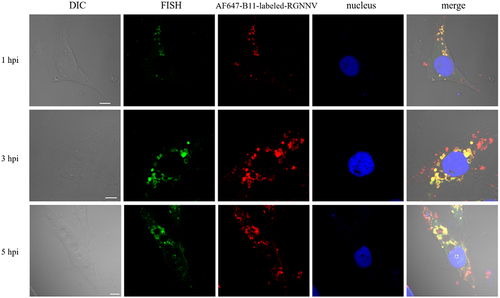
Next, we performed FISH using a specific probe targeting the viral CP to explore the relationship between viral nucleic acids and vacuoles. At different times post-infection, CP was always associated with the RGNNV capsid protein and co-localized with vacuoles (). For giant vacuoles of 3 μm diameter, viral gene CP, as well as CP, rarely appeared. Instead, they colocalized with small vacuoles that aggregated around enlarged vacuoles ().
Figure 3. CP gene colocalized with vacuoles during RGNNV infection. GS cells were infected with AF647-B11-labelled RGNNV (red) synchronously, and fixed at 1, 3, and 5 hpi. A specific FISH probe (green) was used to target viral CP. Scale bar = 5 μm.
These observations suggest that vacuoles enlarged in a time-dependent manner post-infection and loss of association with RGNNV as time precedes.
RGNNV-induced vacuolization positively correlates with viral load
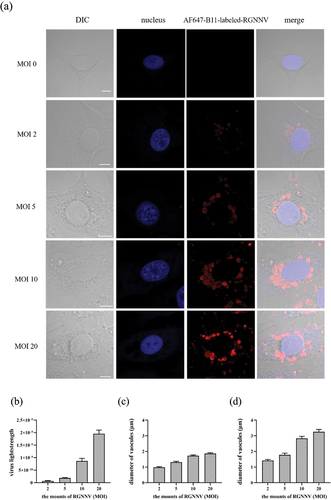
Next, we explored the effect of the viral load on RGNNV-induced vacuolization. The GS cells were incubated with different RGNNV MOIs and fixed at 5 hpi for imaging. The fluorescence signal intensities represent the quantity of internalized RGNNV. The more RGNNV particles entered the cells, the stronger the fluorescence intensity. As shown (), internalized RGNNV rapidly increased with increased virus addition. Accordingly, more enlarged vacuoles appeared in cells with higher MOIs. At an MOI of 2, RGNNV-induced vacuoles had an average diameter of approximately 1 μm, and the average diameter of the biggest vacuole/cell was 1.4 μm. However, at an MOI of 20, the average diameter increased to 2 μm, and the average diameter of the largest vacuole/cell was 3.3 μm (). These observations demonstrate that RGNNV-induced vacuolization is significantly and positively affected by RGNNV load.
Figure 4. Analysis of internalized virus and vacuolization after RGNNV infection at different MOIs (a) GS cell imaging with different RGNNV MOIs at 5 hpi. GS cells were incubated with AF647-B11-labelled RGNNV (MOI = 0, 2, 5, 10, 20) as described. Cells were fixed 5 hpi. The nucleus was stained with Hoechst 33,342. (b) Quantification analysis of internalized RGNNV at different MOIs; > 80 cells were randomly selected and analysed by MATLAB. (c-d) quantitative analysis of the diameters of all vacuoles/cell (c) and the biggest vacuoles/cell (d) infected with different RGNNV MOIs. Vacuole diameters were analysed by image J software. Scale bar = 5 μm.
Overexpressed CP does not induce vacuole formation
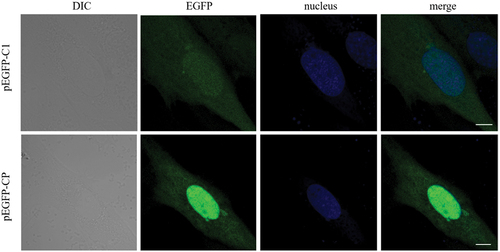
Since CP is the only NNV structural protein, we tested whether CP overexpression induces vacuolization. As shown (), no vacuoles were observed in the cells transfected with pEGFP-CP, suggesting that CP alone failed to induce vacuolization. Hence, we inferred that NNV-induced vacuolization may require viral nucleic acids or replication.
Figure 5. CP overexpression did not induce vacuoles. GS cells were transfected with pEGFP-C1 or pEGFP-CP. At 24 hpi, cells were fixed and nuclei stained with Hoechst 33,342. Scale bar = 5 μm.
Rab5 plays an important role in NNV-induced vacuole fusion
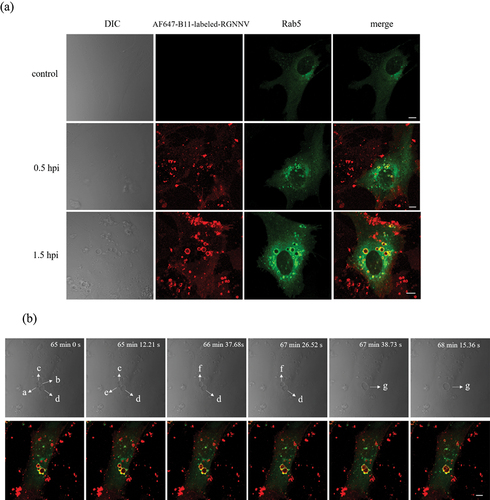
NNV-induced vacuoles gradually enlarged with increasing infection time and virus load. However, this mechanism remains largely unknown. It was previously hypothesized that enlarged vacuoles are formed by fusion of smaller vacuoles [Citation11]. Given the importance of Rab5 in regulating vesicle fusion [Citation27], we investigated whether Rab5 plays a role in RGNNV-induced vacuolization. As shown (), most NNV-vacuoles, from small to giant, colocalized with Rab5-positive vesicles at different times post-infection. In addition, Rab5-positive vesicles were much larger in RGNNV-infected cells than in the uninfected controls (). Furthermore, the dynamic process of Rab5-positive vacuole fusion was tracked in real time using live-cell imaging. A series of Rab5-positive vacuole fusion events occurred continuously, resulting in the formation of giant vacuoles. As shown (), four different sized vacuoles were adjacent to each other (a, b, c, and d). Dynamically, the relatively small vacuoles (a and b) fused abruptly (within 13 s) and formed a single enlarged vacuole (e). Second, the two relatively small vacuoles (c and e) rapidly fused to form a single enlarged vacuole (f). Third, the remaining vacuoles (f and d) abruptly fuse to form a new giant vacuole (g). These fusion steps occurred rapidly, similar to “explosive” fusion steps observed elsewhere [Citation28]. During this process, Rab5 and NNV colocalized with the vacuoles.
Figure 6. Rab5 is highly correlated with NNV induced vacuolar fusion (a) the obvious colocalization between Rab5 and vacuoles bearing RGNNV. GS cells transfected with pEGFP-Rab5 were incubated with AF647-B11-labelled RGNNV at 4 °C for 20 min and then immediately transferred to 28 °C to initiate infection. The cells were fixed with 4% paraformaldehyde at 0.5, 1.5 hpi. GS cells transfected with pEGFP-Rab5 were used as the control. (b) The real-time tracking of dynamic fusion of early endosomes bearing RGNNV. GS cells transfected with pEGFP-Rab5 were incubated with AF647-B11-labelled RGNNV and images captured by CLSM. Red fluorescence represented RGNNV, and green fluorescence represented Rab5. Scale bar = 5 μm.
To further clarify the role of Rab5 in vacuolization, vacuole size was analysed after Rab5 knockdown. As shown (), Rab5 silencing had no effect on NNV entry, but significantly affected vacuole size. In Rab5 silenced cells, the diameters of vacuoles or the largest vacuoles/cell were significantly smaller than those in control cells, with reductions of 31.90% and 32.52%, respectively. Furthermore, CP also interacted with Rab5 from the early to late stages of viral infection (). In addition, when Rab5 was silenced, viral gene (CP and RdRp) transcription and expression were significantly reduced (), suggesting that Rab5 was required for RGNNV infection.
Figure 7. Vacuoles induced by RGNNV are related to Rab5. (a) Imaging of RGNNV and vacuoles in cells transfected with si-control (NC) or si-Rab5 (siRab5). GS cells were transfected with NC or siRab5 respectively. At 24 h post transfection, the cells were incubated with AF647-B11-labelled RGNNV, and then were fixed with 4% paraformaldehyde at 3 hpi. (b) Rab5 knockdown did not affect RGNNV entry. >80 cells were randomly selected and analysed by MATLAB program. (c-d) Rab5 knockdown significantly reduced the diameter of all vacuoles/cell (c) and diameters of the biggest vacuoles/cell (d). (e) Interactions between CP and Rab5 by IP. GS cells were transfected with pEGFP-C1 or pEGFP-Rab5. At 24 h post-transfection, cells were incubated with RGNNV and collected at 4 hpi and 24 hpi for IP. (f) Rab5 knockdown inhibited virus replication. GS cells were transfected with pEGFP-C1 or pEGFP-Rab5. At 24 h post-transfection, after cells were incubated with RGNNV, they were collected at 24 hpi for qRT-PCR and WB (n = 3, mean ± standard error of the mean (SEM)). *p < 0.05. Scale bar = 5 μm.
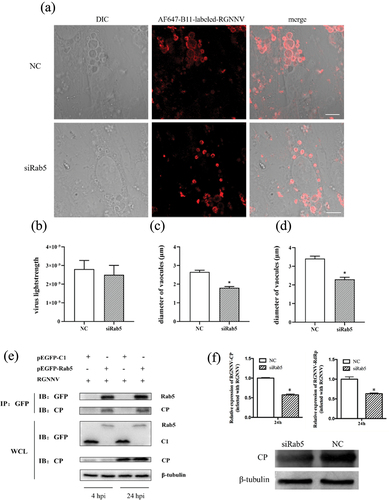
Taken together, these results demonstrated NNV interacted with Rab5 to regulate vacuole enlargement.
Actin assembly on NNV-bearing vacuoles
The cytoskeleton primarily includes actin filaments and microtubules, which play key roles in cellular vesicle formation and transport. However, the relationship between cytoskeleton and RGNNV-induced vacuoles is poorly understood. To evaluate whether the host cytoskeleton is associated with RGNNV-induced vacuoles, we investigated the spatial distribution of actin filaments, microtubules, and vacuoles after RGNNV infection. Although actin filament morphology was unaffected by RGNNV infection, actin filaments and actin tails colocalized with RGNNV-bearing vacuoles (). Interestingly, actin formed uniform rings around small and large RGNNV-bearing vacuoles. In contrast, microtubules rarely colocalized with these vacuoles, but were adjacent to them (). These findings indicated that actin and microtubule structures may be involved in the establishment of RGNNV-induced vesicles.
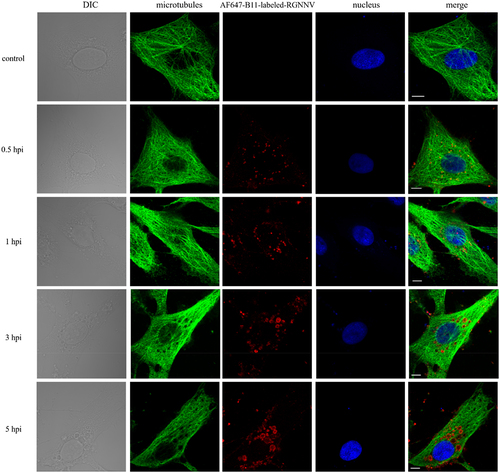
Figure 8. Colocalization between actin and vacuoles bearing RGNNV. GS cells were infected with AF647-B11-labelled RGNNV (red) at 28 °C for 0.5, 1, 3, 5 h, fixed, and incubated with Alexa Fluor 488 phalloidin (green) for 30 min to indicate actin. Scale bar = 5 μm.
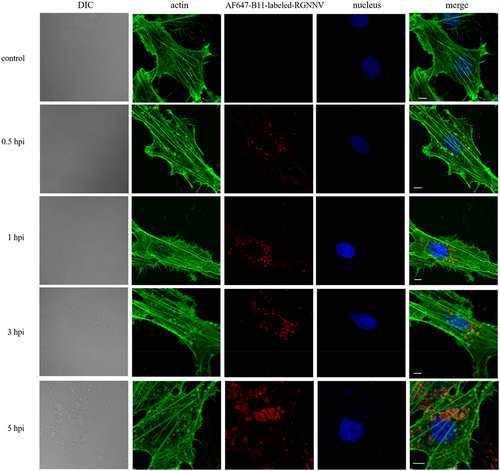
Figure 9. The vacuoles bearing RGNNV were colocalized with microtubules. GS cells were infected with AF647-B11-labelled RGNNV (red) at 28°C for 0.5, 1, 3, 5 h, and then fixed with 4% paraformaldehyde. Anti-β-tubulin was used to indicate microtubules (green) by IFA. The images were captured by CLSM. Scale bar = 5 μm.
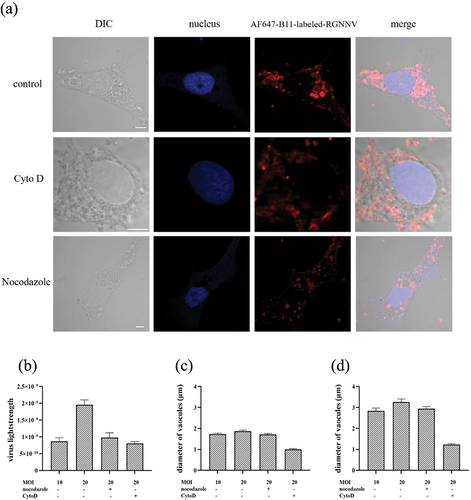
To further investigate the role of the cytoskeleton in the formation of RGNNV-induced vesicles, we quantified the vacuole size by chemically disrupting actin or microtubule formation. This process blocked RGNNV-induced vesicles to a small size (). However, given that vacuole size depended on RGNNV uptake, we could not exclude the possibility that size reductions in vesicles resulted from reduced internalization of RGNNV. To address this, we quantified the internalized RGNNV levels. At an MOI of 20, internalized RGNNV levels were reduced by 58.80% or 49.78% after treatment with Cyto D or nocodazole, respectively, similar to untreated cells infected with RGNNV at an MOI of 10. Hence, cells infected with RGNNV (MOI = 10) were chosen as controls to ensure the same levels of intracellular viruses. In addition, compared to the untreated cells (vacuoles diameter ~2 μm), vacuole size was significantly decreased in Cyto D-treated cells (~1 μm) but remained unaffected in nocodazole-treated cells (~2 μm) (). These results suggested that actin is required for RGNNV-induced vacuolization.
Figure 10. RGNNV-induced vacuoles were analysed when actin or microtubules were disrupted. (a) Imaging of RGNNV and vacuoles in cells untreated or treated with cyto D or nocodazole. GS cells were pretreated with 2 μM cyto D for 1 h or 4 μM nocodazole for 2 h before infection with AF647-B11-labelled-RGNNV. (b) Cyto D or nocodazole significantly affected RGNNV entry. More than 80 cells were randomly selected and analysed by MATLAB program. (c-d) the quantitative analysis of the diameter of (c) all vacuoles and (d) the biggest vacuole in cyto D- or nocodazole- treated cells during RGNNV infection. Vacuole diameter was analysed using image J software. Scale bar = 5 μm.
Discussion
Cytoplasmic vacuolization is the most distinguishing feature of NNV infection; however, little is known about its mechanism. To efficiently track RGNNV-induced vacuolization, we developed a simple fluorescent labelling technology for RGNNV particles based on a specific aptamer without affecting virus infectivity. The aptamer is adaptable and can be easily modified with fluorescent dyes to specifically target viral CP. Therefore, this method does not require complex virus purification steps to bind fluorescent dyes or the construction of recombinant viral plasmids expressing fluorescent proteins. Aptamers, as emerging probes for imaging, have been applied to other viruses and proteins. Aptamer A22 was generated against haemagglutinin of influenza A virus and was successfully labelled with QDs for virus imaging [Citation29], whereas an aptamer targeting GLUTI was applied to the super-resolution imaging of GLUT1 [Citation30].
Upon RGNNV infection, vacuolization occurred in a time- and viral dose-dependent manner. This phenomenon was also observed in SV40 induced vacuoles; When CV-1 cells were infected with SV40 at different MOIs, variable vacuole sizes were generated. During infection, acute vacuolization occurs at late infection stages (60–72 hpi) at an MOI of 10, but occurs as early as 4 hpi at higher MOIs (100–1000) [Citation3]. In addition to RGNNV and SV40, the time of appearance, rather than the number, of SFV-induced vacuolization was also affected by the multiplicity of SFV infections [Citation31]. Similarly, the number and size of vacuoles induced by Oncolytic alphavirus M1 in HepG2 cells gradually increased with virus infection time at 6 h, 12 h and 18 hpi [Citation1].
During vacuolization, RGNNV particles and the CP gene consistently colocalized with most vacuoles, filling the vacuoles or locating the vacuole edges, but rarely with giant vacuoles >3 μm in diameter. Huang et al. reported that RGNNV-induced vacuolization is accompanied by cell death, implying that vacuolization may play a role in RGNNV release and spread between cells [Citation11].
The detailed role of vacuoles of different sizes requires further investigation. In ZIKV infected cells, large vacuoles are usually indicative of cell death, but are virtually empty and occasionally contain virus-like particles in the lumen, suggesting that they are not major virus production or accumulation sites [Citation32]. Many ZIKV RNAs and E proteins are concentrated at the vacuole borders, suggesting that vacuole formation may promote virus release and spread [Citation32]. Additionally, three types of cytopathic vacuoles are formed during the early and late stage of Oncolytic alphavirus M1 infection, suggesting their involvement in the replication, maturation and release of the virus [Citation1].
Interestingly, overexpression of CP alone did not induce vacuoles, suggesting that RGNNV induced vacuolization might require intact virus particles, virus uptake, or other interactions between viral and host membrane proteins. It should be noted that the vacuolization mechanisms of different viruses are highly diverse. HuH-7 cells transfected with a plasmid expressing the Hepatitis B Virus large surface protein exhibit numerous large vacuoles and undergo apoptosis [Citation33]. SV40-induced vacuolization does not require active virus replication but may be triggered by the binding of VP1 to the cell surface ganglioside receptor, GM1 [Citation3]. For SFV, transfection of infectious RNA or expression of nsP3 (viral protein) alone induced vacuoles, suggesting that vacuolization did not require incoming virus particles [Citation31].
Notably, RGNNV-induced vacuoles were highly positive for Rab5, an early endosomal marker. In addition, Rab5-positive vesicles in RGNNV-infected cells were considerably larger than those in the uninfected cells. The dynamics of Rab5, vacuoles, and RGNNV were tracked in live cells, showing that Rab5-positive vacuoles carrying virus particles often fused with each other in series. It was previously shown that enlarged vacuoles arise from the rapid fusion of smaller vesicles and not from osmotic vesicle swelling. These fusion or “explosive” fusion processes occurred rapidly and were observed in cells overexpressing a Rab5:Q79L mutant (constitutively active Rab5 mutant). Also, another fusion pattern, “bridge” fusion, occurred more frequently in these cells [Citation28]. However, no such “bridge” fusion events occurred in our RGNNV-induced vacuolization processes. Thus, in our study, vacuole fusion in RGNNV-infected cells occurred in a rapid, “explosive” manner.
More importantly, Rab5 silencing significantly impaired RGNNV-induced vacuolization, and CO-IP analyses demonstrated that CP interacted with Rab5. Based on the key role of Rab5 in vesicle fusion, we hypothesized that RGNNV uses Rab5 to regulate vesicle fusion and facilitate vacuole enlargement. RGNNV-induced vacuoles also colocalized with Rab7 (unpublished data) and lysosomes [Citation11], suggesting that vacuolization is associated with the canonical endosome pathway and is likely to be a continuous dynamic process involving the sequential recruitment of key proteins. Association with the canonical endosome pathway has also been reported in some virus-induced vacuolization. SFV-induced vacuoles contain late endosomes and lysosomes but do not colocalize with early endosomes [Citation2]. SV40-induced vacuoles were stained with a series of endosomal marker proteins, including Rab5, Rab7, and LAMP1 (lysosome marker), and displayed a dynamic endocytic nature [Citation32]. During SV40 infection, Rab5-positive vacuoles gradually lost Rab5 and LAMP1 simultaneously [Citation34]. The induction of vacuolization by protease 3C of hepatitis A virus was found to be associated with lysosomal protein Lamp1 and GTPases including Rab5, Rab7, Rab9, and Rab11. This vacuolization process was effectively inhibited by the vacuolar ATPase inhibitor bafilomycin A1 and was not reliant on the activity of GTPases Rab5 and Rab7 [Citation35]. In addition to the endosome pathway, viruses also offer different choices for vacuolization. For example, ZIKV-induced large vacuoles may originate from endoplasmic reticulum (ER)-related membranes [Citation32].
The cytoskeleton plays a crucial role in virus life cycle [Citation36,Citation37]. Previous study has demonstrated that intact microtubules can facilitate influenza virus A (IAV) entry into cells [Citation38]. Additionally, the entry of Classical Swine Fever Virus (CSFV) is dependent on actin filaments, while microtubules play a significant role in the later stages of CSFV entry. Moreover, the co-localization of microfilaments with clathrin and Rab5, as well as microtubules with Rab7, has also been observed in cells [Citation39]. Several viruses, such as Herpes simplex virus, Flavivirus and Singapore grouper iridovirus (SGIV), have the capability to utilize actin or microtubules for transportation towards replication sites within cells [Citation15,Citation40,Citation41]. A study has demonstrated that a compound called 2-ethyl-3-O-sulphamoyl-estra-1,3,5(10)16-tetraene (ESE-16) can disrupt the normal maturation of endocytic vesicles, likely by inhibiting microtubule function [Citation42]. In this study, the enlargement of RGNNV-induced vacuoles required intact actin but not microtubules. Actin colocalizes with RGNNV-positive vacuoles in different patterns, including actin filaments, actin tails, and actin ring structures around RGNNV-positive vacuoles. Cytochalasin D and Nocodazole are chemicals that disrupt microfilaments and microtubules, respectively [Citation43]. In our research, actin disruption significantly impaired vacuole enlargement, perhaps because of the role of actin in vesicle transport. Thus, actin may serve as an important track for vacuole transport and may contribute to vacuole contact to initiate fusion. Accordingly, giant vacuoles rarely colocalize with actin. Microtubules were also located near vacuoles, but microtubule disruption had no effect on vacuolization. These observations indicate that vacuolization enlargement occurs mainly via actin.
In conclusion, a fluorogenic aptamer was used to label RGNNV particles, and RGNNV-induced vacuolization was explored. Our data showed that this mechanism occurred in a time- and virus-dose dependent manner, and required Rab5 and actin. This study provides new insights into the molecular mechanisms underlying RGNNV infections.
Ethics statement
All relevant ethical safeguards were met for animal experimentation, and all animal experiments in this study were approved by the Animal Care and Use Committee of the College of Marine Sciences, South China Agricultural University.
Disclosure statement
No potential conflict of interest was reported by the author(s).
Data Availability statement
The raw data supporting the conclusions of this article will be made available by the authors without undue reservation to any qualified researcher.
Additional information
Funding
References
- Dan J, Nie L, Jia X, et al. Visualization of the oncolytic alphavirus M1 life cycle in cancer cells. Virol Sin. 2021;36(4):655–17. doi: 10.1007/s12250-020-00339-7
- Kujala P, Ikaheimonen A, Ehsani N, et al. Biogenesis of the Semliki Forest virus RNA replication complex. J Virol. 2001;75(8):3873–3884. doi: 10.1128/JVI.75.8.3873-3884.2001
- Luo Y, Motamedi N, Magaldi TG, et al. Interaction between simian virus 40 Major capsid protein VP1 and cell surface ganglioside GM1 triggers vacuole formation, mBio. MBio. 2016;7(2):e00297. doi: 10.1128/mBio.00297-16
- Bandin I, Souto S. Betanodavirus and VER disease: a 30-year research review. Pathogens. 2020;9(2):106. doi: 10.3390/pathogens9020106
- Cheng CA, Luo JM, Chiang MH, et al. Nervous necrosis virus coat protein mediates Host translation shutoff through nuclear translocalization and degradation of polyadenylate binding protein. J Virol. 2021;95(17):e0236420. doi: 10.1128/JVI.02364-20
- Zhang Y, Dong F, Xing J, et al. Characterization of nervous necrosis virus (nnv) nonstructural protein b2 and its enhancement on virus proliferation. Viruses. 2022;14:2818. doi: 10.3390/v14122818
- Campo SOD, Díaz-Martínez L, Moreno P, et al. The genetic variability and evolution of red-spotted grouper nervous necrosis virus quasispecies can be associated with its virulence. Front Microbiol. 2023;15:1182695. doi: 10.3389/fmicb.2023.1182695
- Shetty M, Maiti B, Shivakumar Santhosh K, et al. Betanodavirus of marine and freshwater fish: distribution, genomic organization, diagnosis and control measures. Indian J Virol. 2012;23(2):114–123. doi: 10.1007/s13337-012-0088-x
- Munday BL, Kwang J, Moody N. Betanodavirus infections of teleost fish: a review. J Fish Dis. 2002;25(3):127–142. doi: 10.1046/j.1365-2761.2002.00350.x
- Liu J, Huang X, Yu Y, et al. Fish DDX3X exerts antiviral function against grouper nervous necrosis virus infection. Fish Shellfish Immunol. 2017;71:95–104. doi: 10.1016/j.fsi.2017.09.068
- Huang Y, Zhang Y, Liu Z, et al. Autophagy participates in lysosomal vacuolation-mediated cell death in RGNNV-Infected cells. Front Microbiol. 2020;11:790. doi: 10.3389/fmicb.2020.00790
- Brandenburg B, Zhuang X. Virus trafficking – learning from single-virus tracking. Nat Rev Microbiol. 2007;5(3):197–208. doi: 10.1038/nrmicro1615
- Liu SL, Wang ZG, Xie HY, et al. Single-virus tracking: from imaging methodologies to virological applications. Chem Rev. 2020;120(3):1936–1979. doi: 10.1021/acs.chemrev.9b00692
- Ichikawa S, Ishikawa K, Miyakawa H, et al. Live-cell imaging of the chloroplast outer envelope membrane using fluorescent dyes. Plant Direct. 2022;6(11):e462. doi: 10.1002/pld3.462
- Wang S, Huang X, Huang Y, et al. Entry of a novel marine DNA virus, Singapore grouper iridovirus, into host cells occurs via clathrin-mediated endocytosis and macropinocytosis in a pH-dependent manner. J Virol. 2014;88(22):13047–13063. doi: 10.1128/JVI.01744-14
- Bauer M, Strom M, Hammond DS, et al. Anything you can do, I can do better: can aptamers replace antibodies in clinical diagnostic applications? Molecules. 2019;24:4377. doi: 10.3390/molecules24234377
- Ali MH, Elsherbiny ME, Emara M. Updates on aptamer research. Int J Mol Sci. 2019;20(10):2511. doi: 10.3390/ijms20102511
- Zhang J, Wang L, Jaschke A, et al. A Color-Shifting Near-Infrared Fluorescent Aptamer–Fluorophore Module for Live-Cell RNA Imaging. Angew Chem Int Ed Engl. 2021;60(39):21441–21448. doi: 10.1002/anie.202107250
- Ge D, Chen J, Zhao Z, et al. Characterizing the function-related specific assembly pattern of matrix metalloproteinase-14 by dSTORM imaging. Talanta. 2023;260:124523. doi: 10.1016/j.talanta.2023.124523
- Kichkailo AS, Narodov AA, Komarova MA, et al. Development of DNA aptamers for visualization of glial brain tumors and detection of circulating tumor cells. Mol Ther Nucleic Acids. 2023;32:267–288. doi: 10.1016/j.omtn.2023.03.015
- Qin QW, Wu TH, Jia TL, et al. Development and characterization of a new tropical marine fish cell line from grouper, Epinephelus coioides susceptible to iridovirus and nodavirus. J Virol Methods. 2006;131(1):58–64. doi: 10.1016/j.jviromet.2005.07.009
- Zhou L, Li P, Yang M, et al. Generation and characterization of novel DNA aptamers against coat protein of grouper nervous necrosis virus (GNNV) with antiviral activities and delivery potential in grouper cells. Antiviral Res. 2016;129:104–114. doi: 10.1016/j.antiviral.2016.02.009
- Yu Y, Li C, Liu J, et al. Palmitic acid promotes virus replication in fish cell by modulating autophagy flux and TBK1-IRF3/7 Pathway. Front Immunol. 2020;11: 1764. doi: 10.3389/fimmu.2020.01764
- Li C, Wang L, Zhang X, et al. Molecular cloning, expression and functional analysis of Atg16L1 from orange-spotted grouper (Epinephelus coioides). Fish Shellfish Immunol. 2019;94:113–121. doi: 10.1016/j.fsi.2019.09.004
- Yu Y, Yang Z, Sun F, et al. Two SNPs in SNX2 are associated with SGIV resistance in Asian seabass. Aquaculture. 2021;540:736695. doi: 10.1016/j.aquaculture.2021.736695
- Lai YX, Jin BL, Xu Y, et al. Immune responses of orange-spotted grouper, Epinephelus coioides, against virus-like particles of betanodavirus produced in Escherichia coli. Vet Immunol Immunopathol. 2014;157(1–2):87–96. doi: 10.1016/j.vetimm.2013.10.003
- Homma Y, Hiragi S, Fukuda M. Rab family of small GTPases: an updated view on their regulation and functions. FEBS J. 2021;288(1):36–55. doi: 10.1111/febs.15453
- Roberts RL, Barbieri MA, Pryse KM, et al. Stahl, endosome fusion in living cells overexpressing GFP-rab5. J Cell Sci. 1999;112(Pt 21):3667–3675. doi: 10.1242/jcs.112.21.3667
- Cui ZQ, Ren Q, Wei HP, et al. Quantum dot–aptamer nanoprobes for recognizing and labeling influenza A virus particles. Nanoscale. 2011;3(6):2454–2457. doi: 10.1039/c1nr10218d
- Yan Q, Lu Y, Zhou L, et al. Mechanistic insights into GLUT1 activation and clustering revealed by super-resolution imaging. Proc Natl Acad Sci U S A. 2018;115(27):7033–7038. doi: 10.1073/pnas.1803859115
- Peranen J, Kaariainen L. Biogenesis of type I cytopathic vacuoles in Semliki Forest virus-infected BHK cells. J Virol. 1991;65(3):1623–1627. doi: 10.1128/jvi.65.3.1623-1627.1991
- Monel B, Compton AA, Bruel T, et al. Zika virus induces massive cytoplasmic vacuolization and paraptosis-like death in infected cells. EMBO J. 2017;36(12):1653–1668. doi: 10.15252/embj.201695597
- Foo NC, Ahn BY, Ma X, et al. Cellular vacuolization and apoptosis induced by hepatitis B virus large surface protein. Hepatology. 2002;36(6):1400–1407. doi: 10.1002/hep.1840360616
- Motamedi N, Sewald X, Luo Y, et al. SV40 polyomavirus activates the ras-MAPK signaling pathway for vacuolization, cell death, and virus release. Viruses. 2020;12(10):1128. doi: 10.3390/v12101128
- Shubin AV, Demidyuk IV, Lunina NA, et al. Protease 3C of hepatitis a virus induces vacuolization of lysosomal/endosomal organelles and caspase-independent cell death. BMC Cell Biol. 2015;16(1):4. doi: 10.1186/s12860-015-0050-z
- Wang IH, Burckhardt CJ, Yakimovich A, et al. Imaging, tracking and computational analyses of virus entry and egress with the Cytoskeleton. Viruses. 2018;10(4):166. doi: 10.3390/v10040166
- Wen Z, Zhang Y, Lin Z, et al. Cytoskeleton—a crucial key in host cell for coronavirus infection. J Mol Cell Biol. 2020;12(12):968–979. doi: 10.1093/jmcb/mjaa042
- Simpson C, Yamauchi Y. Microtubules in Influenza Virus Entry and Egress. Viruses. 2020;12(1):117. doi: 10.3390/v12010117
- Cheng Y, Lou JX, Liu CC, et al. Microfilaments and microtubules alternately coordinate the multi-step endosomal trafficking of classical swine fever virus. J Virol. 2021;95(10):e02436–20. doi: 10.1128/JVI.02436-20
- Danastas K, Larsen A, Jobson S, et al. Herpes simplex virus-1 utilizes the host actin cytoskeleton for its release from axonal growth cones. PLOS Pathog. 2022;18(1):e1010264. doi: 10.1371/journal.ppat.1010264
- Zhang Y, Gao W, Li J, et al. The role of host cytoskeleton in flavivirus infection. Virol Sin. 2019;34(1):30–41. doi: 10.1007/s12250-019-00086-4
- Nkandeu SD, Bout IV, Cronjé MJ, et al. A novel 2-Methoxyestradiol analogue is responsible for vesicle disruption and lysosome aggregation in breast cancer cells. Pharmacology. 2018;102(1–2):9–16. doi: 10.1159/000487443
- Campbell EA, Reddy VRAP, Gray AG, et al. Discrete virus factories form in the cytoplasm of cells coinfected with two replication-competent tagged reporter birnaviruses that subsequently coalesce over time. J Virol. 2020;94(13):e02107–19. doi: 10.1128/JVI.02107-19