
ABSTRACT
Helicobacter pylori is a pathogenic bacterium that causes gastritis and gastric carcinoma. Besides gastric complications its potential link with gut-brain axis disruption and neurological disorders has also been reported. The current study investigated the plausible role and its associated molecular mechanism underlying H. pylori mediated gut-brain axis disruption and neuroinflammation leading to neurological modalities like Alzheimer’s disease (AD). We have chosen the antimicrobial resistant and susceptible H. pylori strains on the basis of broth dilution method. We have observed the increased inflammatory response exerted by H. pylori strains in the gastric as well as in the neuronal compartment after treatment with Helicobacter pylori derived condition media (HPCM). Further, elevated expression of STAT1, STAT3, and AD-associated proteins- APP and APOE4 was monitored in HPCM-treated neuronal and neuron-astrocyte co-cultured cells. Excessive ROS generation has been found in these cells. The HPCM treatment to LN229 causes astrogliosis, evidenced by increased glial fibrillary acidic protein. Our results indicate the association of STAT3 as an important regulator in the H. pylori-mediated pathogenesis in neuronal cells. Notably, the inhibition of STAT3 by its specific inhibitor, BP-1-102, reduced the expression of pSTAT3 and AD markers in neuronal compartment induced by HPCM. Thus, our study demonstrates that H. pylori infection exacerbates inflammation in AGS cells and modulates the activity of STAT3 regulatory molecules. H. pylori secretome could affect neurological compartments by promoting STAT3 activation and inducing the expression of AD-associated signature markers. Further, pSTAT-3 inhibition mitigates the H. pylori associated neuroinflammation and amyloid pathology.
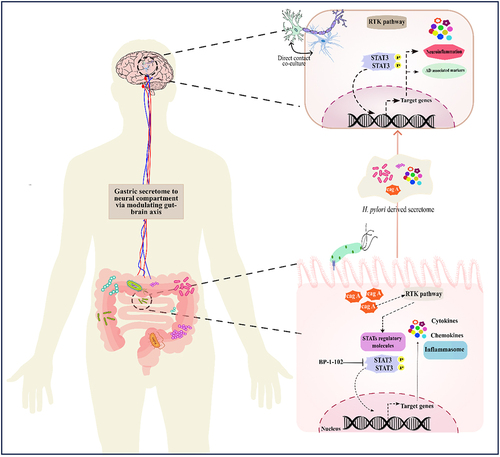
GRAPHICAL ABSTRACT
Introduction
Helicobacter pylori is a spiral-shaped, gram-negative bacterial pathogen that selectively colonizes the gastric epithelium, infecting more than half of the global population [Citation1,Citation2]. This bacterium is primarily associated with gastritis, gastric adenocarcinoma, MALT (mucosa-associated lymphoid tissue), and other gut-associated diseases [Citation3]. H. pylori’s urease neutralizes the high gastric acidity and facilitates bacterial colonization within the gastric mucosa [Citation4]. Once the bacterium adheres to the host cell, the pilus formed by T4SS (type IV secretion system) facilitates the delivery of CagA, the primary effector molecule. It then prompts cellular changes that hinder cell motility, impedes cellular proliferation, and influence apoptosis [Citation5]. Besides CagA, other factors like VacA, BabA, and SabA also significantly modulate the host response and molecular pathogenesis [Citation6].
The approach to address H. pylori infection has developed from the standard triple therapy and concomitant quadruple therapy to more contemporary treatments such as Vonoprazan-based dual therapy [Citation7]. In recent years, there has been a notable rise in the occurrence of multidrug-resistant (MDR) strains of H. pylori, accompanied by consistent accounts of difficulties in effectively eliminating the pathogen [Citation8]. In dealing with H. pylori resistance, medical practitioners might shift to broad-spectrum antibiotics that may disrupt the natural gut microbiota equilibrium [Citation9,Citation10]. Several studies revealed that such disruption in the composition of the gut microbiome can result in gut dysbiosis [Citation11,Citation12]. One of the studies suggested remarkable changes in gastric microbiome composition between H. pylori-positive and negative individuals [Citation13]. In recent decades, an association has been established between gut dysbiosis and various health issues encompassing neurological abnormalities [Citation14].
The spectrum of disorders caused by H. pylori is not limited to the gastrointestinal tract. Several studies suggested that gastric colonization with H. pylori can lead to a variety of extra gastric diseases, specifically neurological deformities [Citation15–17]. Uberti et al. proposed a significant contribution of H. pylori’s urease enzyme to the onset of extra-gastric ailments, such as Alzheimer’s disease (AD) [Citation18]. However, the precise mechanisms and signalling pathways driving these neuropathological conditions are yet to be fully understood.
Upon H. pylori infection, the release of virulence factors triggers subsequent signalling cascades and related processes. These encompass the activation of the nuclear factor κB (NF-κB) pathway [Citation19], ERK/MAPK signalling pathway [Citation20], and cytokine-mediated JAK-STAT signalling system [Citation21]. The JAK/STAT cascade is a crucial signal transduction pathway upon H. pylori infection [Citation22]. Multiple cytokines modulate this intricate pathway and vice versa [Citation23,Citation24], serving a dual role in governing cell proliferation and cell death. In many regions of the brain, these activated cytokines promotes cell inflammation and cause cell death There are well-established studies suggesting the crucial role of the JAK/STAT signalling pathway as a key driver of neuroinflammation in the onset of neurodegenerative diseases [Citation25,Citation26]. The divergent modulation of the JAK/STAT pathway convey pathological implications for neuroinflammatory illnesses, primarily by triggering and polarizing myeloid cells and T cells to pathogenic phenotypes [Citation25].
In the current study, we assessed the effect of antimicrobial-resistant (AMR) H. pylori strains on brain physiology. We investigated the in-vitro effects of H. pylori-conditioned medium (HPCM) from gastric epithelial AGS cells on neuronal cells and the neuron-astrocyte co-culture model. Precisely, our study aims to decipher the effect of H. pylori-derived secretome on neuroinflammation and neurological modalities associated with AD. The findings suggest that HPCM exacerbates neuroinflammation, along with altered expression of STATs regulatory molecules and AD-associated hallmarks. This study may provide a molecular basis for modulation of the gut-brain axis and its associated neurological complications in H. pylori-mediated pathogenesis.
Results
Assessment of AMR in H. pylori isolates
Arising resistance to first-line antibiotics is a major concern in tackling H. pylori infections and associated pathogenesis [Citation27]. To understand AMR in our clinical strains, we assessed the antibiotic susceptibility of H. pylori isolates to three antibiotics: metronidazole, amoxycillin, and clarithromycin, used as a part of concomitant quadruple therapy. The results showed that all isolates were susceptible to clarithromycin, with MICs ranging from 0.25 μg/ml to 1 μg/ml except for three isolates (HB1, HB5, and HJ17). In the case of metronidazole, most isolates exhibited resistance, with MICs ranging from 4 μg/ml to 16 μg/ml, except for one isolate (HJ9) that was found to be susceptible. All the tested isolates of H. pylori were also found to be resistant to amoxycillin, with MICs ranging from 0.0625 μg/ml to 0.25 μg/ml. However, two isolates (HJ9 and I10) showed susceptibility to amoxycillin. Interestingly, HJ10 and HJ14 displayed a unique susceptibility pattern to amoxycillin, being susceptible at concentrations of 0.125 and above (table S1). Thus, our results revealed that clarithromycin exhibited good efficacy against most H. pylori isolates involved in our study compared to the other two antibiotics. Based on AMR status, we selected three strains for our future experiments: HJ9-triple sensitive (—), HB10-partial resistant (±+), and HB1-triple resistant bacteria (+++) (table S1).
H. pylori infection and its pathogenic activity are associated with inflammatory responses in the gastric environment
Both acute and chronic infection of H. pylori is critical for developing inflammation and subsequent gastritis [Citation28]. Notably, the chronic inflammatory milieu during H. pylori infection triggers various host-associated intracellular signalling, including inflammatory signalling. To understand the profile of inflammatory genes’ transcripts in gastric (AGS) cells after exposure to H. pylori isolates as demonstrated in the figure (, Infection strategy I), we performed qRT-PCR for a set of H. pylori-associated genes (16s rRNA and cagA), crucial inflammatory genes (cytokines and chemokines), and transcription factors (STAT1, STAT2, and STAT3). Importantly, we observed the significantly elevated expression of 16s rRNA (p < 0.01) and cagA (p < 0.05) at 24 hpi with HB10, HJ9 and HB1 ( and ). Further, the relative transcript expression of pro-inflammatory cytokines such as TNFα (p < 0.01), IL6, IL16, IL-1β (p < 0.001), and chemokines like CXCL1 and CXCL3 (p < 0.01); CXCL5 and CCL5 (p < 0.05) were found to be significantly enhanced in H. pylori-infected gastric cells compared to control. However, the most robust inflammatory responses were observed in cells exposed to HB1 and HJ9 strains compared to uninfected cells (). Moreover, we also determined the expression of essential transcription and regulatory factors, i.e., STATs. Significantly upregulated expression of STAT1 and STAT3 (p < 0.001); however, reduced expression of STAT2 (p < 0.001) was observed in H. pylori-infected gastric cells compared to control ().
Figure 1. Infection strategies illuminate the intricate molecular mechanisms through which H. pylori contributes to the pathophysiology of gastric disorders and neurological anomalies. Schematic illustration of selected studied infection strategy-I and II. (a) AGS cells were seeded in a 60 mm plate, and H. pylori isolates (HB10, HJ9, and HB1) were directly incubated with these seeded cells for 24 hrs. Meanwhile, the conditioned media (HPCM) and cell pellets were collected (infection strategy I). (b) AGS cells were priorly treated with STAT3i for 2 hrs followed by the H. pylori infection by respective strains for 24 hrs. Likewise, the conditioned media (STAT3i treated HPCM) and cell pellets were collected (infection strategy II). (c) neuronal IMR-32 cells and neuron-astrocyte co-cultured cells were incubated with HPCM or STAT3i treated HPCM for 24 hrs in a ratio of 7:3 (cDMEM: HPCM or STAT3i treated HPCM).
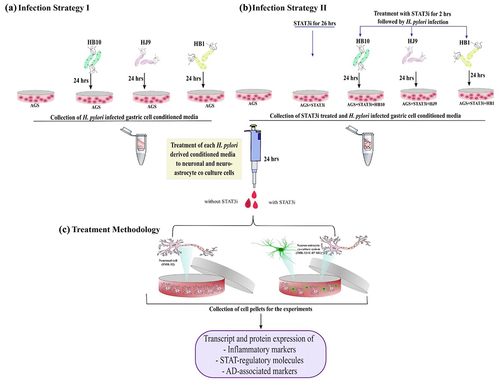
Figure 2. H. pylori infection induces inflammation in gastric epithelial cells. Relative transcript expression of H. pylori-associated gene (a) 16s rRNA, (b) cagA, (c) heat map showing the relative transcript expression of various pro-inflammatory cytokines and chemokines and STAT family members after infection with H. pylori strains (HB10, HJ9, HB1) to AGS cells for 24 hrs. (d) A representative western blot image of STAT1 and 3. Quantification of western blot through image J software of (di) STAT1, (dii) STAT3 after infection with H. pylori strains (HB10, HJ9, HB1) to AGS cells for 24 hrs. (e) A representative western blot image of tNFΑ and caspase 3. Quantification of western blot through image J software of (ei) TNFα, (eii) caspase 3 after infection with H. pylori strains (HB10, HJ9, HB1) to AGS cells for 24 hrs. The experiment was performed for two biological and two technical replicates (four data points), and the results are shown as the mean ± SD for three data points. An unpaired T-test was used to analyze the data. p < 0.05 was considered significant in all the cases. p-values of < 0.05, < 0.01 and < 0.0001 were represented with *, ** and *** respectively for significant upregulation and #, ##, and ### for significant downregulation.
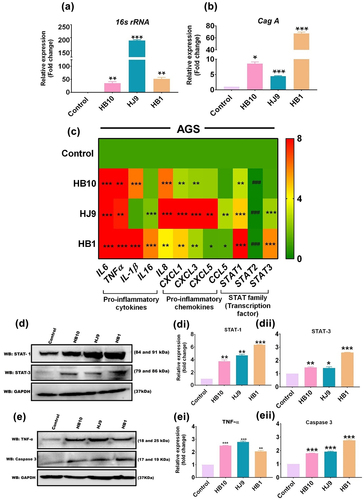
Further, investigation of selected inflammatory markers and STATs through western blot analysis demonstrated a significantly enhanced expression of STAT1 (p < 0.01); STAT3 (p < 0.05); TNFα (p < 0.01); and Caspase-3 (p < 0.001) in H. pylori-infected AGS cells ( and ).
Augmentation of immunological responses in brain cells upon exposure to H. pylori-derived secretome
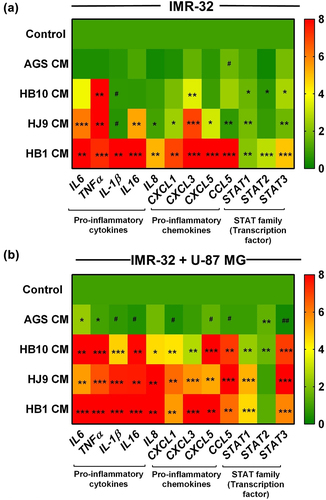
Numerous studies have suggested that neuroinflammation contributes to the pathogenic progression of neurological ailments. Mainly, pro-inflammatory molecules are found to be colocalized with neurodegenerative pathologies. To understand the plausible role of H. pylori in provoking neuroinflammation, we treated the neuroblastoma (IMR-32) and neuron-astrocyte co-cultured cells (IMR-32 and U-87 MG) with the conditioned media from H. pylori-infected gastric cells (, Treatment methodology) and checked for the transcript expression of various cytokines, chemokines, and STAT transcription factors. In neuroblastoma cells upon treated with HB1-CM, we have observed the significantly elevated expression of pro-inflammatory cytokines: IL6, TNFα, IL16, IL-1β, and IL8 (p < 0.01); chemokines: CXCL1, CXCL3, CXCL5, and CCL5 (p < 0.01) and STATs regulatory molecules: STAT1, STAT2, and STAT3 (p < 0.01) compared to control. In addition, we found enhanced expression of all pro-inflammatory and regulatory markers (p < 0.05) in HB10, and HJ9-CM treated neuronal cells except IL-1β, which exhibited lesser expression (p < 0.05) (). Likewise, the pattern of inflammatory response of the neuron-astrocyte co-culture model against HPCM was observed. Our result demonstrated the enhanced expression of IL6, TNFα, IL16, IL-1β, IL8, CXCL1, CXCL3, CXCL5, STAT1, and STAT3 (p < 0.01) in all three HPCM-treated co-cultured cells (). It is suggested that upon exposure of HPCM to the neural cell, there is a transient increase in the inflammatory moieties.
Figure 3. H. pylori-derived secretome promotes inflammation in neuroblastoma and neuron-astrocytes co-cultured cells. Heat map showing the relative transcript expression of various pro-inflammatory cytokines and chemokines and STAT family members after treatment with HPCM to (a) IMR-32 cells, (b) IMR-32+U-87 MG co-cultured cells for 24 hrs. The experiment was performed for two biological and two technical replicates (four data points), and the results are shown as the mean ± SD for three data points. An unpaired t-test was used to analyze the data. p < 0.05 was considered significant in all the cases. p-values of < 0.05, < 0.01 and < 0.0001 were represented with *, ** and *** respectively for significant upregulation and #, ##, and ### for significant downregulation.
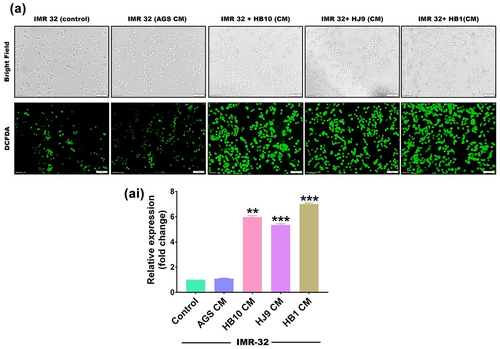
H. pylori-derived secretome provokes oxidative stress in the neural compartment
pylori infection is known to instigate oxidative stress in gastric epithelial cells. We assessed the ROS to investigate the possibility of similar pathology in HPCM-treated neurons and co-cultured cells. A redox-sensitive fluorescent dye 2′-7′-Dichlorodihydrofluorescein diacetate (H2-DCFDA) was used to measure ROS production in HPCM-treated neuronal and co-culture systems. We have observed that HPCM treatment significantly induced ROS in neuronal cells in comparison to control (p < 0.01) (). Additionally, more robust oxidative stress was found in co-cultured cells exposed to HPCM (p < 0.001) (Figure S1). This suggests the ability of H. pylori secretome to induce oxidative stress in the cerebral cells.
Figure 4. H. pylori-derived secretome prompts the oxidative stress in neuroblastoma cells. The first row represents a bright field image, and the second row represents the fluorescence microscopy image showing the total cellular ROS upon exposure with HPCM to (a) IMR-32 cells for 12 hrs. Meanwhile, we determined the significantly enhanced cellular ROS production quantified through image J software and represented in fold change. The experiment was performed for two biological and two technical replicates (four data points), and the results are shown as the mean ± SD for three data points. An unpaired t-test was used to analyse the data. p < 0.05 was considered significant in all the cases. p-values of < 0.05, < 0.01 and < 0.0001 were represented with *, ** and *** respectively for significant upregulation and #, ##, and ### for significant downregulation.
H. pylori secretome-associated STATs activation and its connection to markers of Alzheimer’s disease
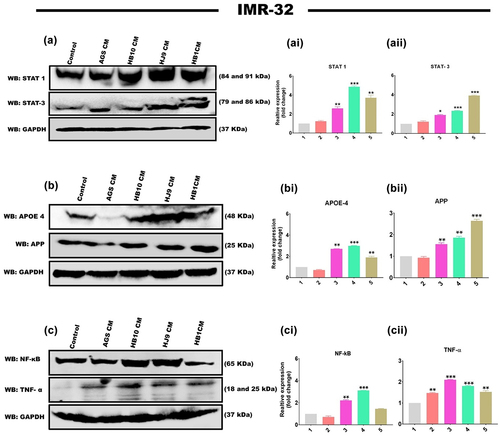
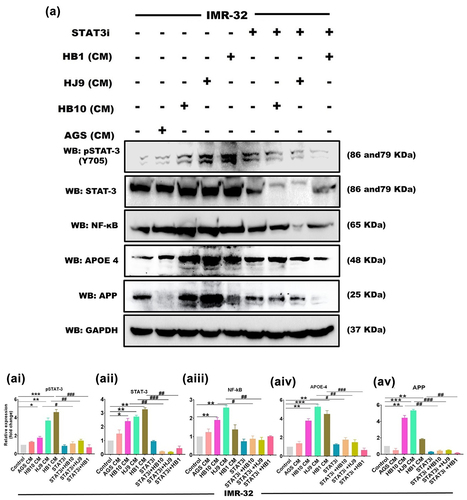
H. pylori infection has been shown to increase the expression of STATs regulatory molecules in gastrointestinal disorders. We also determined an increased transcript level of STAT1 and STAT3 in HPCM-treated neuronal and co-cultured cells. To further verify the plausible association of STATs in H. pylori secretion-mediated neurological complications, we assessed the protein expression of STAT family members (STAT1 and STAT3) and AD markers (APP and APOE4) in neuronal and co-cultured cells treated with HPCM. We have observed significantly enhanced expressions of STAT1 (p < 0.01, p < 0.001, p < 0.01) and STAT3 (p < 0.05, p < 0.001, p < 0.001) in HB10, HJ9 and HB1-CM-treated IMR-32 cells ( and ). Further, a significant increase was found in the protein expression of APP (p < 0.01, p < 0.01, p < 0.001) and APOE4 (p < 0.01, p < 0.001, p < 0.01) in IMR-32 cells exposed to respective HPCM for 24 hrs (). Additionally, we found a significantly upregulated expression of inflammatory protein NF-κB (p < 0.01, p < 0.001) and TNFα (p < 0.001, p < 0.001, p < 0.01) in IMR-32 cells upon exposure to respective HPCM, compared to control (). Likewise, in the co-culture model, a similar augmented expression of STAT1, STAT3 (p < 0.001) (Figure S2 AI and AII), APP (p < 0.05, p < 0.001, p < 0.01), APOE4 (p < 0.01, p < 0.001, p < 0.01) (Figure S2 BI and BII), NF-κB, and TNFα (p < 0.01 p < 0.001, p < 0.01) was found compared to control cells (Figure S2 CI and CII).
Figure 5. H. pylori-derived secretome induces STAT activation and associated AD markers. the relative protein expression of inflammatory markers, STAT regulatory molecules, and AD-associated hallmarks was determined by western blot of neuronal cells treated with HPCM for 24 hrs. A Representative western blot image of STAT1 and STAT3 in (a) IMR-32 cells. Graphical representation of the relative expression of STAT1 and STAT3 in (ai and aii) IMR-32 cells. Representative western blot image of AD-associated markers, APP, and APOE4 in (b) IMR-32 cells. Quantification of western blot image of (bi) APOE4, (bii) APP in IMR-32 cells. A representative western blot image of inflammatory markers like NF-κB and tNFΑ in (c) IMR-32 cells. Quantification of western blot image of (ci) NF-κB, (cii) TNFα in IMR-32 cells. The data showed significantly enhanced protein expression of these markers. The quantification was performed through image J software and represented fold change. The experiment was performed for two biological and two technical replicates (four data points), and the results are shown as the mean ± SD for three data points. An unpaired t-test was used to analyze the data. p < 0.05 was considered significant in all the cases. p-values of < 0.05, < 0.01 and < 0.0001 were represented with *, ** and *** respectively for significant upregulation and #, ##, and ### for significant downregulation.
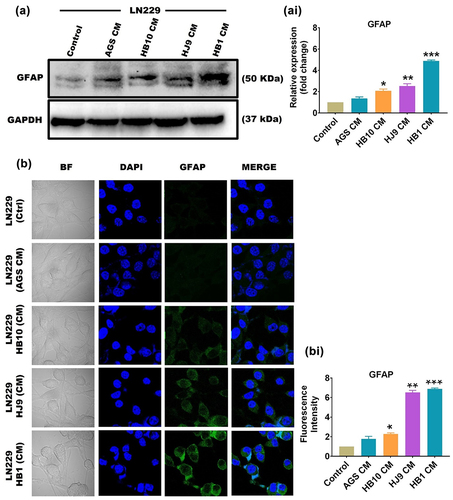
Astrocytic reactivation in LN229 cells upon treatment with H. pylori-derived secretome
Astrocytes get activated in response to inflammatory processes during pathological developments linked with neurodegenerative disorders. This activation leads to the emergence of reactive astrocytes that accompany disease progression and pathogenesis. In order to determine the astrocytic reactivation, we have checked the protein expression of Glial fibrillary acidic protein (GFAP), a specific marker for reactive astrocytes, in GFAP-positive astrocytic cell line LN229 upon exposure to HPCM through western blot and immunofluorescence assay. We have found a significant increase in the protein level of GFAP in HPCM-treated LN229 cells (p < 0.05, p < 0.01, and p < 0.001) compared to untreated LN229 cells ( and ).
Figure 6. HPCM induces astrocytic reactivation of LN229 cells. (a) A representative western blot image of GFAP in LN229 cells after treatment with HPCM for 24 hrs. (ai) quantification of western blot data through image J software and represented in fold change. (b) A representative confocal microscopy image of GFAP in LN229 cells after HPCM treatment for 24 hrs. The 1st row represents untreated cells, whereas the 2nd to 5th row represents the LN229 cells treated with AGS-CM, HB10, HJ9, and HB1-CM. (bi) quantification of the intensity of fluorescence images through image J software and represented in fold change. Both western blot and immunofluorescence data showed significantly enhanced expression of GFAP in HPCM-treated cells. The experiment was performed for two biological and two technical replicates (four data points), and the results are shown as the mean ± SD for three data points. An unpaired t-test was used to analyse the data. p < 0.05 was considered significant in all the cases. p-values of < 0.05, < 0.01 and < 0.0001 were represented with *, ** and *** respectively for significant upregulation and #, ##, and ### for significant downregulation.
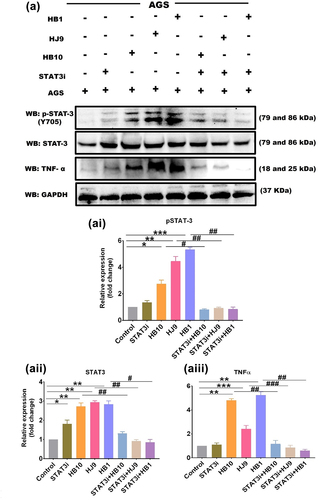
STAT3i depletes the level of pSTAT3 in H. pylori infected gastric epithelial cells
To validate STAT3-mediated gastric inflammation upon H. pylori infection, STAT3 was inhibited in gastric cells prior to H. pylori infection (, Infection strategy II). The result demonstrated a significant reduction in the transcript expression of STAT3 in BP-1-102-exposed H. pylori-infected AGS cells (p < 0.01) (Figure S3 A). However, at the protein level, the pSTAT3 and STAT3 expression was significantly enhanced in H. pylori-infected AGS cells, and the expression was significantly reduced (p < 0.05) in inhibitor-treated and H. pylori-infected AGS cells in comparison to control ( and ). Further, pSTAT3 inhibition also leads to a reduced TNFα protein expression in all three infected panels: HB10, HJ9, and HB1 (p < 0.01) (). Thus, providing evidence for controlling the inflammatory response.
Figure 7. BP-1-102 inhibited the expression of STAT3 in H. pylori-infected gastric epithelial cells. (a) A representative western blot image of pSTAT3, STAT3, and tNFΑ in AGS cells after BP-1-102 treatment for 2 hrs followed by H. pylori infection with HB10, HJ9, and HB1 for 24 hrs. Quantification of western blot images of (ai) pSTAT3, (aii) STAT3, (aiii) TNFα through image J software and data was represented in fold change. Data represents significantly reduced expression of pSTAT3, STAT3, and TNFα in STAT3i treated followed by H. pylori infected AGS cells. The experiment was performed for two biological and two technical replicates (four data points), and the results are shown as the mean ± SD for three data points. An unpaired t-test was used to analyze the data. p < 0.05 was considered significant in all the cases. p-values of < 0.05, < 0.01 and < 0.0001 were represented with *, ** and *** respectively for significant upregulation and #, ##, and ### for significant downregulation.
BP-1-102 treated H. pylori-derived secretome diminishes pSTAT3 and associated neurodegenerative signature molecules in the neural compartment
STAT family members play a potential role in neurodegenerative diseases, particularly in the context of AD’s pathophysiology. This prompts us to examine the possibility of HPCM-mediated STATs activation and AD marker upregulation at transcript and protein levels in IMR-32 and IMR-32+U-87 MG co-culture cells incubated with STAT3i-treated HPCM ( Treatment methodology). The results showed that STAT3i treated HPCM significantly reduced the transcript level of STAT3 (p < 0.05) (Figure S3 B), and AD-associated genes such as APP, BACE1 (p < 0.01); APOE4, PSEN1 (p < 0.05) in IMR-32 cells compared to untreated infected cells (). Further, we found that STAT3i treated HB10, HJ9, and HB1 CM demonstrated a significant reduction in the protein expression of pSTAT3 (p < 0.05, p < 0.01, p < 0.001), STAT3 (p < 0.01, p < 0.001, p < 0.01), APP (p < 0.01, p < 0.001, p < 0.01), APOE4 (p < 0.05, p < 0.01, p < 0.001). Moreover, we also observed the reduced expression of NF-κB (p < 0.05, p < 0.01) in IMR-32 cells incubated with STAT3i-treated HPCM ().
Figure 8. STAT3i treated H. pylori-derived secretome diminishes transcript expression of STAT3 and AD-associated signature genes in the neural compartment. A relative transcript expression of various neurological disease markers such as APP, APOE4, PSEN1, and BACE1 after exposure with STAT3i treated HPCM (a) IMR-32 cells, (b) IMR-32-U-87 MG co-cultured cells for 24 hrs. The experiment was performed for two biological and two technical replicates (four data points), and the results are shown as the mean ± SD for three data points. An unpaired t-test was used to analyze the data. p < 0.05 was considered significant in all the cases. p-values of < 0.05, < 0.01 and < 0.0001 were represented with *, ** and *** respectively for significant upregulation and #, ##, and ### for significant downregulation.
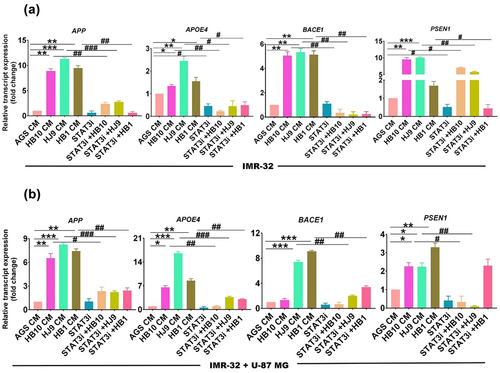
Figure 9. STAT3i treated H. pylori-derived secretome inhibits pSTAT3 and associated neurodegenerative signature molecules in the neural compartment. A representative western blot image of STAT3, pSTAT3, NF-κB and AD markers such as APOE4 and APP after exposure with STAT3i treated HPCM to (a) IMR-32 cells for 24 hrs. Quantification of (ai) pSTAT3, (AII) STAT3, (AIII) NF-κB, (AIV) APOE4, (AV) APP in IMR-32 cells through image J software and represented in terms of fold change. The experiment was performed for two biological and two technical replicates (four data points), and the results are shown as the mean ± SD for three data points. An unpaired t-test was used to analyze the data. p < 0.05 was considered significant in all the cases. p-values of < 0.05, < 0.01 and < 0.0001 were represented with *, ** and *** respectively for significant upregulation and #, ##, and ### for significant downregulation.
Analogously, in the co-culture model, we observed the reduced transcript expression of STAT3 (p < 0.01) (Figure S3 C), and AD-associated signature genes such as APOE4, BACE1 (p < 0.01); APP, PSEN1 (p < 0.05) (). In addition, we found a significantly diminished protein expression of pSTAT3 (p < 0.01, p < 0.001, p < 0.01), STAT3 (p < 0.01, p < 0.001, p < 0.01), APP (p < 0.01, p < 0.001, p < 0.01), and APOE4 (p < 0.05, p < 0.01, p < 0.001) in co-culture cells incubated with STAT3i treated HPCM (Figure S4 AI-AV).
Additionally, the study of STAT1 and pSTAT1 in neural and co-culture model exposed to BP-1-102 treated HPCM demonstrated a significant decrease in the expression level of total STAT1 (p < 0.01) (). Moreover, the level of pSTAT1 remains unchanged in all the samples in neural and co-cultured cells (Figure S5 AI and BI).
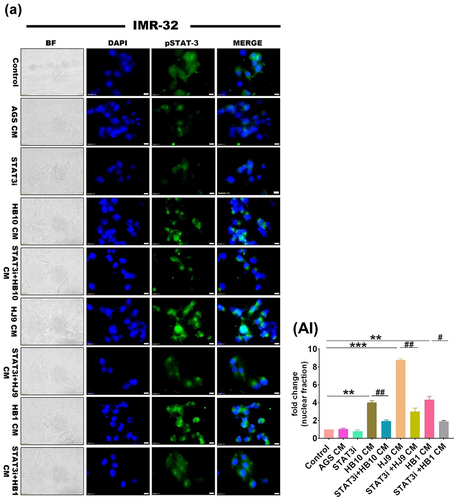
H. pylori-derived secretome-induced STAT3 nuclear translocation in the neural compartment
Activated STAT3 phosphorylates, dimerizes, and triggers the transcription of its nuclear target genes. Next, we have checked whether HPCM can promote the nuclear translocation of pSTAT3 through immunofluorescence assay. As a result, phosphorylated STAT3 was detected predominantly in the perinuclear region or within the nuclear compartment of IMR-32 cells treated with HPCM (p < 0.01) (). Surprisingly, we observed superfluous nuclear translocation of pSTAT3 in IMR-32 cells treated with HJ9-CM (p < 0.001) compared to control and other treated experimental setups. However, the nuclear translocation of pSTAT3 was significantly reduced in IMR-32 cells exposed to STAT3i-treated HPCM (p < 0.01) ().
Figure 10. H. pylori derived secretome induced STAT3 nuclear translocation in neuroblastoma cells. A representative fluorescence image of pSTAT3 in IMR-32 cells after STAT3i followed by HPCM treatment for 24 hrs. The 1st row represents untreated cells whereas the 2nd to 9th row represents the IMR-32 cells treated with AGS-CM, STAT3i CM, HB10 CM, STAT3i+HB10 CM, HJ9 CM, STAT3i+HJ9 CM, HB1 CM, and STAT3i+HB1 CM. (BII) quantification of fluorescence intensity of images through image J software and represented in fold change. The immunofluorescence data showed significantly reduced expression of pSTAT3 and lesser nuclear translocation in STAT3i-HPCM-treated cells. The experiment was performed for two biological and two technical replicates (four data points), and the results are shown as the mean ± SD for three data points. An unpaired t-test was used to analyze the data. p < 0.05 was considered significant in all the cases. p-values of < 0.05, < 0.01 and < 0.0001 were represented with *, ** and *** respectively for significant upregulation and #, ##, and ### for significant downregulation.
Discussion
The interaction of the cerebral environment with the gastrointestinal microbiota plays a pivotal role in maintaining brain homoeostasis and shapes cerebral development [Citation17]. The signalling along this axis is altered by a variety of intrinsic and extrinsic stimuli, which modulate the activity of the central and enteric nervous systems [Citation29]. This interaction is fostered by pathways like the vagus nerve, immune system, and gut bacterial metabolites [Citation30]. The altered composition of the gut microbial population modulates the cerebral milieu [Citation31]. H. pylori is an epsilon proteobacterium residing in the stomach of more than half of the world’s population. It is known to cause chronic gastritis and gastric cancer besides dysbiosis of the gut environment. Recent studies have suggested the association of multiple neurological complications such as dementia, brain stroke and AD [Citation15,Citation16,Citation32]. However, the molecular mechanism and associated pathological alterations in H. pylori-mediated neural complications remain elusive.
Our study tried to find the effect of H. pylori-derived secretome on neuroinflammation and AD markers. We used neuroblastoma cell (IMR-32) cells treated with H. pylori-infected AGS cells conditioned media for this. Moreover, the neurons are nurtured and protected by supporting cells such as astrocytes and microglia. These cells play a crucial role in neuroinflammation and other associated pathology. Neuron-astrocyte co-culture has been used previously to understand neuroinflammation by different studies [Citation33,Citation34]. We have also used a direct contact neural-astrocyte co-culture model involving IMR-32 and U-87 MG cells to understand the plausible effect of HPCM on the cerebral compartment.
The rise of multidrug or antimicrobial-resistant H. pylori strains, causing eradication failures, presents a significant challenge [Citation8]. However, the impact of multidrug-resistant H. pylori strains on the neural milieu must be investigated in more detail. Multiple clinical isolates have shown resistance against the most recent concomitant quadruple therapy involving antibiotics like clarithromycin, metronidazole, and amoxycillin, posing a great threat to H. pylori eradication. To gain more understanding of the plausible mechanism of AMR H. pylori strains in inducing neuroinflammation which may lead to the neurological disorders. In the current study, we have used three clinical strains of H. pylori, which are triple resistant (HB1), triple sensitive (HJ9), and partial resistant (HB10) to clarithromycin, metronidazole, and amoxycillin.
H. pylori elicits inflammatory markers resulting in gastrointestinal inflammation [Citation35]. Our results from the transcript profile of AGS cells upon H. pylori infection also showed the elevated expression of pro-inflammatory molecules. As cytokines are potent inducers of JAK/STAT signalling, we monitored STAT activation in response to H. pylori infection. Persistent activation of the JAK/STAT pathway is significantly involved in developing gastric inflammation [Citation36]. Additionally, H. pylori infection also induces the activation of STAT1 and STAT3 [Citation37]. Our study also revealed the enhanced expression of STAT1 and STAT3 in gastric epithelial cells infected with HB10, HJ9, and HB1.
Gut microbial secretions might enter the brain via the vagus nerve and further induce neuropathology, modulating the gut-brain axis. Extracellular vesicles from Paenalcaligenes hominis are proven to penetrate the brain via the bloodstream and vagus nerve [Citation38]. Earlier reports suggested the induction of neuroinflammation in mouse models upon H. pylori infection [Citation39]. A study by Regueira et al. suggested that the pro-inflammatory response associated with bacterial infection can induce cognitive dysfunction [Citation40]. Infected participants with cognitive dysfunction had higher serum levels of IL-6 compared to cognitively normal controls. Experimental studies suggest that inflammation plays a fundamental role in the pathogenesis of AD. Pro-inflammatory cytokines are previously observed in post-mortem studies of the AD brain.Similarly, polymorphisms of some inflammatory genes, including IL-1, IL-6, and TNFα, have been associated with an elevated susceptibility for AD development, thereby indirectly incriminating inflammatory responses in the disease progression [Citation41]. Similar to the previous findings, we found that HPCM instigates an inflammatory cascade in the neural environment. We also demonstrated an enhanced expression of IL6, TNFΑ, IL-1β, IL16 and IL8 in HPCM-treated neuronal and co-cultured cells. Additionally, we found a significant increase in the chemokine profile (CXCL1, CXCL3, CXCL5, and CCL5) of neural cells treated with HPCM. Previous studies also found the altered expression of chemokines (CCL1, CCL5, CCL15, CCL27, CXCL9, CXCL10, and CXCL3) in CSF and blood of AD and MCI patients [Citation42]. Surprisingly, we observed that H. pylori strain isolated from gastric biopsy and having triple resistance (HB1) AMR status aggravates more inflammation in neuroblastoma cells compared to the other two strains. This might be due to escalated immune activation against toxins released by the MDR strain. Curiously, we noted an augmented level of inflammation within neuron astrocyte co-cultured cells when subjected to HPCM, in contrast to individually treated neuroblastoma cells. This might be suggested as an astrocyte-mediated inflammatory response upon bacterial infection. Earlier, OMVs from H. pylori were proven to induce astrogliosis (reactive astrocyte). Further, this can provoke neuronal damage, such as neurite retraction, and ultimately, increase neuronal death [Citation43]. Our study also found enhanced expression of GFAP (a marker of astrogliosis) in HPCM-treated LN229 cells at the protein level detected via western blot and immunofluorescence assay. Likewise, the most robust expression of GFAP was found in LN229 cells treated with HB1-CM, compared to the other two treated groups. The JAK/STAT signalling pathway is one of the critical factors that promote neuroinflammation in neurodegenerative diseases [Citation25,Citation44]. Constitutive or abnormal activation of one of the crucial regulators of this intricate pathway, STAT3, has been proven to play a pivotal role in neurological deformities [Citation45]. Enhanced STAT3 activation has been found to be associated with LPS-induced inflammation in wild-type mice [Citation46]. Our data showed elevated protein expression of STAT1 and STAT3 in all three HPCM-treated IMR-32 and co-cultured cells. This might suggest HPCM containing OMVs-mediated STAT activation in the neural compartment. The activation of STAT1 in neural cells treated with HPCM could be attributed to the significant cytokine storm triggered by the secreted components of H. pylori [Citation47]. STAT3 activation is marked by the dimerization of STAT3 molecules and further nuclear translocation upon phosphorylation [Citation48]. Our study found the enhanced expression of pSTAT3 in the nuclear compartment of IMR-32 cells upon treatment with HPCM.
In addition, previous reports found that H. pylori filtrate leads to spatial learning and memory deficits in rats and impairs synaptic maturation [Citation49]. The current study also revealed the pronounced expression of AD-associated hallmarks: APP, APOE4, PSEN1, and BACE1 in HPCM-treated IMR-32 and co-cultured cells. Surprisingly, we observed a remarkable increase in the protein expression of STAT3, APP, and APOE4 in cells subjected to HJ9-CM (gastric juice isolate) instead of cells exposed to HB10 and HB1-CM (gastric biopsy isolate). It might be due to the higher pathogenic potential of the HJ isolate compared to the other two HB isolates, as discussed in our previous report [Citation2,Citation50]. In contrast to our study, most of the previous studies have suggested the higher pathogenic ability of the MDR H. pylori compared to the susceptible isolates [Citation51]. In evolution, appearance of new characters comes with the cost of disappearance of existing characters. In case of bacteria the resistance to certain antibiotic may compromise the pathogenic ability. Beceiro et al have given multiple examples of increased antibiotic resistance have a deleterious effect on the virulence and fitness of the bacteria [Citation52]. The lower pathogenic ability of triple resistant HB1 might be due to the similar deleterious effect. Moreover, the expression of APP and APOE4 was profoundly upregulated in a co-culture model, suggesting the crucial role of brain immune cell astrocytes with neuronal cells in neuropathological conditions. The interaction between neurons and astrocytes gets dysregulated in neuropathies [Citation53].
Inhibition of STAT3 is proven to protect against neuroinflammation and AD-associated pathological conditions [Citation46]. Additionally, previous studies reported STAT3 as a transcriptional regulator for one crucial enzyme in amyloid β (Aβ) production, BACE1. Furthermore, STAT3 inhibition selectively reduced the expression of BACE1 and amyloid pathology [Citation46]. Our results demonstrated the enhanced expression of pSTAT3, APP, and APOE4 in neuroblastoma and neuron-astrocytic co-cultured cells upon treatment with HPCM. These effects were attenuated by the inhibition of STAT3 (). This might suggest STAT3 as a transcriptional regulator for inflammatory and AD-associated markers (APP and APOE4). Earlier reports suggested STAT3 as a transcriptional regulator of reactive astrocytes by enhancing the expression of inflammatory markers [Citation54]. Similarly, another study reported reduced levels of cytokines IL-6, IL-1β, and TNFα in the brain upon STAT3 inhibition triggered by LPS [Citation46]. Interestingly, the mitigation of pSTAT3 expression followed by the expression of APP and APOE4 is irrespective of H. pylori strain.
Figure 11. H. pylori-derived secretions provoke neuroinflammation and neurodegeneration via modulating STAT3 signalling pathway. H. pylori infection to gastric AGS cells elicits the inflammatory response and alters the expression of STATs regulatory factors. By altering the gut-brain axis, H. pylori-derived secretome prompts neuroinflammation. IMR-32 and co-cultured cells exposed to HPCM exhibited heightened expression of inflammatory markers like IL6, IL8, TNFα, and chemokines. Besides inflammatory cascades, HPCM has the potential to instigate the STAT signalling pathway in the neuronal milieu. The augmented expression of AD-associated hallmarks like APP, APOE4, BACE1, and PSEN1 has been observed in neural cells treated with HPCM. Inhibition of STAT3 by BP-1-102 decreases the inflammation and neuropathological markers in neural cells exposed to STAT3i-treated HPCM.
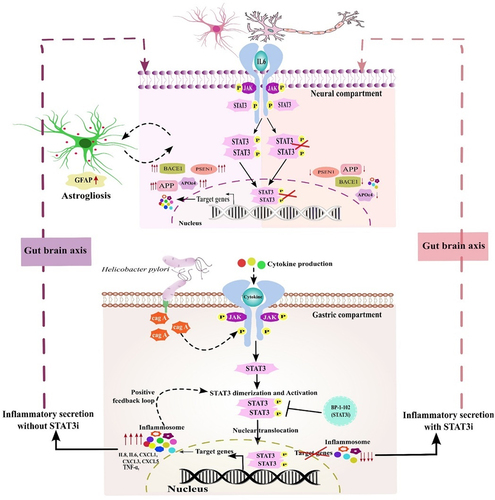
Conclusively, our work presented a molecular insight of the neuropathology associated with AD and the STAT3-mediated neuroinflammation caused by the H. pylori secretome. H. pylori infection exacerbates inflammation in AGS cells and modulates the activity of the STAT3 and its downstream molecules. Further, the H. pylori secretome could potentially instigate the JAK/STAT pathway in the neural compartment by increasing the phosphorylation and nuclear localization of STAT3. Further analysis revealed that STAT3 might act as a transcriptional regulator for inflammatory and amyloid markers (APP and APOE4). Besides, STAT3 inhibition via selective inhibitor, BP-1-102 in gastric milieu attenuates the HPCM-derived inflammatory response and amyloid-induced pathology ().
Future aspects
Our study shade light on the STAT3 mediated gut-brain axis disruption in case of H. pylori infection. Moreover, analysis of H. pylori derived secretome need to be performed for understanding the factors associated with the disruption of the axis and its role in neurological complications. Our ongoing research delves into the systematic profiling and characterization of the respective H. pylori secretome. Employing advanced methodologies such as Liquid Chromatography-Mass Spectrometry (LC-MS) and High-Performance Liquid Chromatography (HPLC), we will scrutinize the intricate landscapes of proteomics, lipidomics, and metabolomics. This rigorous scientific approach aims to unravel the nuanced involvement of specific virulent factors intricately associated with neurological complexity. Importantly, the in vivo validation along with the behavioural analysis in the animal model will provide robust evidence of H. pylori associated STAT3 mediated neural complications.
Material and methods
Mammalian cell culture
The human gastric adenocarcinoma cell line (AGS, RRID: CVCL_0139), human neuroblastoma cell line (IMR-32, RRID: CVCL_0346), and human glioblastoma cell line (U-87 MG, RRID: CVCL_0022 and LN229, RRID: CVCL_0393) was procured from the National Centre for Cell Science, Pune, India. The cells were cultured in a Dulbecco’s modified Eagle’s medium (DMEM; Himedia Laboratories Pvt. Limited, India) supplemented with 10% foetal bovine serum (FBS; Gibco Laboratories Pvt. Limited, India) and 50 U/mL of penicillin, 100 μg/mL of streptomycin, and 2 mM of L-glutamine. The cells were maintained in a humidified environment with 5% CO2 at 37°C.
Bacterial culture
The H. pylori clinical strains (HB10, HJ9, and HB1) have been isolated from human gastric biopsy (HB) and gastric juice (HJ) samples from suspected gastritis patients as per the protocol mentioned previously [Citation1]. Initially, a loop-full of respective bacterial glycerol stock was streaked on a Brain Heart Infusion agar plate (BD-DIFCO, USA) supplemented with 10% FBS and H. pylori selective antibiotics such as vancomycin, cefsulodin, amphotericin, and trimethoprim with 10, 5, 5, and 5 mg/L, respectively (Sigma Aldrich, St Louis, MO, USA). These plates were incubated in a microaerophilic environment till visible growth was observed. A point-sized colony was identified and used for the Gram staining (Supp Figure S6). A morphological comparison with H. pylori was adopted to screen the colony. Further, the H. pylori strain in cBHI broth medium was cultured under microaerophilic conditions (85% N2, 10% CO2, and 5% O2) at a temperature of 37 °C within the anaerobic workstation (Whitley DG250).
Antibiotic susceptibility test of H. pylori isolates
The minimum inhibitory concentrations (MIC) of 10 clinical H. pylori isolates (HJ1, HJ9, HJ10, HJ17, HJ14, I10, HB10, HB14, HB1, and HB5) towards antibiotics used in concomitant quadruple therapy such as clarithromycin, metronidazole, and amoxycillin were assessed using the broth microdilution method as per the protocol mentioned [Citation9]. The following antibiotic concentrations were used to check the susceptibility: Clarithromycin (0, 0.25, 0.5, and 1 ug/ml), metronidazole (0, 4, 8, and 16 ug/ml), and amoxycillin (0, 0.0625, 0.125 and 0.25 ug/ml). Resistance was defined in accordance with the European Committee on Antimicrobial Susceptibility Testing (EUCAST) guidelines: clarithromycin (MIC >0.5 μg/ml), metronidazole (MIC >4 μg/ml), and amoxycillin (MIC >0.125 μg/ml). We used a complete brain-heart infusion (BHI) medium as a control.
Infection methodology
The infection procedure commenced with seeding 0.5 million AGS cells in 60 mm plates. Upon reaching the 80–85% confluency, the cells were infected with HB10, HJ9, and HB1 at a multiplicity of infection (MOI) 100. The MOI was calculated as described in our previous report [Citation1]. The number of bacterial cells per ml (CFU/mL) of culture was determined using the final OD, and the volume of bacterial culture needed for infection was calculated accordingly. Every time prior to infection, the strain has been confirmed by gram staining in duplicate as per the standardized protocol [Citation1].
The infection of H. pylori was given as per the infection strategy-I (). Briefly, we exposed gastric epithelial cells to three different clinical strains of H. pylori: HB10, HJ9, and HB1, while uninfected AGS cells were taken as control. Cells were incubated for 24 hrs, and the conditioned media we collected from the cells infected with the respective strain was further designated as H. pylori-derived conditioned media (HPCM) in the manuscript. We further treated neuronal cells (IMR-32) and neuron-astrocytic co-cultured cells (IMR-32+U-87 MG) with the cDMEM and HPCM in a ratio of 7:3 for 24 hrs ().
Cell cytotoxic assay of BP-1-102
Cellular toxicity of BP-1-102 to AGS cells was determined through an MTT assay. Briefly, AGS cells were treated with different concentrations of BP-1-102 for 24 hrs. Further, 50 μl of MTT reagent (0.5 mg/ml) was added and incubated for 2 h at 37 °C in the CO2 incubator. The MTT solution was then discarded, and 100 μl of DMSO was added. The plates were placed on a shaker to solubilize the formations of purple crystal formazan. The absorbance was measured using a microplate reader at a wavelength of 570 and 590 nm. The results were used to construct a graph of cell viability percentage against concentrations.
Treatment of STAT-3 inhibitor (BP-1-102) to AGS and infection methodology
To understand whether H. pylori infection acts through STAT3 mediated pathway or not, STAT3 selective inhibitor BP-1-102 (STAT3i) was used. BP-1-102 binds Stat3 with an affinity (KD) of 504 nM, blocks Stat3-phospho-tyrosine (pTyr) peptide interactions, and STAT3 activation. BP-1-102 was purchased from Selleckchem, Huston, USA (Catalog No. S7769). 150 mM stock was prepared in DMSO and kept at −80°C till further use. For treating BP-1-102, we have checked the cytotoxic effect of BP-1-102 in AGS cells through MTT assay. The treatment concentration ranges between 0.78 μM to 50 μM, and we used 1.1 μM of BP-1-102 in all the experiments (Figure S7).
AGS cells were seeded at a density of 0.5 million per 60 mm plate. Cells were treated with 1.1 μM of BP-1-102 for 2 hrs upon reaching the 80–85% confluency, followed by H. pylori infection (MOI 100) for 24 hrs. After completion of incubation time, we collected conditioned media which has been further designated as STAT3i treated HPCM (). We treated neuronal cells (IMR-32) and neuron-astrocytic co-cultured cells (IMR-32+U-87 MG) with the cDMEM and STAT3i treated HPCM in a ratio of 7:3 for 24 hrs ().
RNA isolation and qRT- PCR (quantitative real-time polymerase chain reaction)
A quantitative real-time polymerase chain reaction (qRT-PCR) was performed to analyse the transcriptomic profiles of various genes in AGS, IMR-32, and IMR-32+U-87 MG co-cultured cells as described earlier [Citation50]. In brief, during the post-incubation period, pellets were collected, and RNA was isolated using TRI reagent (Sigma, life sciences, Sigma-Aldrich, St. Louis, USA), followed by cDNA synthesis (PrimeScriptTM RT Master Mix; Takara, Shiga, Japan). The relative expression of H. pylori-associated genes (16s-rRNA and cag A), inflammatory markers including cytokines (IL6, TNFα, IL-1β, IL16, IL8, and IL16), chemokines (CXCL1, CXCL3, CXCL5, and CCL5), as well as regulatory transcription factors (STAT1, STAT2, and STAT3) were determined by qRT-PCR using specific primers (Table S2) and SYBR green (Applied Biosystems, Waltham, USA) on Agilent AriaMX system (Agilent Technologies, Santa Clara, USA). Melting curve analysis was performed to confirm the specificity of PCR amplicons. All reactions were performed in triplicate and repeated at least three times. Human glyceraldehyde 3-phosphate dehydrogenase (GAPDH) was used as the reference gene. Reverse transcriptase control (–RT) was used in all the experiments to monitor genomic DNA contamination.
Western blot
The western blot was performed as mentioned in the previous study [Citation50]. Briefly, the cells, upon infection with H. pylori or treatment with HPCM for 24 hrs, were harvested, washed with PBS, and lysed in radioimmunoprecipitation assay (RIPA) buffer (VWR, Radnor, USA) containing protease and phosphatase inhibitors. Proteins in the supernatant were quantified using Bradford protein assay reagents (Himedia, Mumbai, India). Equal quantities of protein from each group were separated using SDS-PAGE and transferred onto 0.45 μm Nitrocellulose membranes (Bio-Rad, Hercules, USA). Membranes were blocked with 4.5% BSA and incubated with primary antibody overnight at 4°C. Following incubation and washing, the membrane was treated with 1:3000 dilution of horseradish peroxidase-conjugated anti-rabbit and anti-mouse antibodies for one hour. Primary antibody against STAT3 (#9139, 1:1000, RRID: AB_331757), pSTAT3 (Tyr705) (#9145, 1:1000, RRID: AB_2491009), STAT1 (#14994, 1:1000, RRID: AB_2737027), pSTAT1 (Tyr703) (#9167, 1:1000, RRID: AB_561284), Cleaved Caspase-3 (#9664, 1:1000, RRID: AB_2070042), NF-κB p65 (#8242, 1:1000, RRID: AB_10859369), APOE4 (#8941, 1:1000, RRID: AB_2797681), TNFα (#8184, 1:1000, RRID: AB_2797640) and GFAP (#12389, 1:1000, RRID: AB_2631098) were purchased from Cell Signaling Technology, Danvers, USA. GAPDH (# MA5–15738, 1:1000, RRID: AB_10977387), APP (#51–2700, 1:1000, RRID: AB_87659), was from Invitrogen, Waltham, USA. The chemiluminescent detection was based on the Pierce ECL Western blotting substrate (Bio-Rad, Hercules, USA). Blots were observed under the gel doc system (Biorad ChemiDoc™ XRS+ System with Image Lab™ Software, Bio-Rad, Hercules, USA). Image analysis and quantification were performed using Image J software (National Institutes of Health, USA).
Immunofluorescence assay
An immunofluorescence assay was performed as described earlier [Citation55]. The LN229 and IMR-32 cells were seeded onto coverslips and treated with HPCM for 24 hrs. Primary antibodies against GFAP (#12389, 1:200, RRID: AB_2631098) and pSTAT3 (Tyr 705) (#9145, 1:250, RRID: AB_2491009) were used, followed by staining with DAPI (1:500) and secondary antibody (1:1000 dilution) conjugated with different fluorophores. The slides were observed under a confocal and fluorescence microscope (FluoView 1000, Olympus, Tokyo, Japan), and the results were analysed using Image J software (National Institutes of Health, USA). The fluorescence intensity was calculated and plotted in comparison to the control.
Estimation of cellular reactive oxygen species (ROS)
Cellular ROS was evaluated using H2-DCFDA staining as per standard protocol [Citation50]. Briefly, IMR-32 cells and co-cultured cells were seeded in a 24-well plate and treated with HPCM, following the infection strategy mentioned earlier (section 2.4). After incubation, cells were washed with PBS, and 200 μL of 10 μg/mL H2-DCFDA was added per well for 25 minutes. Subsequently, the cells were washed with PBS and visualized under an Olympus I×83fluorescent microscope equipped with cell Sens imaging software at a 10× objective magnification. The amount of ROS represented by fluorescence intensity was quantified using ImageJ software. The changes in fluorescence intensity in the treated cells were expressed as fold changes relative to the control cells.
Statistical analysis
The experimental outcomes were executed in triplicates for each set. An unpaired t-test was implemented in the statistical evaluation of the data. p values were estimated using GraphPad Prism version 7, and p values of 0.05, 0.01, and 0.001 were considered statistically significant and represented by */#, **/##, and ***/###, denoting upregulation/downregulation, respectively.
Highlights
H. pylori infection exacerbates inflammation in gastric milieu.
H. pylori derived conditioned media (HPCM) instigates JAK/STAT pathway in neural compartment, modulates STAT3 regulatory molecule.
STAT3, as a transcriptional regulator activating AD markers such as APP and APOE4.
Antibiotic-sensitive H. pylori strains are more neurologically pathogenic.
Inhibition of STAT3 abate the HPCM induced neuroinflammation and markers of neurological ailments like AD.
Author contributions
Conceptualization: [Hem Chandra Jha and Meenakshi Kandpal], Methodology: [Meenakshi Kandpal and Nidhi Varshney], Formal analysis and investigation: [Hem Chandra Jha, Meenakshi Kandpal, Budhadev Baral, Nidhi Varshney, Ajay Kumar Meena, Rajan Kumar Pandey], Writing – original draft preparation: [Meenakshi Kandpal], Writing – review and editing: [Meenakshi Kandpal, Budhadev Baral, Nidhi Varshney, Ajay Kumar Meena, Rajan Kumar Pandey and Hem Chandra Jha], Writing – preparation of figures: [Meenakshi Kandpal], Clinical support for the isolation of H. pylori: [Ajay Kumar Jain and Debi Chatterji], Funding acquisition: [Hem Chandra Jha and Ajay Kumar Meena], Supervision: [Hem Chandra Jha]. All authors gave final approval and agreed to be accountable for all aspects of the work.
Supplementary materialclean.docx
Download MS Word (2.1 MB)Acknowledgements
Indian Institute of Technology Indore for providing facilities and support. We appreciate lab colleagues for their insightful discussions and advice. We acknowledge the Indian Council of Medical Research (Grant no. BMI/12(82)/2021 and ECD/CSTPU/Adhoc/COVID-19/28/2021-22) and Central Council for Research in Ayurvedic Sciences (Grant no. 1263/2022-23) Govt. of India for funding. We are also thankful to MHRD, University Grants Commission, DST-Inspire Govt. of India for fellowship to Meenakshi Kandpal, Budhadev Baral and Nidhi Varshney, respectively in the form of research stipend. We also acknowledge DST-FIST support project No. SR/FST/LS-I/2020/621 for providing us with different instruments.
Disclosure statement
No potential conflict of interest was reported by the author(s).
Supplementary material
Supplemental data for this article can be accessed online at https://doi.org/10.1080/21505594.2024.2303853
Additional information
Funding
References
- Sonkar C, Verma T, Chatterji D, et al. Status of kinases in Epstein-Barr virus and Helicobacter pylori coinfection in gastric cancer cells. BMC Cancer. 2020;20(1):925. doi: 10.1186/s12885-020-07377-0
- Baral B, Kashyap D, Varshney N, et al. Helicobacter pylori isolated from gastric juice have higher pathogenic potential than biopsy isolates. Genes Dis. 2023;S2352304223001162. doi: 10.1016/j.gendis.2023.03.003
- Wroblewski LE, Peek RM, Wilson KT. Helicobacter pylori and gastric cancer: factors that modulate disease risk. Clin Microbiol Rev. 2010;23(4):713–21. doi: 10.1128/CMR.00011-10
- Baj J, Forma A, Sitarz M, et al. Helicobacter pylori virulence factors—mechanisms of bacterial pathogenicity in the gastric microenvironment. Cells. 2020;10(1):27. doi: 10.3390/cells10010027
- Raghwan CR, Chowdhury R. Host cell contact induces fur-dependent expression of virulence factors CagA and VacA in Helicobacter pylori. Helicobacter. 2014;19(1):17–25. doi: 10.1111/hel.12087
- Sijmons D, Guy AJ, Walduck AK, et al. Helicobacter pylori and the role of lipopolysaccharide variation in innate immune evasion. Front Immunol. 2022;13:868225. doi: 10.3389/fimmu.2022.868225
- Suzuki S, Esaki M, Kusano C, et al. Development of Helicobacter pylori treatment: how do we manage antimicrobial resistance? WJG. 2019;25(16):1907–1912. doi: 10.3748/wjg.v25.i16.1907
- Lin Y, Shao Y, Yan J, et al. Antibiotic resistance in Helicobacter pylori : from potential biomolecular mechanisms to clinical practice. Clinical Laboratory Analysis. 2023;37(7):e24885. doi: 10.1002/jcla.24885
- Kouitcheu Mabeku LB, Eyoum Bille B, Tepap Zemnou C, et al. Broad spectrum resistance in Helicobacter pylori isolated from gastric biopsies of patients with dyspepsia in Cameroon and efflux-mediated multiresistance detection in MDR isolates. BMC Infect Dis. 2019;19(1):880. doi: 10.1186/s12879-019-4536-8
- Patangia DV, Anthony Ryan C, Dempsey E, et al. Impact of antibiotics on the human microbiome and consequences for host health. Microbiologyopen. 2022;11(1):e1260. doi: 10.1002/mbo3.1260
- Hasan N, Yang H. Factors affecting the composition of the gut microbiota, and its modulation. PeerJ. 2019;7:e7502. doi: 10.7717/peerj.7502
- Carding S, Verbeke K, Vipond DT, et al. Dysbiosis of the gut microbiota in disease. Microbial Ecology In Health & Disease [Internet]. 2015 [cited 2022 Oct 9];26. Available from http://www.microbecolhealthdis.net/index.php/mehd/article/view/26191
- Yang L, Zhang J, Xu J, et al. Helicobacter pylori infection aggravates dysbiosis of gut microbiome in children with gastritis. Front Cell Infect Microbiol. 2019;9:375. doi: 10.3389/fcimb.2019.00375
- Mitrea L, Nemeş S-A, Szabo K, et al. Guts imbalance imbalances the brain: a review of gut microbiota association with neurological and psychiatric disorders. Front Med. 2022;9:813204. doi: 10.3389/fmed.2022.813204
- Huang W-S, Yang T-Y, Shen W-C, et al. Association between Helicobacter pylori infection and dementia. J Clin Neurosci. 2014;21(8):1355–1358. doi: 10.1016/j.jocn.2013.11.018
- Kountouras J, Tsolaki F, Tsolaki M, et al. H elicobacter pylori -related ApoE 4 polymorphism may be associated with dysphagic symptoms in older adults. Dis Esophagus. 2016;29(7):842–842. doi: 10.1111/dote.12364
- Kandpal M, Indari O, Baral B, et al. Dysbiosis of gut microbiota from the perspective of the gut–brain axis: role in the provocation of neurological disorders. Metabolites. 2022;12(11):1064. doi: 10.3390/metabo12111064
- Uberti AF, Callai-Silva N, Grahl MVC, et al. Helicobacter pylori Urease: potential contributions to alzheimer’s disease. IJMS. 2022;23(6):3091. doi: 10.3390/ijms23063091
- Brandt S, Kwok T, Hartig R, et al. NF-κB activation and potentiation of proinflammatory responses by the Helicobacter pylori CagA protein. Proc Natl Acad Sci, USA. 2005;102(26):9300–9305. doi: 10.1073/pnas.0409873102
- Saadat I, Higashi H, Obuse C, et al. Helicobacter pylori CagA targets PAR1/MARK kinase to disrupt epithelial cell polarity. Nature. 2007;447(7142):330–333. doi: 10.1038/nature05765
- Kanda N, Seno H, Konda Y, et al. STAT3 is constitutively activated and supports cell survival in association with survivin expression in gastric cancer cells. Oncogene. 2004;23(28):4921–4929. doi: 10.1038/sj.onc.1207606
- Khanna P, Chua PJ, Bay BH, et al. The JAK/STAT signaling cascade in gastric carcinoma (Review). Int J Oncol. 2015;47(5):1617–1626. doi: 10.3892/ijo.2015.3160
- Hammarén HM, Virtanen AT, Raivola J, et al. The regulation of JAKs in cytokine signaling and its breakdown in disease. Cytokine. 2019;118:48–63. doi: 10.1016/j.cyto.2018.03.041
- Seif F, Khoshmirsafa M, Aazami H, et al. The role of JAK-STAT signaling pathway and its regulators in the fate of T helper cells. Cell Commun Signal. 2017;15(1):23. doi: 10.1186/s12964-017-0177-y
- Jain M, Singh MK, Shyam H, et al. Role of JAK/STAT in the neuroinflammation and its association with neurological disorders. Ann Neurosci. 2021;28(3–4):191–200. doi: 10.1177/09727531211070532
- Lashgari N-A, Roudsari NM, Momtaz S, et al. The involvement of JAK/STAT signaling pathway in the treatment of Parkinson’s disease. J Neuroimmunol. 2021;361:577758. doi: 10.1016/j.jneuroim.2021.577758
- Mehrotra T, Devi TB, Kumar S, et al. Antimicrobial resistance and virulence in Helicobacter pylori: Genomic insights. Genomics. 2021;113(6):3951–3966. doi: 10.1016/j.ygeno.2021.10.002
- Malfertheiner P, Camargo MC, El-Omar E, et al. Helicobacter pylori infection. Nat Rev Dis Primers. 2023;9(1):19. doi: 10.1038/s41572-023-00431-8
- Baj A, Moro E, Bistoletti M, et al. Glutamatergic signaling along the microbiota-gut-brain axis. IJMS. 2019;20(6):1482. doi: 10.3390/ijms20061482
- Rutsch A, Kantsjö JB, Ronchi F. The gut-brain axis: how microbiota and host inflammasome influence brain physiology and pathology. Front Immunol. 2020;11:604179. doi: 10.3389/fimmu.2020.604179
- Zhuang Z-Q, Shen L-L, Li W-W, et al. Gut microbiota is altered in patients with Alzheimer’s disease. JAD. 2018;63(4):1337–1346. doi: 10.3233/JAD-180176
- Gravina AG, Zagari RM, Musis CD, et al. Helicobacter pylori and extragastric diseases: a review. WJG. 2018;24(29):3204–3221. doi: 10.3748/wjg.v24.i29.3204
- De Simone U, Caloni F, Gribaldo L, et al. Human Co-culture model of neurons and astrocytes to test acute cytotoxicity of neurotoxic compounds. Int J Toxicol. 2017;36(6):463–477. doi: 10.1177/1091581817739428
- Goshi N, Morgan RK, Lein PJ, et al. A primary neural cell culture model to study neuron, astrocyte, and microglia interactions in neuroinflammation. J Neuroinflammation. 2020;17(1):155. doi: 10.1186/s12974-020-01819-z
- Wang J, Yao Y, Zhang Q, et al. Inflammatory responses induced by Helicobacter pylori on the carcinogenesis of gastric epithelial GES‑1 cells. Int J Oncol [Internet]. 2019 [cited 2023 Aug 30]; Available from. doi: 10.3892/ijo.2019.4775
- Piao J-Y, Kim S-J, Kim D-H, et al. Helicobacter pylori infection induces STAT3 phosphorylation on Ser727 and autophagy in human gastric epithelial cells and mouse stomach. Sci Rep. 2020;10(1):15711. doi: 10.1038/s41598-020-72594-3
- Frauenlob T, Neuper T, Mehinagic M, et al. Helicobacter pylori infection of primary human monocytes boosts subsequent immune responses to LPS. Front Immunol. 2022;13:847958. doi: 10.3389/fimmu.2022.847958
- Lee K-E, Kim J-K, Han S-K, et al. The extracellular vesicle of gut microbial paenalcaligenes hominis is a risk factor for vagus nerve-mediated cognitive impairment. Microbiome. 2020;8(1):107. doi: 10.1186/s40168-020-00881-2
- Albaret G, Sifré E, Floch P, et al. Alzheimer’s disease and Helicobacter pylori infection: inflammation from stomach to brain? JAD. 2020;73(2):801–809. doi: 10.3233/JAD-190496
- Regueira P, Silva AR, Cardoso AL, et al. Peripheral inflammatory markers during an acute bacterial infection in older patients with and without cognitive dysfunction: a case control study. Brain, Behavior, & Immun - Health. 2022;25:100503. doi: 10.1016/j.bbih.2022.100503
- Tan ZS, Beiser AS, Vasan RS, et al. Inflammatory markers and the risk of Alzheimer disease: the Framingham study. Neurology. 2007;68(22):1902–1908. doi: 10.1212/01.wnl.0000263217.36439.da
- Zhou F, Sun Y, Xie X, et al. Blood and CSF chemokines in Alzheimer’s disease and mild cognitive impairment: a systematic review and meta-analysis. Alz Res Therapy. 2023;15(1):107. doi: 10.1186/s13195-023-01254-1
- Palacios E, Lobos-González L, Guerrero S, et al. Helicobacter pylori outer membrane vesicles induce astrocyte reactivity through nuclear factor-kappa B activation and cause neuronal damage in vivo in a murine model. J Neuroinflammation. 2023;20(1):66. doi: 10.1186/s12974-023-02728-7
- Li X, Pan K, Vieth M, et al. JAK-STAT1 signaling pathway is an early response to Helicobacter pylori infection and contributes to immune escape and gastric carcinogenesis. IJMS. 2022;23(8):4147. doi: 10.3390/ijms23084147
- Millot P, San C, Bennana E, et al. STAT3 inhibition reverses neuroinflammation and Aβ metabolism induced by systemic inflammation: molecular and cell biology/neuroinflammation. Alzheimer’s & Dementia [Internet]. 2020;16(S2). [cited 2023 Aug 30]. Available from: https://onlinelibrary.wiley.com/doi/10.1002/alz.041019
- Millot P, San C, Bennana E, et al. STAT3 inhibition protects against neuroinflammation and BACE1 upregulation induced by systemic inflammation. Immunol Lett. 2020;228:129–134. doi: 10.1016/j.imlet.2020.10.004
- Pertovaara M, Silvennoinen O, Isomäki P. Cytokine-induced STAT1 activation is increased in patients with primary Sjögren’s syndrome. Clin Immunol. 2016;165:60–67. doi: 10.1016/j.clim.2016.03.010
- Hu X, Li J, Fu M, et al. The JAK/STAT signaling pathway: from bench to clinic. Sig Transduct Target Ther. 2021;6(1):402. doi: 10.1038/s41392-021-00791-1
- Wang X-L, Zeng J, Feng J, et al. Helicobacter pylori filtrate impairs spatial learning and memory in rats and increases Î2-amyloid by enhancing expression of presenilin-2. Front Aging Neurosci [Internet]. 2014;6 [cited 2023 Aug 30]. Available from: http://journal.frontiersin.org/article/10.3389/fnagi.2014.00066/abstract
- Kashyap D, Varshney N, Baral B, et al. Helicobacter pylori infected gastric epithelial cells bypass cell death pathway through the oncoprotein Gankyrin. Adv Cancer Biol Metastasis. 2023;7:100087. doi: 10.1016/j.adcanc.2023.100087
- Schroeder M, Brooks B, Brooks A. The complex relationship between virulence and antibiotic resistance. Genes. 2017;8(1):39. doi: 10.3390/genes8010039
- Beceiro A, Tomás M, Bou G. Antimicrobial resistance and virulence: a successful or deleterious association in the bacterial world? Clin Microbiol Rev. 2013;26(2):185–230. doi: 10.1128/CMR.00059-12
- Pathak D, Sriram K. Neuron-astrocyte omnidirectional signaling in neurological health and disease. Front Mol Neurosci. 2023;16:1169320. doi: 10.3389/fnmol.2023.1169320
- Liu X, Tian Y, Lu N, et al. Stat3 inhibition attenuates mechanical allodynia through transcriptional regulation of chemokine expression in spinal astrocytes. PloS One. 2013;8(10):e75804. doi: 10.1371/journal.pone.0075804
- Kashyap D, Baral B, Jakhmola S, et al. Helicobacter pylori and Epstein-Barr virus coinfection stimulates aggressiveness in gastric cancer through the regulation of gankyrin. mSphere. 2021;6:e00751–21.