
ABSTRACT
Epstein-Barr virus (EBV) infection in humans is ubiquitous and associated with various diseases. Remodeling of the immune microenvironment is the primary cause of EBV infection and pathogenesis; however, the underlying mechanism has not been fully elucidated. In this study, we used whole-transcriptome RNA-Seq to detect mRNAs, long non-coding RNAs (lncRNA), and microRNA (miRNA) profiles in the control group, 3 days, and 28 days after EBV infection, based on the tree shrew model that we reported previously. First, we estimated the proportion of 22 cell types in each sample using CIBERSORT software and identified 18 high-confidence DElncRNAs related to immune microenvironment regulation after EBV infection. Functional enrichment analysis of these differentially expressed lncRNAs primarily focused on the autophagy, endocytosis, and ferroptosis signalling pathways. Moreover, EBV infection affects miRNA expression patterns, and many miRNAs are silenced. Finally, three competing endogenous RNA regulatory networks were built using lncRNAs that significantly correlated with immune cell types, miRNAs that responded to EBV infection, and potentially targeted the mRNA of the miRNAs. Among them, MRPL42-AS-5 might act as an hsa-miR-296-5p “sponge” and compete with target mRNAs, thus increasing mRNA expression level, which could induce immune cell infiltration through the cellular senescence signalling pathway against EBV infection. Overall, we conducted a complete transcriptomic analysis of EBV infection in vivo for the first time and provided a novel perspective for further investigation of EBV-host interactions.
Introduction
The Epstein-Barr virus (EBV) is one of the most ubiquitous γ-herpes viruses that establish lifelong persistent latent infection in over 90% of adults worldwide [Citation1]. EBV is associated with several diseases, including acute or chronic inflammatory diseases and various human malignancies of lymphoid or epithelial origin [Citation2]. Due to its co-evolution with its host, EBV has developed sophisticated strategies to evade human immune surveillance and ensure its replication and survival [Citation3]. These processes are often accompanied by the remodelling of the microenvironment, making it more conducive to cellular transformation and tumour progression [Citation4]. Non-coding RNA (ncRNAs) have received increasing attention due to their diverse functions and participation in many biological pathways. Herpesviruses have evolved strategies to evade host immune responses, including using microRNAs (miRNAs) to inhibit and hijack long non-coding RNA (lncRNAs) in vitro experiments. For example, in EBV-positive gastric carcinoma and nasopharyngeal carcinoma cell lines, EBV-encoded miR-BART6-3p inhibits cancer cell metastasis and invasion by targeting lncRNA LOC553103 [Citation5]. LncRNAs can be implicated in transcription regulatory processes through the competing endogenous RNA (ceRNA) mechanism, which indirectly inhibits miRNAs by regulating their target mRNA [Citation6]. However, no systematic study has been done on the interaction between lncRNAs and miRNAs in remodelling the microenvironment after EBV infection, owing to the lack of suitable animal models. We previously reported that the tree shrew (Tupaia belangeri chinensis) is a suitable animal model for evaluating the mechanisms of EBV infection [Citation7].
In this study, we acquired RNA-Seq and miRNA-Seq data from the peripheral blood of the tree shrew model at pre-infection, acute infection (3 days post EBV infection), and chronic infection (28 days post EBV infection). First, we estimated the proportion of different cell types in each sample from RNA-Seq data to show the altered landscape of immune cells during different stages of infection. Furthermore, we extracted lncRNA expression profiles from all RNA-Seq data and filtered out lncRNAs with high expression abundance and significant correlations with changes in the immunological microenvironment. Consensus clustering was used to identify the expression patterns of infection-related miRNAs using the K-means method. Finally, based on these regulatory relationships, we built a ceRNA regulatory network using immune microenvironment regulation-related lncRNAs, miRNAs with significant changes during infection, and potential target mRNA of the miRNAs.
Results
Dynamic changes of immune microenvironment characteristics in whole blood samples among healthy controls and EBV-infected tree shrew
The experimental workflow is shown in . First, we constructed a tree shrew model of EBV infection by intravenous inoculation of EBV suspensions through the femoral vein. Tree shrews developed variable levels of viraemia within a week post-infection, and EBV DNA copies decreased over time, allowing the virus to enter a latent state gradually (). Moreover, immunohistochemistry against EBV latent membrane protein 1 (LMP-1) showed a detectable viral protein in the spleen at 28 days post-infection (dpi), and EBV-encoded small RNAs (EBERs) were detected by in situ hybridization (ISH) ().
Figure 1. Dynamic immune microenvironment characteristic changes in whole blood samples among healthy controls (ctrl) and Epstein-Barr virus (EBV)-infected tree shrew. (a) Flow chart of the study design. (b) The EBV DNA loads in blood at different time points are shown. The red dotted lines indicate the limit of detection of the assay. (c) Detection of EBV latent membrane protein 1 (LMP-1) and EBV-encoded small RNAs (EBERs) in tree shrew spleens using immunohistochemistry and in situ hybridization at the endpoint (28 days post-infection [dpi]) of animal experimentation. Positive immunoreactivity of LMP-1 protein is indicated by brown staining in the first row. The red color represents the positive staining of EBERs in the second row. (d) Boxplot showing the fraction of each cell type in each group. The significant difference in the immune cell fractions among the ctrl, 3 dpi, and 28 dpi samples was calculated using the Student’s t-test. *, p ≤ 0.05; **, p ≤ 0.01. (e) Fractions of immune cells rank ordered based on decreasing values of the relative frequency ratio at the 3 dpi group relative to the ctrl group (the leftmost panel), 28 dpi group relative to the ctrl group (middle picture), and 28 dpi group relative to the 3 dpi group (the rightmost panel).
![Figure 1. Dynamic immune microenvironment characteristic changes in whole blood samples among healthy controls (ctrl) and Epstein-Barr virus (EBV)-infected tree shrew. (a) Flow chart of the study design. (b) The EBV DNA loads in blood at different time points are shown. The red dotted lines indicate the limit of detection of the assay. (c) Detection of EBV latent membrane protein 1 (LMP-1) and EBV-encoded small RNAs (EBERs) in tree shrew spleens using immunohistochemistry and in situ hybridization at the endpoint (28 days post-infection [dpi]) of animal experimentation. Positive immunoreactivity of LMP-1 protein is indicated by brown staining in the first row. The red color represents the positive staining of EBERs in the second row. (d) Boxplot showing the fraction of each cell type in each group. The significant difference in the immune cell fractions among the ctrl, 3 dpi, and 28 dpi samples was calculated using the Student’s t-test. *, p ≤ 0.05; **, p ≤ 0.01. (e) Fractions of immune cells rank ordered based on decreasing values of the relative frequency ratio at the 3 dpi group relative to the ctrl group (the leftmost panel), 28 dpi group relative to the ctrl group (middle picture), and 28 dpi group relative to the 3 dpi group (the rightmost panel).](/cms/asset/6665b4d5-c2a9-4952-8fe4-70d24b8ab0bc/kvir_a_2306795_f0001_oc.jpg)
Human microbial infections typically induce local and systemic immune responses in the host, and the cell components in the immune microenvironment changes during disease progression [Citation8–10]. In this study, CIBERSORT software [Citation11] was used to estimate relative proportions of 22 types of infiltrated immune cells present in each sample of the healthy control (Ctrl group), 3 dpi, and 28 dpi groups (fractions of different cells estimated by CIBERSORT in each sample are shown in Supplementary Figure S1). After EBV infection, dynamic changes in the microenvironment composition occurred over time (). Notably, the relative proportion of naive B cells gradually declined, and the differences became significant at 28 dpi (compared with the control group, p < 0.05). Similar changes were observed in the relative proportion of resting NK cells (compared to the Ctrl group, p < 0.01). The naïve CD4 T cell level markedly increased at 3 dpi (compared to the Ctrl group, p < 0.05) and then rapidly decreased at 28 dpi (compared to the 3 dpi group, p < 0.01). The relative proportion of immune cells was log-transformed to present the data clearly (). At 3 dpi, monocytes, naïve CD4 T cells, and M2 macrophages increased, and M0 macrophages increased substantially compared to the Ctrl group. In the 28 dpi group, increases were observed in monocytes and neutrophils, and naïve B, naïve CD4 T, naïve T, and resting NK cells decreased compared to the Ctrl group.
Identification of lncRNAs in response to EBV infection in tree shrews
To obtain a comprehensive list of lncRNAs associated with infiltrating immune cells, we first performed transcriptome assembly and identified novel lncRNAs (Supplementary Figure S2A shows the bioinformatics analysis pipeline). LncRNAs must have a read per kilobase of exon per million reads mapped (FPKM) value of ≥ 0.2 in at least one sample to be considered expressed and to reduce analytical errors. After trimming, 273, 308, and 321 lncRNAs remained in the Ctrl, 3 dpi, and 28 dpi groups, respectively, 198 of which were shared among the three groups (). Differential analyses of the mRNAs (DEmRNAs) and lncRNAs (DElncRNAs) were conducted using DEseq2 (details are provided in the Methods). The number of DEmRNAs or DElncRNAs was at a maximum at 3 dpi and gradually recovered on day 28 dpi ().
Figure 2. Identification of lncRnas in response to EBV infection in tree shrews. (A) Venn diagram showing the number of detected lncRnas. The known and novel predicted lncRnas were combined, and more than one sample with reads per kilobase of exon per million reads mapped (FPKM) ≤ 0.2 was supposed to be detected. (B) Bar plot showing the number of upregulated and downregulated annotated genes (DEG, left panel) and lncRNA (DElncRNA, right panel). DESeq2 was used for differential expression analysis with criteria of false discovery rate (FDR) ≤ 0.05 and fold change (FC) ≥ 2 or ≤ 0.5. (C) Principal component analysis (PCA) based on FPKM values of all DElncRNAs. The ellipse for each group is the confidence ellipse. (D) Compared within any two groups, DElncRNAs with an absolute FPKM value ≥ 1 of the difference between the two groups were screened out. Heatmap showing the expression profile of these lncRnas. (E) Co-expression analysis of DElncRNA from (D) with at least one immune cell with p ≤ 0.01 and Pearson’s correlation value ≥ 0.8 or ≤ −0.8. *, p ≤ 0.05; **, p ≤ 0.01. (F) Co-expression analysis was performed on the 18 DElncRNA in (E) and DEmRNAs. Cutoffs of P-value ≤ 0.01 and Pearson’s coefficient ≥ 0.6 or ≤ −0.6 were used to identify the co-expression pairs. The bar plot exhibits the most enriched KEGG pathways of co-expressed DEmRNA genes. dpi, days post-infection.
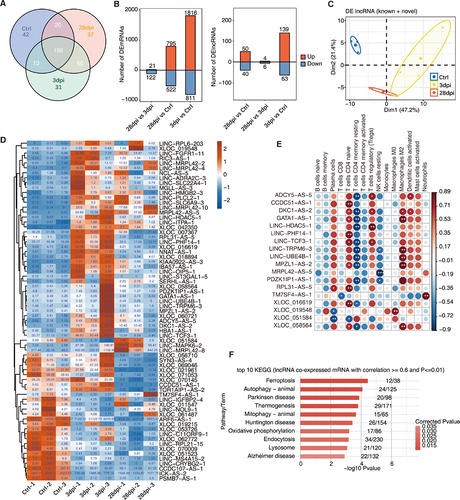
Moreover, we performed Kyoto Encyclopedia of Genes and Genomes (KEGG) annotation and pathway enrichment analyses of the upregulated and downregulated DEmRNAs. Upregulated mRNAs were primarily enriched in pathways related to programmed cell death functions, such as autophagy, endocytosis, and ferroptosis signalling pathways. In contrast, downregulated mRNAs were predominantly enriched in the NF-kappa B and viral protein interaction with cytokine and cytokine receptor signalling pathways (Supplementary Table S2 and Supplementary Figures S2F and G). Our finding suggested that transcriptional repression of the NF-kB signalling pathway might be one of the main mechanisms of action against EBV infection in tree shrews.
Notably, within the three groups, the principal component analysis (PCA) of the DElncRNAs separated them from each other (). These DElncRNAs may be one of the major factors responsible for EBV infection in the tree shrew model. Among these DElncRNAs, we further screened 18 DElncRNAs (for example: ADCY5-AS-5, CCDC51-AS-1, DKC1-AS-2 and so on) with high relative expression (, absolute FPKM of the difference ≥ 1) and significant co-expression patterns. A significant correlation between these DElncRNAs and various immune cell types (Pearson’s correlation value ≥ 0.8 or ≤ −0.8, p < 0.01) was observed (). Finally, to link the lncRNA to its associated protein-coding gene, lncRNA co-expressed mRNAs were extracted (Pearson’s correlation value ≥ 0.6 or ≤ −0.6, p ≤ 0.01), and KEGG pathway analysis was performed (http://www.genome.jp/kegg). Notably, similar to our previous enrichment results, autophagy, endocytosis, and ferroptosis signalling pathways were significantly enriched ().
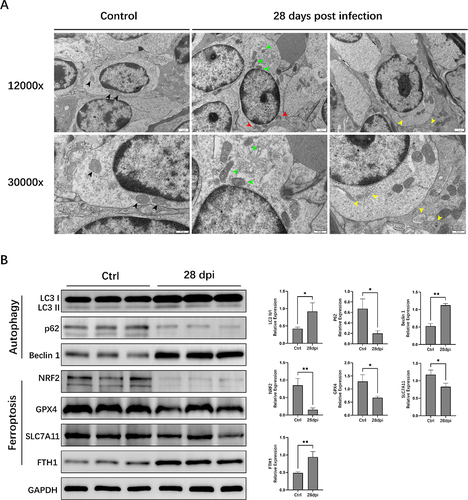
Furthermore, we used transmission electron microscopy (TEM) and Western blotting (WB) to examine the autophagy and ferroptosis signalling pathways. The cristae were well preserved, and the electron density of the mitochondrial matrix appeared regular in the Ctrl group (). In contrast, cells undergoing ferroptosis in the 28 dpi group had several distinguishing features, including mitochondrial atrophy, higher mitochondrial membrane density, reduced mitochondrial cristae, and outer mitochondrial membrane rupture. Double-membrane autophagosomes were observed in the 28 dpi group. WB analysis showed that the expression of the autophagy marker LC3II/I and Beclin-1 was significantly increased, and that of p62 was significantly decreased after EBV infection in the 28 dpi group (compared to the Ctrl group, p < 0.05). Simultaneously, EBV infection significantly reduced the protein expression of the ferroptosis biomarker proteins SLC7A11, NRF2, and GPX4, whereas that of FTH1 (a major intracellular iron storage protein) was significantly increased (28 dpi vs. Ctrl group, p < 0.05) ().
Figure 3. Autophagy and ferroptosis signalling pathways are activated in animals infected with Epstein-Barr virus (EBV). (A) Transmission electron microscopy examinations. Black arrows: normal mitochondria; green arrows: mitochondria with varying cristae densities; red arrows: mitochondria with swelling and cristolysis; yellow arrows: autophagosome. (B) Western blotting (WB) analysis of autophagy and ferroptosis signalling pathways related proteins. ACTIN served as the internal control for the WB assay. *, p ≤ 0.05; **, p ≤ 0.01.
Dynamic miRNA changes before and after EBV infection in tree shrews
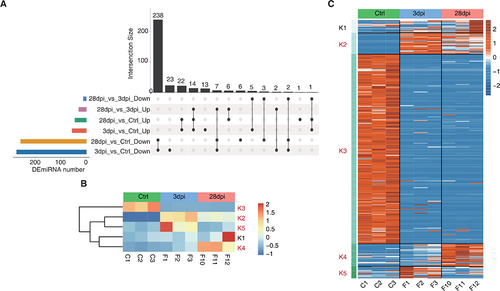
The pairwise differential expression analysis was first implemented to identify miRNAs with significant differential expression (DEmiRNAs, fold change (FC) value ≥ 1.5 or ≤ −1.5, p < 0.05). These results are summarized in the Upset plot, and only the DEmiRNAs with significant variance were retained in the chosen comparison (). miRNAs were clustered based on K-means, resulting in the five groups in and Supplementary Figure S3. Specifically, the K3 group (252 miRNAs) was predominately characterized by downregulation and contained the largest number of miRNAs, whereas the K2 group (28 miRNAs) showed a constant downregulation pattern. The K4 group (30 miRNAs) showed little change at 3 dpi compared to that of the Ctrl animals but significantly increased at 28 dpi. miRNA expression in the K5 group (16 miRNAs) was upregulated at first (3 dpi) and then returned to Ctrl levels by 28 dpi. Because a sample (F12) with strong heterogeneity was present in the K1 group (17 miRNAs), this group was excluded from subsequent analyses ().
Figure 4. Dynamic miRNA changes before and after Epstein-Barr virus (EBV) infection in tree shrews. (A) Upset visualization of the DEmiRNA intersection size from different data sets (black points connected by a line). (B – C) DEmiRNAs among control (ctrl), 3 days post-infection (dpi), and 28 dpi were clustered using K-means. The heatmap in (B) presents five clusters of DE miRnas identified by K-means clustering, and the heatmap in (C) shows expression patterns according to clustered miRnas. K2, K3, K4, and K5, EBV-related clusters, were labelled red.
Construction of ceRNA network mediated by immune microenvironment-related lncRnas during EBV infection
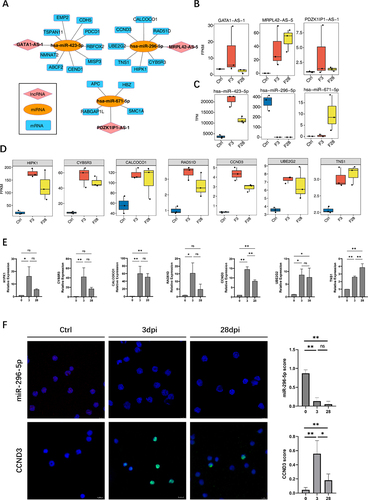
According to the ceRNA hypothesis, lncRNAs can serve as ceRNAs to compete for miRNA response elements, thereby regulating the expression of target genes [Citation6]. A ceRNA regulatory network was constructed using 18 lncRNAs related to immune cell changes from , the miRNAs regulated by EBV infection identified in (except for the K1 cluster), and miRNA-targeted mRNAs, to gain insight into the function of immune-related lncRNAs during EBV infection. The interaction between lncRNAs and miRNAs was identified using miRanda [Citation12] (score >150) and Rnahybrid [Citation13] (p < 0.05), and the results were considered as the intersection. We identified three lncRNA-miRNA pairs: MRPL42-AS-5/hsa-miR-296-5p, GATA1-AS-1/hsa-miR-423-5p, and PDZK1IP1-AS-1/hsa-miR-671-5p ().
Figure 5. Construction of competing endogenous RNA (ceRNA) network mediated by immune microenvironment-related lncRnas during Epstein-Barr virus (EBV) infection. (A) The ceRNA regulatory network was constructed using 18 lncRnas related to immune cell changes from , the miRNA regulated by EBV infection identified in (except the K1 cluster), and miRNA-targeted mRnas. Cytoscape was used to plot the network. (B) Boxplot showing the expression profile of three lncRnas in the ceRNA network shown in (A). (C) Boxplot showing the expression profiles of three miRnas in the ceRNA network shown in (A). (D) The boxplot shows the expression profile of target mRnas of hsa-miR-296-5p/MRPL42-AS-5. (E) Reverse transcription quantitative polymerase chain reaction (RT-qPCR) was used to validate the seven targeted genes expression of hsa-miR-296-5p/MRPL42-AS-5. (F) RNA fluorescence in situ hybridization (FISH) to detect miR-296-5p expression level in the first row in the figure; the red fluorescence indicates positive signals, and the blue fluorescence shows the nuclei. In the second row, immunofluorescence experiments were performed. Green fluorescence shows the CCND3 protein, and blue fluorescence shows the nuclei using immunofluorescence. The plots on the right side of the figure show the miR-296-5p and CCND3 scores separately, determined by counting the ratio of positive cells from five random regions in each section. *, p ≤ 0.05; **, p ≤ 0.01. Ctrl, control.
First, through co-expression analysis, the miRNA-mRNA co-expression pair with a correlation coefficient of ≤ −0.8 (negative correlation) and a p value of ≤ 0.01 was acquired to ascertain the relationship between miRNA and mRNA. On the one hand, we overlapped the targets of three miRNAs (hsa-miR-296-5p/hsa-miR-423-5p/hsa-miR-671-5p) in Targetscan [Citation14] or mirDB database (http://mirdb.org/) with the miRNA-mRNA co-expression pair. On the other hand, miRanda [Citation12] and Rnahybrid [Citation13] were also used to identify potential new target relationships and overlapped with the miRNA-mRNA co-expression pair. Finally, the above results were combined to determine the potential mRNA-target relationships of the miRNAs (Supplementary Figure S4B).
LncRNA-miRNA and miRNA-mRNA pairs sharing the same miRNA were merged into a lncRNA-miRNA-mRNA interaction as a candidate ceRNA regulatory network (). A significant increase in MRPL42-AS-5 expression after infection was observed (). However, hsa-miR-296-5p, which belongs to the same ceRNA network, exhibited the opposite response (). Moreover, mRNA co-expressed with hsa-miR-296-5p showed similar trends to MRPL42-AS-5 changes (). The target genes in the ceRNA network were primarily associated with the cellular senescence signalling pathway (Supplementary Table S4).
To validate the RNA-Seq data, we performed reverse transcription quantitative polymerase chain reaction (RT-qPCR) to detect the seven target genes (). In addition, we performed fluorescence in situ hybridization (FISH) to detect the expression of hsa-miR-296-5p, and the expression of the target protein CCND3 was assessed by immunofluorescence (IF)().
Discussion
Viral infections trigger a broad host immune response that controls viral replication [Citation15]. However, our understanding of the immunological mechanisms involved in EBV infection is limited, particularly under in vivo conditions, because there are no suitable animal models. Previously, we found that tree shrews are susceptible to EBV infection and exhibit characteristics similar to those of humans [Citation7,Citation16]. Using the tree shrew model, we found dramatic changes within the blood microenvironment with the progression of EBV infection. Notably, the number of naïve CD4+ T cells significantly increased at 3 dpi and then decreased to normal levels at 28 dpi. This finding might result from the proliferation and differentiation of this subgroup of T cells due to stimulation with viral antigens at an early stage of infection. However, not all these changes reached statistical significance, possibly due to the small sample size and individual heterogeneity of the groups.
Increasing evidence suggests that ncRNA is widely involved in immune regulation during viral infection [Citation17–19]. LncRNAs regulate diverse biological functions (e.g. cell survival and cytokine production) in innate immunity and are involved in adaptive immunity (e.g. polarization and function of CD4+ T cells) [Citation20–22]. To analyse DElncRNAs between healthy and infectious conditions, we compared the subgroups separately to the Ctrl group and found that up- or downregulated DElncRNAs showed a much more dramatic shift at 3 dpi. In addition, the PCA showed clear group segregation at various time points post-infection. This finding implies that DElncRNAs play multiple roles during the different stages of EBV infection. Notably, more discrete 3 dpi group samples were presented in the PCA graph, indicating that higher lncRNA-regulated heterogeneity and drastic changes in transcript levels may have amplified this heterogeneity during the initial stages of infection.
Next, we screened 18 highly expressed DElncRNAs strongly associated with changes in the proportion of immune cells through a combined analysis of correlation and relative expression abundance. CD4+ T cell subgroups and M2 macrophages were positively or negatively correlated with multiple DElncRNAs, indicating the involvement of lncRNAs in immune cell mobilization. Co-expressed mRNAs were extracted, and KEGG pathway analysis was performed to probe the function of these 18 DElncRNAs further. Primarily enriched pathways were related to programmed cell death, such as ferroptosis, autophagy, mitophagy, and endocytosis. TLR/RLR and cGAS-STING activation by viral infection may help induce the autophagy pathway, which could enhance interferon production and thus restrict viral replication [Citation23]. While many in vitro studies have been published on the induction of ferroptosis and autophagy signalling pathways by EBV, little is known about whether this occurs in vivo [Citation24–26]. Our results showed that programmed cell death-related signalling pathways play an essential role in the innate immunity of animals by initiating the cell death process to defend against primary EBV infection. Moreover, the enrichment analysis of DEmRNAs showed similar results to the 18 DElncRNA co-expressed mRNAs, which implies a potentially crucial biological function for DElncRNAs involved in regulating programmed cell death.
The ability of EBV to manipulate host miRNAs to escape the immune system allows the infection to persist lifelong without being eliminated [Citation27,Citation28]. This is a dominant feature of EBV infection in the tree shrew model, in which miRNA expression is downregulated. Similar observations were made for Caprine parainfluenza virus type 3 [Citation29] and HIV-1 infections [Citation30]. miRNA expression is linked to type I interferon stimulation [Citation31,Citation32]. We speculate that the immune escape mechanism in EBV infection likely involves inhibiting the NF-kB signalling pathway by these miRNAs, which can affect the interferon level. However, further studies are required to investigate this hypothesis.
The antiviral immune response induces a complex regulatory network involving diverse non-coding and coding RNAs. LncRNAs can be implicated in transcription regulatory processes through the ceRNA mechanism, which indirectly inhibits miRNAs by regulating their target mRNA [Citation6]. We constructed three regulatory networks to explore the ceRNA regulatory mechanisms of EBV infection. Notably, one of these networks showed typical ceRNA features with a significant increase in the MRPL42-AS-5 expression after infection, whereas hsa-miR-296-5p exhibited the opposite response, and the mRNA co-expressed with hsa-miR-296-5p showed similar trends to MRPL42-AS-5 changes. The target genes in the ceRNA network were primarily associated with the cellular senescence signalling pathway, a cellular stress response that recruits immune cells [Citation33]. Therefore, it is interesting to speculate that MRPL42-AS-5 might act as an hsa-miR-296-5p “sponge” and compete with target mRNAs, thus increasing mRNA expression level, which could induce immune cell infiltration through the cellular senescence signalling pathway against EBV infection.
In conclusion, this study provides the first comprehensive analysis of the lncRNA and miRNA profiles of EBV infection at the acute and chronic stages, which could have functional roles in remodelling the immune microenvironment. Importantly, our report revealed ceRNA networks in EBV infection that regulate EBV-host interactions. For example, MRPL42-AS-5 might act as an hsa-miR-296-5p “sponge” and compete with target mRNAs, thus increasing mRNA expression level, which could induce immune cell infiltration through the cellular senescence signalling pathway against EBV infection. Our research provides clear indications of the roles lncRNAs and miRNAs play in the modulation of host immune defence mechanisms against EBV infection. These findings open avenues for developing novel therapeutic strategies and diagnostic tools aimed at combating EBV and its associated conditions. Future studies are recommended to focus on the characterization and functional analysis of these identified RNA molecules to confirm their roles and explore their therapeutic potential in greater depth.
Material and methods
Animal experiments and ethics statement
The experimental workflow is shown in . Six tree shrews (F1 generation, production approval number: SCXK (Dian) 2020–0004, 8 ± 2 months, male and female, 126.3 ± 5.2 g) were acquired from the Kunming Institute of Zoology, Chinese Academy of Sciences. The protocols used in this study were approved by the Animal Ethics Review Committee of the Guangx i Medical University (approval number: 202005015). The experimental protocols strictly followed the “Guiding Principles for the Use and Care of Experimental Animals” issued by the Ministry of Science and Technology of China. The total number of animals and their suffering were minimized according to the 3 R principle.
The animals were randomly assigned to either the experimental (n = 3) or control group (n = 3). The control group was inoculated with 200 µl 1640 Medium, whereas the experimental group was inoculated subcutaneously with 200 µl EBV suspensions (1 × 10⁸ copies/ml) via the femoral vein. Blood samples were collected at 3 dpi and 28 dpi for EBV infection, and the animals were euthanized at 28 dpi with an overdose of sodium pentobarbital. Spleen samples were collected immediately after euthanization. Subsequently, the blood samples (1.5 ml) were used for transcriptome sequencing. Residual blood samples and tissues were used for further laboratory experiments, including in situ hybridization, immunohistochemistry, and transmission electron microscopy. The specific details of each experiment are provided in Supplemental Experimental Procedures.
RNA-Seq data process
Clean data were obtained by removing reads containing adapters, poly-N, and low-quality reads from raw data. The clean data was higher than 12.92 Gb. The percentage of bases whose base recognition accuracy reaches the Q30 standard (the accuracy of base recognition ≥ 99.9%) was > 94.51%. All downstream analyses were based on high-quality clean data.
Reads alignment and differential gene expression analysis
Clean data were aligned to the tree shrew TS3.0 genome (http://www.treeshrewdb.org/download.html) using HISAT2 [Citation34]. Uniquely mapped reads were used to calculate the read number and FPKM for each gene. The expression levels of genes were evaluated using FPKM. DEseq2 was used for differential gene expression analysis [Citation35], which models the original reads and uses a scale factor to explain differences in library depth. Subsequently, DEseq2 estimates the gene dispersion and reduces these estimates to generate more accurate dispersion estimates to model the read count. Finally, the negative binomial distribution model was fitted using DEseq2, and the hypothesis was tested using the Wald or likelihood ratio tests. DEseq2 can be used to analyse the differential expression between two or more samples, and the results can be used to determine whether a gene is differentially expressed by FC (FC ≤ 2, or ≤ 0.5) and false discovery rate (FDR, FDR ≤ 0.05).
Cell-type quantification
The CIBERSORT algorithm (v1.03) [Citation11] with default parameters was used to estimate immune cell fractions using the FPKM values of each expressed gene. A total of 22 immune cell phenotypes were analysed in this study, including seven T cell types (CD8 T, naïve CD4 T, memory CD4 resting T, memory CD4 activated T, T follicular helper, regulatory T cells [Tregs] and T cells gamma delta), naïve and memory B cells, plasma cells, resting and activated NK cells, monocytes, M0, M1, and M2 macrophages, resting and activated dendritic cells, resting and activated mast cells, eosinophils, and neutrophils.
LncRNA prediction and direction identification
We used a pipeline for lncRNA identification similar to that previously reported [Citation36] to systematically analyse the lncRNA expression pattern, which was constructed using StringTie 1.3.3 software [Citation37]. We used four software packages to predict the coding potentials of the lncRNAs: CPC [Citation38], LGC [Citation39], CNCI [Citation40], and CPAT [Citation41].
Differentially expressed miRnas
Differentially expressed miRNAs between paired groups were analysed using edgeR [Citation42] in the R package. A significant p value and FDR were obtained for each miRNA based on the negative binomial distribution model. FCs in gene expression were estimated using the EdgeR statistical package. The criterion for DEmiR was set as |FC| > 1.5 and p ≤ 0.05. The potential miRNA targets were obtained from TargetScan (v8.0) and miRDB (http://mirdb.org/).
Co-expression analysis
We calculated Pearson’s correlation coefficients (PCCs) to explore the regulatory mode between lncRNAs/miRNAs and mRNAs and classified their relationship into three classes: positively correlated, negatively correlated, and non-correlated based on the PCCs value.
Other statistical analyses
The pheatmap package (https://cran.r-project.org/web/packages/pheatmap/index.html) in R was used to perform clustering based on Euclidean distance. The Student’s t-test was used for comparisons between the two groups.
Author contributions
W. X.: Conceptualization, Methodology, Investigation, Visualization, and Writing-Original Draft. N. S.: Resources and Investigation. A. Z. T. and C.Q.L.: Supervision, Project administration, and funding acquisition.
Supplementary Table4 Target_mRNAs_of_ceRNA_network_EnrichKEGG.xlsx
Download MS Excel (11.6 KB)Supplementary Table3 miRNAs_expression_profiles.xlsx
Download MS Excel (30.1 KB)Supplementary Table1 lncRNA_expression_profiles.xlsx
Download MS Excel (732.4 KB)Supplementary Table5 Antibodies used for proteins detection .xlsx
Download MS Excel (9.8 KB)Supplementary Table2 DEmRNAs_EnrichKEGG.xlsx
Download MS Excel (133.1 KB)Acknowledgements
We thank the Experimental Animal Center of Guangxi Medical University for providing technical support for animal feeding. We thank the members of our research groups for providing technical assistance and participating in discussions.
Disclosure statement
No potential conflicts of interest were stated by the author(s).
Data availability statement
Raw data have been deposited at the SRA databank (www.ncbi.nlm.nih.gov/sra) and are available under the accession number PRJNA981676.
Supplementary material
Supplemental data for this article can be accessed online at https://doi.org/10.1080/21505594.2024.2306795
Additional information
Funding
References
- Lieberman PM. Virology. Epstein-Barr virus turns 50. Science. 2014;343(6177):1323–12. doi: 10.1126/science.1252786
- Young LS, Murray PG. Epstein-Barr virus and oncogenesis: from latent genes to tumours. Oncogene. 2003;22(33):5108–5121. doi: 10.1038/sj.onc.1206556
- Jenson HB. Epstein-Barr virus. Pediatr Rev. 2011;32(9):375–83; quiz 384. doi: 10.1542/pir.32.9.375
- Dolcetti R. Cross-talk between Epstein-Barr virus and microenvironment in the pathogenesis of lymphomas. Semin Cancer Biol. 2015;34:58–69. doi: 10.1016/j.semcancer.2015.04.006
- He B, Li W, Wu Y, et al. Epstein-Barr virus-encoded miR-BART6-3p inhibits cancer cell metastasis and invasion by targeting long non-coding RNA LOC553103. Cell Death Dis. 2016;7(9):e2353–e2353. doi: 10.1038/cddis.2016.253
- He C, Zhao X, Lei Y, et al. Whole-transcriptome analysis of aluminum-exposed rat hippocampus and identification of ceRNA networks to investigate neurotoxicity of Al. Molecular therapy. Mol Ther Nucleic Acids. 2021;26:1401–1417. doi: 10.1016/j.omtn.2021.11.010
- Xia W, Chen H, Feng Y, et al. Tree shrew is a suitable animal Model for the study of Epstein Barr Virus. Front Immunol. 2021;12:789604. doi: 10.3389/fimmu.2021.789604
- Holder KA, Russell RS, Grant MD. Natural killer cell function and dysfunction in hepatitis C virus infection. Bio Med Res Int. 2014;2014:903764. doi: 10.1155/2014/903764
- Ravichandran S, Hahn M, Belaunzarán-Zamudio PF, et al. Differential human antibody repertoires following Zika infection and the implications for serodiagnostics and disease outcome. Nat Commun. 2019;10(1):1943. doi: 10.1038/s41467-019-09914-3
- Zuniga EI, Liou L-Y, Mack L, et al. Persistent virus infection inhibits type I interferon production by plasmacytoid dendritic cells to facilitate opportunistic infections. Cell Host & Microbe. 2008;4(4):374–386. doi: 10.1016/j.chom.2008.08.016
- Newman AM, Liu CL, Green MR, et al. Robust enumeration of cell subsets from tissue expression profiles. Nat Methods. 2015;12(5):453–457. doi: 10.1038/nmeth.3337
- John B, Enright AJ, Aravin A, et al. Human MicroRNA targets. Plos Biol. 2004;2(11):e363. doi: 10.1371/journal.pbio.0020363
- Rehmsmeier M, Steffen P, Hochsmann M, et al. Fast and effective prediction of microRNA/target duplexes. RNA. 2004;10(10):1507–1517. doi: 10.1261/rna.5248604
- Lewis BP, Shih I, Jones-Rhoades MW, et al. Prediction of mammalian microRNA targets. Cell. 2003;115(7):787–798. doi: 10.1016/S0092-8674(03)01018-3
- Gao P, Ma X, Yuan M, et al. E3 ligase Nedd4l promotes antiviral innate immunity by catalyzing K29-linked cysteine ubiquitination of TRAF3. Nat Commun. 2021;12(1):1194. doi: 10.1038/s41467-021-21456-1
- Wang Z, Yi X, Du L, et al. A study of Epstein-Barr virus infection in the Chinese tree shrew(Tupaia belangeri chinensis). Virol J. 2017;14(1):193. doi: 10.1186/s12985-017-0859-5
- Ahmed W, Liu Z-F. Long non-coding RNAs: novel players in regulation of immune response upon herpesvirus infection. Front Immunol. 2018;9:761. doi: 10.3389/fimmu.2018.00761
- Zhang J, Li X, Hu J, et al. Long noncoding RNAs involvement in Epstein-Barr virus infection and tumorigenesis. Virol J. 2020;17(1):51. doi: 10.1186/s12985-020-01308-y
- Zhao C-X, Zhu W, Ba Z-Q, et al. The regulatory network of nasopharyngeal carcinoma metastasis with a focus on EBV, lncRnas and miRnas. Am J Cancer Res. 2018;8(11):2185–2209.
- Khan S, Masood M, Gaur H, et al. Long non-coding RNA: an immune cells perspective. Life Sci. 2021;271:119152. doi: 10.1016/j.lfs.2021.119152
- Mowel WK, Kotzin JJ, McCright SJ, et al. Control of immune cell homeostasis and function by lncRnas. Trends Immunol. 2018;39(1):55–69. doi: 10.1016/j.it.2017.08.009
- Sigdel KR, Cheng A, Wang Y, et al. The emerging functions of long noncoding RNA in immune cells: autoimmune diseases. J Immunol Res. 2015;2015:848790. doi: 10.1155/2015/848790
- Chen T, Tu S, Ding L, et al. The role of autophagy in viral infections. J Biomed Sci. 2023;30(1):5. doi: 10.1186/s12929-023-00899-2
- Burton EM, Voyer J, Gewurz BE. Epstein–Barr virus latency programs dynamically sensitize B cells to ferroptosis. Proc Natl Acad Sci, USA. 2022;119(11):e2118300119. doi: 10.1073/pnas.2118300119
- Hung C-H, Chen L-W, Wang W-H, et al. Regulation of autophagic activation by rta of Epstein-Barr virus via the extracellular signal-regulated kinase pathway. J Virol. 2014;88(20):12133–12145. doi: 10.1128/JVI.02033-14
- Wang M-P, Joshua B, Jin N-Y, et al. Ferroptosis in viral infection: the unexplored possibility. Acta Pharmacol Sin. 2022;43(8):1905–1915. doi: 10.1038/s41401-021-00814-1
- Iizasa H, Kim H, Kartika AV, et al. Role of viral and Host microRnas in immune regulation of Epstein-Barr virus-associated diseases. Front Immunol. 2020;11:367. doi: 10.3389/fimmu.2020.00367
- Qiao Y, Zhao X, Liu J, et al. Epstein-Barr virus circRnaome as host miRNA sponge regulates virus infection, cell cycle, and oncogenesis. Bioengineered. 2019;10(1):593–603. doi: 10.1080/21655979.2019.1679698
- Li J, Mao L, Li W, et al. Analysis of microRnas expression profiles in Madin-Darby bovine kidney cells infected with caprine parainfluenza virus type 3. Front Cell Infect Microbiol. 2018;8:93. doi: 10.3389/fcimb.2018.00093
- Farberov L, Herzig E, Modai S, et al. MicroRNA-mediated regulation of p21 and TASK1 cellular restriction factors enhances HIV-1 infection. J Cell Sci. 2015;128(8):1607–1616. doi: 10.1242/jcs.167817
- Bruni R, Marcantonio C, Tritarelli E, et al. An integrated approach identifies IFN-regulated microRnas and targeted mRnas modulated by different HCV replicon clones. BMC Genomics. 2011;12(1):485. doi: 10.1186/1471-2164-12-485
- Skalsky RL, Cullen BR. Viruses, microRnas, and host interactions. Annu Rev Microbiol. 2010;64(1):123–141. doi: 10.1146/annurev.micro.112408.134243
- Kirkland JL, Tchkonia T. Cellular Senescence: A Translational Perspective. EBioMedicine. 2017;21:21–28. doi: 10.1016/j.ebiom.2017.04.013
- Kim D, Paggi JM, Park C, et al. Graph-based genome alignment and genotyping with HISAT2 and HISAT-genotype. Nature Biotechnol. 2019;37(8):907–915. doi: 10.1038/s41587-019-0201-4
- Love MI, Huber W, Anders S. Moderated estimation of fold change and dispersion for RNA-seq data with DESeq2. Genome Biol. 2014;15(12):550. doi: 10.1186/s13059-014-0550-8
- Liu S, Wang Z, Chen D, et al. Annotation and cluster analysis of spatiotemporal- and sex-related lncRNA expression in rhesus macaque brain. Genome Res. 2017;27(9):1608–1620. doi: 10.1101/gr.217463.116
- Kovaka S, Zimin AV, Pertea GM, et al. Transcriptome assembly from long-read RNA-seq alignments with StringTie2. Genome Biol. 2019;20(1):278. doi: 10.1186/s13059-019-1910-1
- Kong L, Zhang Y, Ye Z-Q, et al. CPC: assess the protein-coding potential of transcripts using sequence features and support vector machine. Nucleic Acids Res. 2007;35(suppl_2):W345–W349. doi: 10.1093/nar/gkm391
- Wang G, Yin H, Li B, et al. Characterization and identification of long non-coding RNAs based on feature relationship. Bioinformatics. 2019;35(17):2949–2956. doi: 10.1093/bioinformatics/btz008
- Sun L, Luo H, Bu D, et al. Utilizing sequence intrinsic composition to classify protein-coding and long non-coding transcripts. Nucleic Acids Res. 2013;41(17):e166. doi: 10.1093/nar/gkt646
- Wang L, Park HJ, Dasari S, et al. CPAT: Coding-Potential Assessment Tool using an alignment-free logistic regression model. Nucleic Acids Res. 2013;41(6):e74. doi: 10.1093/nar/gkt006
- Robinson MD, McCarthy DJ, Smyth GK. edgeR: a bioconductor package for differential expression analysis of digital gene expression data. Bioinformatics. 2010;26(1):139–140. doi: 10.1093/bioinformatics/btp616