
 ?Mathematical formulae have been encoded as MathML and are displayed in this HTML version using MathJax in order to improve their display. Uncheck the box to turn MathJax off. This feature requires Javascript. Click on a formula to zoom.
ABSTRACT
Background: Vaccination has been known to reduce morbidity and mortality of infectious diseases since the emergence of the 1st vaccine in the 18th century. That’s why global efforts are directed toward finding a vaccine for COVID-19 in order to eliminate its threat.
The current pandemic of COVID-19 has changed the world affecting all fields significantly as a result of the preventive measures including locking down, social distancing, obligatory mask wearing, stopping flights, etc. The medical field is clearly the most significantly affected starting from altering most of the research efforts toward the new virus passing through the inadequate number of physicians as well as unavailable intensive care unit (ICU) beds. In order to break the restricted preventive measures, we need to minimize the newly infected cases which can be achieved by reaching adequate herd immunity. Moreover, calculating the basic reproduction number (R0) of COVID-19 is crucial to estimate the herd immunity threshold (Ic).
Methods: In this review, we searched PubMed for studies that mentioned the R0 of COVID_19, SARS, and MERS as well as measles, Zika and dengue virus to calculate the herd immunity threshold and the minimal vaccination coverage.
Results: The value of R0 could vary for the same disease and consequently the herd immunity threshold as well as the vaccination coverage. The R0 of COVID-19 ranged widely through various articles from 1.4 to 6.68. As a result, the herd immunity threshold would range from 28.57% to 85.03%. However, the vaccination coverage depends also on the effectiveness of the vaccine which is still unknown.
Conclusion: The calculations of vaccination coverage include many variables such as the R0 of the disease, Ic that depends on that value as well as sensitivity and specificity of the vaccine itself.
Introduction
Basic reproduction number (R0)
Estimating the basic reproduction number (R0) of a certain infectious disease is a crucial step to identify its contagiousness depending on the human behavior as well as the biological characteristics of its pathogen. Consequently, the value of R0 varies according to the pathogen itself as well as the local socio-behavioral and environmental circumstances.Citation1 According to Anderson et al.Citation2 R0 can be defined as “the average number of infections that is produced in a susceptible host population when an infected individual is introduced into that population”.Citation2 It can be calculated mainly depending on three interconnected parameters, namely the duration of contagiousness, the possibility of infection per contact as well as the contact rate.Citation3 The value of R0 gives information about the state of the infection whether it will likely result in an epidemic when R0 > 1 or will probably recede when R0 < 1.Citation2
Vaccination
Vaccination is defined by Merriam-Webster dictionary as a preparation of a microorganism that has been killed or attenuated to increase immunity against a particular disease.Citation4 The first vaccine that was developed in history was the smallpox vaccine. It was manufactured in the year 1796 as a live-attenuated vaccine. Since then, vaccines for several diseases were developed and new types of vaccines have emerged. Different types of vaccinations include killed vaccines, live attenuated vaccines, purified proteins or polysaccharides, and genetically engineered vaccines.Citation5 Since vaccines were introduced they have reduced death and disability caused by infectious diseases; a study was carried in the states showed a more than 90% decrease (between the 20th century and the year2016) in the cases caused by 9 different vaccine-preventable diseases including smallpox. Some of these diseases have been eliminated or reached a 99% reduction.Citation6
Impact on ICU admission
Ritter et al.Citation7 used a simple statistical model which predicted that during the exponential phase of the novel coronavirus, ICU admissions will rise above the capabilities of the health system causing a crisis.Citation7 While in New South Wales, Fox et al.Citation8 predicted that the pinnacle interest in ICU beds was a gauge to be 6,965 ICU beds with a serious mitigation strategy (797% of the ICU limit preceding COVID-19).Citation8 The compartmental model evaluated that under a strategy that could diminish transmission by 33%, at any rate; 5,109 ICU beds would be required (584% of the earlier ICU limit). Therefore, immunization of preventable illnesses and Intensive care medicine has been consistently connected. For example, a single-center study in a Chinese pediatric ICU showed that 9.3% of all admissions were due to vaccine-preventable infections.Citation9 Consequently, introducing vaccines to communicable diseases significantly reduces the need for ICU beds. For instance, Thompson et al.Citation10 showed that introducing the influenza virus vaccine had a significant effect on ICU admission.Citation10 Among hospitalized patients who were flu positive, flu immunization was connected to a 59% abatement in the odds of ICU affirmation and with shorter ICU lengths of remain (LOS).
Methods
Search
We manually searched PubMed for articles discussing the basic reproduction number of the current pandemic SARS-CoV2 as well as other infectious diseases including measles, dengue virus, SARS, and MERS. Then, we extracted the values of R0 from selected studies to calculate the herd immunity as well as vaccination coverage.
Calculations
The value of R0 was used to calculate the herd immunity threshold (Ic) using the following formula:
Then, the Ic was used to calculate the vaccination coverage (Vc) depending on the effectiveness of the vaccine (E) as follows:.Citation11
Results
We reviewed the basic reproduction number of various infectious diseases in six articles which were further classified according to the mode of transmission into airborne, bloodborne, and sexually transmitted diseases as shown in .Citation12–17 Additionally, 4 studies carried out in different countries were reviewed regarding the R0 of COVID-19.Citation12,Citation15,Citation18,Citation19
Table 1. The table compares between the R0 of different infections according to the mode of transmission
R0 of previous infection outbreaks
The value of the basic reproduction number (R0) varies according to the type of pathogen as well as the method of measurement being used. Regarding the pathogen, Villela et al.Citation20 compared the R0 value of both Zika and dengue viruses in Rio de Janeiro, Brazil.Citation20 The value of R0 varied even between the subtypes of dengue virus as R0 of DENV-3 = 1.70 (95% CI: 1.50–2.02) and R0 of DENV-4 = 1.25 (95% CI: 1.18–1.36) while it reached 2.33 (95% CI: 1.97–2.97) for Zika virus. Moreover, the basic reproduction number may be different for the same pathogen according to time, place, and method of measurement. For instance, the R0 of the dengue virus reached 27.2 (95%CI: 14.8, 49.3) during the early phase of the epidemic in Easter Island, Chile.Citation9 On the other hand, Guerra et al. (2017) showed the wide variability of R0 values of measles through literature with different methods of measurement for each study, e.g., R0 = 4.6, 13, and 27 according to Broutin et al. (2005), Merler et al. (2014) and Hooker et al. (2011), respectively.Citation14,Citation21 Similarly, the R0 value of HIV in rural South West Uganda fluctuated from 0.45 in 1992 reaching 36.75 in 2008.Citation17 Furthermore () shows the variability of the R0 value comparing between different modes of transmission.
R0 of COVID-19
The outbreak of COVID-19 started in Wuhan, China causing an epidemic in China later on. At the start of the epidemic, the R0 of COVID-19 in Wuhan was calculated at 2.2, with an average incubation period of 5.2 days.Citation18 Then, the infection spread from China overseas and several studies were conducted to calculate R0 in different countries. Liu et al. (2020) reported the R0 as a range of values between 1.5 and 6.68. Additionally, the average R0 was calculated from 12 different studies to be 3.28 and the median to be 2.79 which is higher than the estimates of the WHO which ranged between 1.4 and 2.5.Citation19 Moreover, the basic reproductive number (R0) was estimated in several countries outside China using different methods and the results were almost equal to the average R0 found in China. The overall outbreak R0 in Peru was approximated to 2.97 according to Roman et al. Also, the stochastic model (a tool used for estimating probability distributions of potential outcomes) was used in the Republic of Korea and Italy to estimate the R0 during the outbreak in the country and it reached 3.2 in Korea and 3.3 in Italy.
This high R0 value for the new coronavirus is very alarming for the rapid spread of the disease and gives an idea about the rapid transmissivity of the infection causing a widespread pandemic. On the other hand, the R0 value of the two previous coronaviruses which elicited two epidemics earlier (in 2003 and 2012, respectively) namely the SARS (Severe Acute Respiratory Syndrome) and MERS (Middle–East Respiratory Syndrome) viruses were a bit lower. Regarding SARS, the R0 was estimated at 2.9 by analyzing data from 1600 cases at the early phase of the epidemic in Hong Kong,Citation12 while it was <1 in the case of the MERS outbreak.Citation13 This emphasizes the importance of restriction measures to halt the spread of this new virus which is turning into a world-dominating pandemic.
R0 and herd immunity
In spite of the variability of R0 values, it is still important for calculating the vaccination coverage needed to achieve herd immunity (the indirect protection of susceptible individuals brought about by the presence of immune individuals in the population).Citation11 To clarify, providing vaccination for the whole population is hard to achieve. However, vaccinating a specific proportion of the population could work as a protective wall for other susceptible persons against getting the infection. This proportion can be calculated depending on the basic reproduction number (R0) of the disease as follows:
where (Ic) is the herd immunity threshold (the fraction of the population that should be vaccinated, if present, to achieve the herd immunity).Citation11 The relation between the basic reproduction number and the herd immunity threshold can be illustrated through the curve drawn in ().
Figure 1. The curve shows the relation between the basic reproduction number and herd immunity threshold.
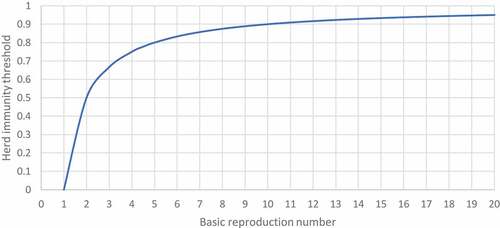
For example, If the R0 of DENV-4 = 1.25 as mentioned above, then 20% of the population at least should be vaccinated.Citation13
On the other hand, the percentage will jump to 96.3% in the case of measles with R0 = 27.
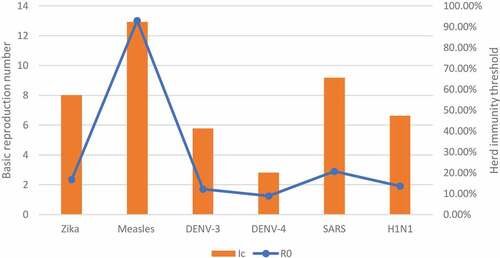
Therefore, the higher the R0, the more the vaccination coverage needed to establish required herd immunity as shown in (, ):
Figure 2. Herd immunity threshold (Ic) of the disease according to the basic reproduction number (R0).
Minimal vaccination coverage for COVID-19
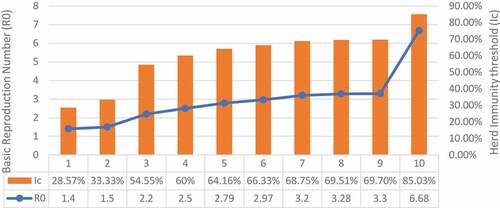
The minimal vaccination coverage against the novel coronavirus can be calculated by estimating the value of herd immunity threshold (Ic) which in turn depends on the value of R0. For example, when the value of R0 = 2.97, 3.2, or 6.68, the proportion of the population that should be vaccinated will be Ic = 66.32%, 68.75%, or 85.03%, respectively ().Citation20
Figure 3. Herd immunity threshold (Ic) of COVID-19 depending on different values of the basic reproductive number (R0).
As explained by Plans-Rubió (2012), these percentages will be valuable if only the vaccine efficacy is 100% which is simply impossible to achieve.Citation21 As a result, the vaccine effectiveness (E) should be put into consideration to calculate the vaccination coverage (Vc) as follows:
Not only that but we should also increase the percentage to overcome the false positive and true negative results of serological tests by estimating the additional vaccination coverage (Va) as follows:
where (P) is the prevalence of positive results and (Pc) is the critical prevalence of positive results which can be calculated through the following equation depending on the specificity (Sp) and sensitivity (Se) of the vaccine:
Consequently, once the vaccine is provided, the basic reproduction number (R0,), herd immunity threshold (Ic), and vaccine effectiveness (E), specificity (Sp), and sensitivity (Se) should be estimated to determine the least percentage of the population that should receive that vaccine in order to achieve herd immunity essential for protecting susceptible persons.
Discussion
R0 of COVID-19 compared with previous outbreaks
The value of R0 of COVID-19 varied widely from 1.4 to 6.68 with a mean (from mentioned values) of 2.98 which makes the current pandemic higher than previous outbreaks mentioned above including SARS, dengue, Zika, H1N1 with exception to measles that had the highest value reaching R0 = 13. As a result, the vaccination coverage needed to achieve the herd immunity against COVID-19 will be more than that of other diseases regardless of additional factors related to the vaccine itself.
The variability of R0 and herd immunity
The values of R0 and the subsequent calculation of values required for herd immunity are not absolute. The simplest method used for the calculation depends on the “core model – homogeneous population” which assumes that the whole population is homogeneous disregarding the socioeconomic and ethnic differences which can affect the virus distribution and spread. Therefore, the calculations of herd immunity based on these models are not always accurate. As regards the R0 value of the virus, several factors can cause variability in the numbers thus altering the measurements and calculations. Two studies were conducted in UK and Germany proved that the social distancing and control measures applied in the community have great effects on the R0 value which unfortunately means that all calculations performed can have a margin of error as many variables affecting the outcomes are not taken into consideration.
Summary
The basic reproduction number as well as the herd immunity threshold is essential to calculate the minimal vaccination coverage to help in protecting susceptible persons from catching the disease. However, there are some other factors that we should be aware of while calculating this percentage. In the case of the novel coronavirus, the value of R0 is more than 1 which means it is spreading causing infection to more people. Herd immunity aims to make R0 = 1 maximally. As a result, the state of infection will be stable, and no preventive measures will be needed.
Disclosure of potential conflicts of interest
No potential conflicts of interest were disclosed.
Additional information
Funding
References
- Delamater PL, Street EJ, Leslie TF, Yang YT, Jacobsen KH. Complexity of the basic reproduction number (R0). Emerg Infect Dis. 2019;25(1):1–4. doi:10.3201/eid2501.171901.
- Anderson RM, Robert M. Infectious diseases of humans: dynamics and control. Oxford Science Publications; 1991 May. p. 36, 118.
- Viceconte G, Petrosillo N. COVID-19 R0: magic number or conundrum? Infect Dis Rep. 2020;12(1):8516. doi:10.4081/idr.2020.8516.
- Merriam-Webster I. Merriam-webster online dictionary. Springfield (MA); 2008. Author Retrieved July. Published online.
- Plotkin S. History of vaccination. Proc Natl Acad Sci U S A. 2014;111(34):12283–87. doi:10.1073/pnas.1400472111.
- Orensteina WA, Ahmedb R. Simply put: vaccination saves lives. Proc Natl Acad Sci U S A. 2017;114(16):4031–33. doi:10.1073/pnas.1704507114.
- Pittet LF, Abbas M, Siegrist C-A, Pittet D. Missed vaccinations and critical care admission: all you may wish to know or rediscover—a narrative review. Int Care Med. 2019. doi:10.1007/s00134-019-05862-0.
- Thompson MG, Pierse N, Sue Huang Q, Prasad N, Duque J, Claire Newbern E, … McArthur C. Influenza vaccine effectiveness in preventing influenza-associated intensive care admissions and attenuating severe disease among adults in New Zealand 2012–2015. Vaccine. 2018. doi:10.1016/j.vaccine.2018.07.028.
- Plans-Rubió P. Evaluation of the establishment of herd immunity in the population by means of serological surveys and vaccination coverage. Human Vacc Immunother. 2012 Feb;8(2):184–88. doi:10.4161/hv.18444.
- Donnelly CA, Ghani AC, Leung GM, Hedley AJ, Fraser C, Riley S, … Anderson RM. Epidemiological determinants of spread of causal agent of severe acute respiratory syndrome in Hong Kong. Lancet. 2003;361(9371):1761–66. doi:10.1016/s0140-6736(03)13410-1.
- Petrosillo N, Viceconte G, Ergonul O, Ippolito G, Petersen E. COVID-19, SARS and MERS: are they closely related? Clin Microbiol Infect. 2020. doi:10.1016/j.cmi.2020.03.026.
- Merler S, Ajelli M. Deciphering the relative weights of demographic transition and vaccination in the decrease of measles incidence in Italy. Proc Biol Sci. 2014;281:20132676.
- Liu W, Tang S, Xiao Y. Model selection and evaluation based on emerging infectious disease data sets including A/H1N1 and Ebola. Comput Math Methods Med. 2015;2015:207105.
- Chowell G, Fuentes R, Olea A, Aguilera X, Nesse H, Hyman JM. The basic reproduction number R0 and effectiveness of reactive interventions during dengue epidemics: the 2002 dengue outbreak in Easter Island, Chile. Math Biosci Eng. 2013;10(5–6):1455–74. doi:10.3934/mbe.2013.10.1455.
- Nsubuga RN, White RG, Mayanja BN, Shafer LA. Estimation of the HIV basic reproduction number in rural south west Uganda: 1991-2008. PLoS One. 2014;9(1):e83778. doi:10.1371/journal.pone.0083778. Published 2014 Jan 3
- Wang Y, Wang Y, Chen Y, Qin Q. Unique epidemiological and clinical features of the emerging 2019 novel coronavirus pneumonia (COVID-19) implicate special control measures. J Med Virol. 2020. doi:10.1002/jmv.25748.
- Liu Y, Gayle AA, Wilder-Smith A, Rocklöv J. The reproductive number of COVID-19 is higher compared to SARS coronavirus. J Travel Med. 2020;27:2. doi:10.1093/jtm/taaa02.
- VILLELA D, BASTOS L, DE Carvalho L, CRUZ O, GOMES M, DUROVNI B, … CODEÇO C. Zika in Rio de Janeiro: assessment of basic reproduction number and comparison with dengue outbreaks. Epidemiol Infect. 2017;145(8):1649–57. doi:10.1017/S0950268817000358.
- Hooker G, Ellner SP, Roditi Lde V, Earn DJ. Parameterizing state-space models for infectious disease dynamics by generalized profiling: measles in Ontario. J R Soc Interface. 2011;8:961–74.
- Torres-Roman JS, Kobiak IC, Valcarcel B, Diaz-Velez C, La Vecchia C. The reproductive number R0 of COVID-19 in Peru: an opportunity for effective changes. Travel Med Infect Dis. 2020:101689. doi:10.1016/j.tmaid.2020.101689.
- Zhuang Z, Zhao S, Lin Q, Cao P, Lou Y, Yang L, … Xiao L. Preliminary estimating the reproduction number of the coronavirus disease (COVID-19) outbreak in Republic of Korea and Italy by 5 March 2020. Int J Infect Dis. 2020. doi:10.1016/j.ijid.2020.04.044.