
ABSTRACT
Upper respiratory tract infection (URTI) is common in humans. We sought to profile sputum pathogen spectrum and impact of URTI on acute exacerbation of bronchiectasis (AE). Between March 2017 and December 2021, we prospectively collected sputum from adults with bronchiectasis. We stratified AEs into events related (URTI-AE) and unrelated to URTI (non-URTI-AE). We captured URTI without onset of AE (URTI-non-AE). We did bacterial culture and viral detection with polymerase chain reaction, and explored the pathogen spectrum and clinical impacts of URTI-AE via longitudinal follow-up. Finally, we collected 479 non-AE samples (113 collected at URTI-non-AE and 225 collected at clinically stable) and 170 AE samples (89 collected at URTI-AE and 81 collect at non-URTI-AE). The viral detection rate was significantly higher in URTI-AE (46.1%) than in non-URTI-AE (4.9%) and URTI-non-AE (11.5%) (both P < 0.01). Rhinovirus [odds ratio (OR): 5.00, 95% confidence interval (95%CI): 1.06–23.56, P = 0.03] detection was independently associated with URTI-AE compared with non-URTI-AE. URTI-AE tended to yield higher viral load and detection rate of rhinovirus, metapneumovirus and bacterial shifting compared with URTI-non-AE. URTI-AE was associated with higher initial viral loads (esp. rhinovirus, metapneumovirus), greater symptom burden (higher scores of three validated questionnaires) and prolonged recovery compared to those without. Having experienced URTI-AE predicted a greater risk of future URTI-AE (OR: 10.90, 95%CI: 3.60–33.05). In summary, URTI is associated with a distinct pathogen spectrum and aggravates bronchiectasis exacerbation, providing the scientific rationale for the prevention of URTI to hinder bronchiectasis progression.
Introduction
Recurrent airway infections, inflammation and irreversible airway dilation are hallmarks of bronchiectasis [Citation1], a chronic suppurative disease punctuated by recurrent episodes of acute exacerbation (AE) throughout the course of progression. AE is characterized by significant symptom aggravation and heightened inflammation, predisposing to poor clinical outcomes [Citation2,Citation3]. Prevention of AE has been the holy grail of bronchiectasis management. Pathogens can be readily detected in bronchiectasis [Citation4,Citation5]. Apart from bacteria [Citation6,Citation7], viruses frequently trigger AE onset.
Upper respiratory tract infection (URTI) is usually a self-limiting disorder [Citation8–11] in humans and triggers exacerbations of chronic respiratory diseases [Citation10,Citation12]. Half of asthma exacerbations were triggered by URTIs associated with rhinovirus [Citation13,Citation14], and inhaled corticosteroids have been associated with an increased risk of URTI in asthmatic patients [Citation15]. In chronic obstructive pulmonary disease (COPD), 83% of patients with acute exacerbation have reported URTI symptoms, and viral infections accounted for 44% of the URTIs, which markedly increased the risk of future exacerbations of COPD [Citation9]. At exacerbation of COPD, the increase in respiratory symptom burden was most notable in patients with URTI who had virus being detected as compared with those with either URTI alone, or virus being detected alone, or neither [Citation9]. Frequent exacerbators of COPD experienced significantly more URTIs than non-frequent exacerbators, and the exacerbation frequency was closely associated with a greater frequency of acquiring URTIs, but not with a greater likelihood of experiencing exacerbations [Citation8]. These findings have provided the important scientific rationales linking URTIs to the exacerbation of chronic respiratory diseases.
Based on a longitudinal study with a smaller sample size, we have previously demonstrated that, in adults with bronchiectasis, bacterial shifting (e.g. emergence of a new pathogenic bacteria) predisposed to AE onset [Citation16], and yielded greater lower airway symptom burden, whereas those with virus detected yielded greater upper airway symptom burden. However, the association between URTI and bronchiectasis has not been well elucidated. The present study sought to explore: (1) the lower airway pathogen spectrum, (2) the impact of URTI on the symptom burden, (3) the duration of recovery, and (4) the future risks of AE in bronchiectasis.
Bridging this knowledge gap will help identify the cardinal pathogens of AE and clarify their association with URTIs, thereby justifying the prompt identification and prevention of URTI to minimize the future risks of AE in bronchiectasis.
Methods
Study participants
In this single-center cohort study, we consecutively enrolled adult patients with non-cystic fibrosis bronchiectasis [Citation1,Citation17] who could spontaneously produce sputum from out-patients clinics, between March 2017 and December 2021. All patients remained clinically stable upon enrolment, defined as not experiencing AE (see criteria below) for >4 weeks. We excluded patients with active pulmonary tuberculosis, non-tuberculous mycobacteria infection, severe systemic diseases or providing insufficient sputum (typically <5 mL/day). The Ethics Committee of The First Affiliated Hospital of Guangzhou Medical University (Medical Ethics [2012] the 33th; Medical Ethics [2020] the 156th) gave ethics approval, with all patients providing written informed consent.
Study design and procedures
By extending our clinical observations and allowing for the inclusion of the detailed clinical data with a greater sample size, we evaluated bronchiectasis patients when clinically stable at initial visits for history inquiry, aetiology screening, spirometry, chest high-resolution computed tomography, history of exacerbation, concomitant use of medications, and collection of venous blood. We collected spontaneous sputum (having a considerable concordance of viral detection status compared with nasal swab) [Citation18] to explore the viral spectrum in sputum.
We prospectively followed-up patients when clinically stable, at 3-to-6-month intervals, to capture AEs and URTIs. Patients were instructed to return for unscheduled out-patient clinics in case of significant symptom worsening, except for those who had experienced AEs for >7 days or had been treated with antibiotics for >48 h. We collected sputum and evaluated the symptom burden at AE onset (Day 1 – the first day when patients attended a clinical visit after an exacerbation onset), Days 4, 7 and 14 post-AE and at the next stable visit with three validated tools as described below (). We also collected blood at onset of AE. For the analysis of the future risk of exacerbation of URTI-AE, a 1-year period was included to calculate the frequency of exacerbation after the onset of a URTI-AE or non-URTI-AE event. See Online Supplement for details.
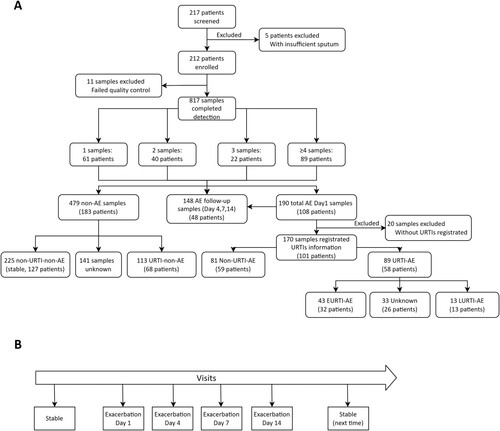
Figure 1. Study flow chart. (A) Main study flow chart; (B) A schematic diagram of the visits for sampling during AE. 1–3 samples: the number of sputum samples collected from the same patient; ≥4 samples: 89 patients collected 4 or more sputum samples; Clinical stable: patients did not have an exacerbation at outpatient visit; AE: acute exacerbation; Day1: outpatient visit at AE onset; Days 4,7,14: days 4, 7, 14 after the onset of AE; URTI: Upper respiratory tract infection; URTI-AE: URTI-related AE as an AE occurring within 21 days of URTI; Non-URTI-AE: the AE without onset of URTI; EURTI-AE: AE occurring within 3 days following the onset of URTI; LURTI-AE: AE occurring 3 days after but less than 21 days following onset of URTI. URTI-non-AE: URTI without onset of AE; non-URTI-non-AE: mean stable, without URTI and without onset of AE.
AEs denoted significant deterioration of three or more symptoms lasting for ≥48 h (cough; sputum volume and/or consistency; sputum purulence; breathlessness and/or exercise tolerance; fatigue and/or malaise; haemoptysis) that required immediate changes in treatment [Citation19]. We categorized the severity of AEs into mild (requiring oral treatment only), moderate (requiring intravenous antibiotics) and severe (requiring hospitalization and/or death) [Citation20,Citation21]. URTIs denoted a new onset of upper airway symptoms or, in patients with pre-existing nasal disorders, an exacerbation of upper airway symptoms (runny nose, nasal congestion, sneezing, sore throat, hoarseness, or itching) for ≥48 h [Citation8–10].
We defined URTI-related AE (URTI-AE) as an AE occurring within 21 days after URTI [Citation22], and non-URTI-AE as an AE without onset of URTI. We stratified URTI-AE into early- (EURTI-AE) as within 3 days and late-onset URTI-AE (LURTI-AE) as after 3 days following the onset of URTI [Citation9]. We also defined URTI-non-AE as the URTI without an onset of AE in the previous month. We defined non-AE as the clinical status not related to AE, including URTI-non-AE and non-URTI-non-AE (clinically stable) (Figure S1).
The Bronchiectasis Exacerbation and Symptom Tool (BEST) could accurately capture daily AE symptoms in chronic respiratory diseases (validated for bronchiectasis [Citation23]). The highest score was 26 points, the minimal score was 0 point, and the minimal clinically important difference (MCID) was 4 points [Citation23]. Higher scores indicated greater symptom burden. Furthermore, both COPD Assessment Tool (CAT) [Citation24] and EXAcerbations of Chronic pulmonary disease Tool (EXACT) [Citation25] were also applied to evaluate the symptom burden(see Online Supplement for further details).
Sample processing and molecular assays
We collected qualified sputum [Citation26] by instructing patients to forcefully cough up after thoroughly gargling mouth with distilled water, and immediately split it for bacterial culture [Citation16] and the remainder was stored frozen at −80°C. We extracted nucleic acids from homogenized sputum by using TaKaRa MiniBEST Viral RNA/DNA Extraction Kit (Takara Bio Inc., San Jose, USA) [Citation16] and detected with a qualitative detection kit for 19 common respiratory viruses(Guangzhou HuYanSuo Medical Technology Co. Ltd, Guangzhou, China) [Citation16,Citation18] by using Applied Biosystems QuantStudio™ 5/7 Real-Time System (ThermoFisher Scientific, USA). The viral load was calculated as the cycle threshold (Ct), with the positivity being defined as a Ct of less than 40 [Citation16].
We defined bacterial shifting as the isolation of new bacterial species according to sputum culture at the onset of AE compared with that within the last clinically stable visit. We also measured systemic (blood cell count and C-reactive protein) and airway [sputuminterleukin-1β, interleukin-17A and interferon alpha inducible protein 27 (IFI27)] inflammatory markers (see Online Supplement for details).
Statistical analysis
Based on our pilot investigations, the expected viral detection rate was <10% in non-URTI-AE and 20% greater in URTI-AE than in non-URTI-AE. 78 samples per group would be needed based on a two-sided significance of 0.05 and a power of 80%, considering a 20% drop-out rate. Assuming that AE accounted for ∼30% of visits, 520 samples (174 AE samples, with each patient providing ∼3 samples) would be needed.
Statistical analyses were performed with IBM SPSS Statistics version 25, Graphpad Prism 9.00 and R software version 4.0.5. Continuous variables were presented as mean ± standard deviation or median [interquartile range (IQR) or the first quartile to the third quartile (Q1–Q3)], and compared with independent or paired t-test, non-parametric test, one-way analysis-of-variance (including the model for repeated measures) as appropriate. Categorical variables were presented as counts (percentages), and compared with chi-square test or Fisher's exact test. Repeated tests of AE samples (e.g. viral detection) for the same patient were analysed with generalized estimating equation (GEE) to explore the association between demographics and clinical parameters. Markov chain model was applied to assess the transition probabilities of different types of AE during follow-up, and the Andersen–Gill model was used to analyse the effect of covariates on the transition probability of URTI-AE and non-URTI-AE. The future risk of AE was also analysed with the use of Kaplan–Meier method, with comparisons between the two curves with log-rank test. The median time to the first AE was reported. We defined statistical significance as P < 0.05.
Results
Subject enrolment and characteristics
Of 217 bronchiectasis patients enrolled, 5 with insufficient sputum were excluded, leaving 212 patients who provided 817 samples. 479 samples were collected when non-AE, including 113 samples (from 68 patients) in URTI-non-AE, 225 samples (from 127 patients) in non-URTI-non-AE (stable), and the remaining without symptom questionnaire matching data. A total of 108 patients with AE provided 190 AE samples, 20 of which did not have the corresponding respiratory tract symptoms at the beginning of sample collection. Therefore, 170 AE samples (from 101 patients) with complete information were included in the final analysis (). A total of 89 AE samples (from 58 patients) corresponded to URTI-AE and 81 AE samples (from 59 patients) to non-URTI-AE. 16 patients provided both URTI-AE and non-URTI-AE samples. Only 56 samples (from 45 patients) had registered the exact timing of URTI for further stratification into 43 EURTI-AE samples (from 32 patients) and 13 LURTI-AE samples (from 13 patients).
Overall, the mean age was 48.6 years, with 62.3% being females in the AE cohort. Most patients were never-smokers who predominantly had post-infective or idiopathic bronchiectasis. The median Bronchiectasis Severity Index was 6.0. The median follow-up time was 34.6 (IQR: 32.1–37.0) months. 192 (90.6%) patients completed the 1-year follow-up when clinically stable and 151 (71.2%) patients were followed-up for 2-years or longer. Baseline characteristics were comparable between URTI-AE, non-URTI-AE and URTI-non-AE (), and between EURTI-AE and LURTI-AE (Table S1).
Table 1. Baseline characteristic of the study participants.
Timing and pathogen detection status of URTI-AE
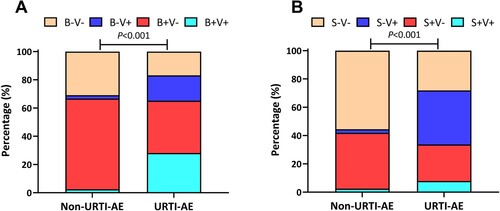
Overall, URTI-AE more frequently occurred in winter and spring (January, April, September, and December), while non-URTI-AE in summer (June to August, 28 vs. 18 events compared with URTI-AE, P = 0.03) and autumn (October). However, the incidence of URTI-AE and non-URTI-AE were similar among the four seasons (Figure S2). Compared with non-URTI-AE, the overall pathogen spectrum differed considerably in URTI-AE, especially when viruses could be detected (). Despite a similar rate of bacterial detection (65.2% vs. 66.7%, P = 0.84), markedly more patients had bacteria-virus co-detection in URTI-AE (28.1% vs. 2.5%, P < 0.001), where 33.7% of patients had bacterial shifting at AE onset. Viral detection favoured URTI-AE compared with non-URTI-AE regardless of the bacterial isolation status.
Figure 2. The pathogen detection status of URTI-AE and non-URTI-AE. (A) The pathogen distribution of bacteria and viruses between URTI-AE and non-URTI-AE; (B) The pathogen distribution of bacteria shifting and viruses between URTI-AE and non-URTI-AE. P < 0.001 for the ratio between URTI-AE (n = 89) and non-URTI-AE (n = 81) according to the chi-square test (A) or Fisher’s test (B). URTI-AE: exacerbation associated with URTI; non-URTI-AE: acute exacerbation not associated with URTI. B + V+: both bacteria and virus detected; B + V−: bacteria detected but no virus detected; B−V+: virus detected but no bacteria detected; B−V−: neither bacteria nor virus detected. S + V+: bacterial spectrum shifting with virus detected, S + V−: bacterial shifting but no virus detected; S−V+: no bacterial shifting with virus detected; S−V−: neither bacterial shifting nor virus detected.
No significant difference in pathogen detection rates was found prior to, and during, the COVID-19 outbreaks (see Online Supplement).
Pathogen spectrum in URTI-AE
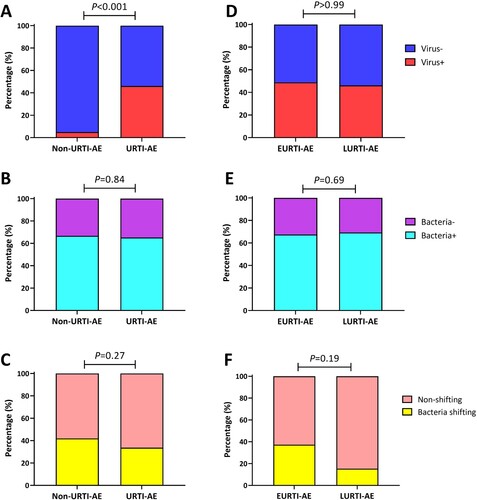
URTI-AE yielded a higher viral detection rate than non-URTI-AE (46.1% vs. 4.9%, P < 0.001) ((A)). However, there were no significant differences with regard to the rate of bacterial detection ((B)) or colonization (Figure S3) between URTI-AE and non-URTI-AE, where the rate of bacterial shifting was also similar (33.7% vs. 42.0%, P = 0.27, (C)). Neither the viral or bacterial detection rate, or bacterial shifting differed between EURTI-AE and LURTI-AE (all P > 0.05, (D–F)). Meanwhile, the viral load was markedly higher in URTI-AE than in non-URTI-AE [median (Q1–Q3) of Ct: 40.0 (29.6–40.0) vs. 40.0 (40.0–40.0), P < 0.001] but did not differ between EURTI-AE and LURTI-AE (Figure S4A,B). Furthermore, the viral load was significantly lower in patients with bacterial shifting than those without [median (Q1–Q3) of Ct: 40.0 (40.0–40.0) vs. 40.0 (31.4–40.0), P < 0.01, Figure S4C].
Figure 3. Pathogen detection status associated with URTI-AE. (A) The rate of viral detection in URTI-AE and non-URTI-AE; (B) The rate of bacterial detection in URTI-AE and non-URTI-AE; (C) The rate of bacterial shifting in URTI-AE and non-URTI-AE; (D) The rate of viral detection in EURTI-AE and LURTI-AE; (E) The rate of bacterial detection in EURTI-AE and LURTI-AE; (F) The rate of bacterial shifting in EURTI-AE and LURTI-AE. URTI-AE: n = 89; non-URTI-AE: n = 81; EURTI-AE: n = 43; LURTI-AE: n = 13. Chi-square test was applied for all comparisons. URTI-AE: AE associated with URTI; Non-URTI-AE: AE not associated with URTI; EURTI-AE: AE occurring within 3 days after the onset of URTI; LURTI-AE: AE occurring more than 3 days after the onset of URTI; Virus-: no virus detected; Virus+: any virus detected; Bacteria-: no bacteria detected; Bacteria+: any bacteria detected; Bacteria shifting: bacteria differed at exacerbation compared with the stable visit; Non-shifting: no bacterial shifting at exacerbation compared with the stable visit.
We next characterized the pathogen spectrum of URTI-AE. The top 5 viruses in URTI-AE were rhinovirus (11.2%), influenza virus (11.2%), coronavirus (10.1%), metapneumovirus (9.0%) and herpes simplex virus (HSV, 6.7%). The dominant viruses in non-URTI-AE were rhinovirus (2.5%), influenza virus (1.2%), coronavirus (1.2%) and adenovirus (1.2%). Both metapneumovirus and HSV were almost solely detected in URTI-AE compared with non-URTI-AE ((A), Figure S5A). Compared with non-URTI-AE, rhinovirus [odds ratio (OR): 5.00, 95% confidence interval (95%CI): 1.06-23.56, P = 0.03] being detected at AE onset was significantly associated with URTI-AE. Data of other viruses were shown in the Online Supplement.
Figure 4. The pathogen spectrum of URTI-AE. Shown are the different rates or pathogen spectrum among non-URTI-AE and URTI-AE: (A) The detection rate of the top 5 viruses; (B) The threshold cycle (Ct) of rhinovirus; (C) The Ct of influenza virus; (D) The Ct of coronavirus; (E) The Ct of metapneumovirus; (F) The Ct of HSV. URTI-AE: n = 89; non-URTI-AE: n = 81; EURTI-AE: n = 43; LURTI-AE: n = 13. *: P < 0.05; **: P < 0.01; ns: P > 0.05. P value was calculated based on the chi-square or Fisher’s test for comparisons of the rate, or Mann–Whitney U test for comparisons of the Ct. RV: rhinovirus, included rhinovirus A and B; Inf: influenza virus, included influenza virus A, B and H1N1; CoV: coronavirus, included coronavirus OC43, 299E, HKU1 and NL63; HpMV: human metapneumovirus; HSV: herpes simplex virus; Others included parainfluenza virus 1-4, bocavirus, respiratory syncytial virus, enterovirus and adenovirus; URTI-AE: AE associated with URTI; Non-URTI-AE: AE not associated with URTI; EURTI-AE: AE occurring within 3 days after the onset of URTI; LURTI-AE: AE occurring more than 3 days after the onset of URTI.
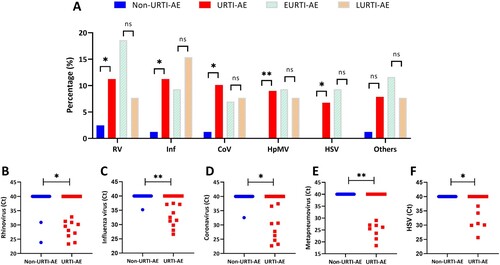
Stratification of the timing of URTI-AE revealed overall similar detection rates of viruses between EURTI-AE and LURTI-AE ((A)). The top 5 viruses in EURTI-AE were rhinovirus (18.6%), influenza virus, metapneumovirus, HSV (9.3% each), and parainfluenza and coronavirus (both 7.0%). The dominant viruses in LURTI-AE were influenza virus (15.4%) and rhinovirus, metapneumovirus, coronavirus and respiratory syncytial virus (7.7% each). However, the most common virus was rhinovirus (38.1%, 8/21) in the virus-positive EURTI-AE and influenza virus (33.3%, 2/6) in the virus-positive LURTI-AE, respectively. Metapneumovirus detection was not affected by the timing of URTI-AE. HSV was almost exclusively detected in EURTI-AE ((A), Figure S5B). Viral loads of the top 5 viruses were all significantly higher in URTI-AE compared with non-URTI-AE ((B–F)).
The inflammatory biomarker expression levels were comparable between URTI-AE and non-URTI-AE. See details in the Online Supplement.
URTI-AE was associated with greater symptom burden
At AE onset, the dominant symptoms were increased sputum volume, greater sputum purulence, aggravated cough and fatigue for both URTI-AE and non-URTI-AE. Three validated questionnaires (BEST [n = 60], CAT [n = 44] and EXACT [n = 41] scores) were adopted to simultaneously evaluate daily symptoms.
Overall, the mean symptom scores of the BEST questionnaire were consistently higher at AE onset compared with stable state, decreased after antibiotics therapy, returned to baseline levels at Day 7, and decreased further at Day 14. URTI-AE was associated with a consistent increase at AE onset (P < 0.001) and at Day 4 (P < 0.01), followed by a nominal reduction at Day 7 (P = 0.76) compared with the clinically stable visit ((A)). Although the baseline scores were comparable, the scores of BEST at Day 4 post-AE onset were markedly higher in URTI-AE than in non-URTI-AE (P = 0.02). Furthermore, URTI-AE was associated with a markedly prolonged recovery compared with non-URTI-AE (7 vs. 4 days, defined as the date when the symptom score was not significantly different from the clinically stable state). The scores of BEST between URTI-AE and non-URTI-AE were not materially altered regardless of the baseline scores, or bacterial and viral detection status at AE onset ((B–D)).
Figure 5. Temporal changes in the symptom burdens of URTI-AE and non-URTI-AE. We have conducted symptom questionnaire survey since July 2020. We have included the complete data at different visits for analysis only. (A) The temporal patterns in symptoms burden of URTI-AE and non-URTI-AE (absolute measured values) evaluated with the BEST score; (B) The temporal changes in symptoms burden of URTI-AE and non-URTI-AE, evaluated with the BEST score as compared with clinically stable visits. (C) Changes in the BEST scores at AE onset compared with the score at stable visit with or without URTI stratified by different bacteria and viruses detection status; and (D) Changes in the BEST scores at AE onset compared with the score at stable visit with or without URTI stratified by bacterial shifting and viruses detection status. For the BEST score, the sample size was 26 for URTI-AE and 34 for non-URTI-AE. Δ: Score of Day 1, 4, 7, 14 minus score of Stable state, respectively. Data from the last or the subsequent stable state following an AE were included in the analysis. The one-way analysis-of-variance model of repeated measures was applied in Panel A (coloured shade for the 95% confidence interval of the mean). #: P < 0.05 denoted statistically significant difference in the score between AE onset or the time points after the onset of AE compared with stable status in URTI-AE. &: P < 0.05 denoted statistically significant difference in the score between AE onset or the time points after the onset of AE compared with stable status in non-URTI-AE. The Mann–Whitney U test was applied between the two groups in (B–D) [(error bars for the medians (IQR)]. *: P < 0.05 between groups. The date of symptom recovery was ascertained if the symptom score was not significantly different from the baseline levels (Stable state). Stable: no onset of URTI or AE; AE: acute exacerbation; URTI-AE: AE associated with URTI; Non-URTI-AE: AE not associated with URTI; BEST: the Bronchiectasis Exacerbation and Symptom Tool; Day 1: outpatient visit at AE onset; Day 4, 7, 14: days 4, 7, 14 after the onset of AE. B + V+: both bacteria and virus detected; B + V−: bacteria detected but no virus detected; B−V+: virus detected but no bacteria detected; B−V−: neither bacteria nor virus detected. S + V+: bacterial spectrum shifting with virus detected, S + V−: bacterial shifting but no virus detected; S−V+: no bacterial shifting with virus detected; S−V−: neither bacterial shifting nor virus detected.
![Figure 5. Temporal changes in the symptom burdens of URTI-AE and non-URTI-AE. We have conducted symptom questionnaire survey since July 2020. We have included the complete data at different visits for analysis only. (A) The temporal patterns in symptoms burden of URTI-AE and non-URTI-AE (absolute measured values) evaluated with the BEST score; (B) The temporal changes in symptoms burden of URTI-AE and non-URTI-AE, evaluated with the BEST score as compared with clinically stable visits. (C) Changes in the BEST scores at AE onset compared with the score at stable visit with or without URTI stratified by different bacteria and viruses detection status; and (D) Changes in the BEST scores at AE onset compared with the score at stable visit with or without URTI stratified by bacterial shifting and viruses detection status. For the BEST score, the sample size was 26 for URTI-AE and 34 for non-URTI-AE. Δ: Score of Day 1, 4, 7, 14 minus score of Stable state, respectively. Data from the last or the subsequent stable state following an AE were included in the analysis. The one-way analysis-of-variance model of repeated measures was applied in Panel A (coloured shade for the 95% confidence interval of the mean). #: P < 0.05 denoted statistically significant difference in the score between AE onset or the time points after the onset of AE compared with stable status in URTI-AE. &: P < 0.05 denoted statistically significant difference in the score between AE onset or the time points after the onset of AE compared with stable status in non-URTI-AE. The Mann–Whitney U test was applied between the two groups in (B–D) [(error bars for the medians (IQR)]. *: P < 0.05 between groups. The date of symptom recovery was ascertained if the symptom score was not significantly different from the baseline levels (Stable state). Stable: no onset of URTI or AE; AE: acute exacerbation; URTI-AE: AE associated with URTI; Non-URTI-AE: AE not associated with URTI; BEST: the Bronchiectasis Exacerbation and Symptom Tool; Day 1: outpatient visit at AE onset; Day 4, 7, 14: days 4, 7, 14 after the onset of AE. B + V+: both bacteria and virus detected; B + V−: bacteria detected but no virus detected; B−V+: virus detected but no bacteria detected; B−V−: neither bacteria nor virus detected. S + V+: bacterial spectrum shifting with virus detected, S + V−: bacterial shifting but no virus detected; S−V+: no bacterial shifting with virus detected; S−V−: neither bacterial shifting nor virus detected.](/cms/asset/9b5514ae-ec7d-4d8d-8c8c-78ffc588fd02/temi_a_2202277_f0005_oc.jpg)
The scores of the CAT but not EXACT questionnaires at parallel time points yielded similar findings (Figure S6). See details in the Online Supplement.
URTI-AE predicted the exacerbation risks of AE
Only 86 AE samples had clearly registered the onset of URTI within the 1-year follow-up period. The exacerbation frequency at 1-year after AE events was significantly higher for URTI-AEs than for non-URTI-AEs (median: 1.5 vs. 1.0 per year, P < 0.05).
The GEE model showed that, although patients with URTI-AE had a similar risk of experiencing any AE (including moderate-to-severe AE), they were significantly more likely to experience URTI-AE at longitudinal follow-up compared with patients with non-URTI-AE (OR: 10.90, 95%CI: 3.60–33.05) ((A)).
Figure 6. URTI-AE associated with bronchiectasis and the corresponding transfer probability. (A) The generalized estimating equation models were adjusted for age, sex and BSI score. Three AEs without information pertaining to the severity were excluded from analysis. Ultimately, 110 AE samples had the corresponding AE occurrence and severity within a following 1-year period, where 86 AE samples had registered URTI occurrence and other 24 samples were excluded from analysis due to missing of the core data. URTI: Upper respiratory tract infection; AE: acute exacerbation. Data in bold indicated the analyses with statistical significance. (B) The transfer probability of non-URTI-AE and URTI-AE in the next AE during longitudinal follow-up. After excluding the samples without onset of AE within the 1-year follow-up, 73 samples were included in the Markov chain model for the transition probability analysis. (C) The probability of non-URTI-AE transferring to URTI-AE categorized by the BSI; (D) The probability of URTI-AE transferring to non-URTI-AE when categorized by the BSI. We calculated the frequency of each state transition as the probability required by the Markov chain model. Chi-square test was used to test the transition probability. Andersen Gill model was implemented by using the proc phreg package with the SAS program. BSI: Bronchiectasis Severity Index; URTI-AE: AE associated with URTI; Non-URTI-AE: AE not associated with URTI.
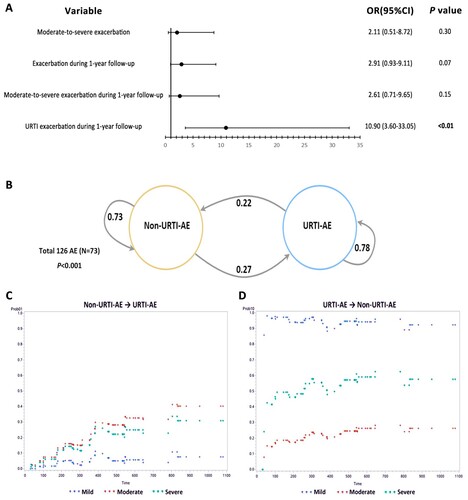
The Markov chain model suggested that patients with URTI-AE had a higher probability (0.78) to experience the next URTI-AE during follow-up, while patients with non-URTI-AE had lower probability (0.27) to have URTI-AE during follow-up. These findings were not influenced by the severity of bronchiectasis ((B,C)). Despite the lack of significant difference in the time to the first AE, URTI-AE was associated with a significantly earlier time to the next URTI-AE than non-URTI-AE within 1 year of follow-up (median time: 6.5 months for URTI-AE, not estimated due to the low number of AE in non-URTI-AE; hazards ratio: 4.95, 95%CI: 2.76–8.88; P < 0.001).
Samples from patients who had experienced an URTI but no onset of AE (URTI-non-AE) were associated with a different viral and bacterial spectrum compared with URTI-AE. See details in the Online Supplement.
Discussion
In this prospective cohort study, viral detection with or without bacteria isolation was strongly associated with URTI-AE. Patients with URTI-AE had higher viral loads, greater symptom burden and prolonged recovery than those without. Furthermore, URTI-AE markedly increased the risk of recurrent AE (especially URTI-AEs), suggesting that URTI was an important risk factor for, and influenced the course and trajectory of, AE in bronchiectasis.
In light of the confounding by the existing upper airway diseases (e.g. allergic rhinitis), we have defined URTIs by harmonizing the definition from previous studies [Citation8–10,Citation27]. The viral detection rate was markedly higher in URTI-AE (46.1%) than in non-URTI-AE (only 4.9%). We have previously demonstrated that viral detection (with or without bacterial shifting) has been associated with AE onset in adults with bronchiectasis, characterized by the more prominent upper airway symptoms [Citation16]. However, the prediction of viral detection at AE cannot be made solely according to the propensity of upper airway symptom at AE onset (the first date of visit). Although the rate of bacterial shifting did not differ considerably between URTI-AE and non-URTI-AE, bacterial shifting was more characteristic in bronchiectasis patients with AE onset [Citation16]. The rate of bacterial shifting in URTI-AE was significantly higher than in URTI-non-AE among bronchiectasis patients. Meanwhile, both the viral detection rate and viral loads were significantly lower in URTI-non-AE than in URTI-AE. Therefore, URTI with viral detection might be associated with secondary bacterial infections and heightened inflammatory responses, both of which correlated with AE onset in bronchiectasis. Similarly, another study has shown that COPD patients commonly developed secondary bacterial infections following viral infection [Citation28].
Consistent with published findings, we found that rhinovirus, influenza virus, and coronavirus were three cardinal viruses detected at AE onset [Citation18,Citation29], especially in those with URTI-AE but non-URTI-AE. Our findings indicated that viral spectrum in AE was mainly associated with URTI. First, rhinovirus detection has been recognized to be associated with AE in bronchiectasis [Citation16] in the previous study and rhinovirus load was higher in URTI-AE than in non-URTI-AE from our study, which could help partially explain for the high detection rate of viruses in URTI-AE. Second, apart from the common viruses (e.g. rhinovirus, influenza virus), metapneumovirus was almost exclusively in URTI-AE (unaffected by the timing of URTI, with higher load than non-URTI-AE), whose detection rate was relatively high in patients with bronchiectasis and other chronic respiratory diseases. The detection rate of metapneumovirus was reportedly ∼2.5% in AE among children with bronchiectasis [Citation30] and 1.0-6.1% at AE of adults with bronchiectasis [Citation16,Citation18,Citation31]. In another longitudinal study [Citation4], metapneumovirus accounted for 25% of the viruses detected when remaining clinically stable, and increased to ∼40% at AE and returned to baseline levels at convalescence. Besides, metapneumovirus was common in URTIs and lower respiratory tract infections, which has been associated with an onset of AE in COPD and asthma [Citation32,Citation33]. Third, HSV was detected in only 2.4% of bronchiectasis patients regardless of clinical status (stable state vs. AE) [Citation16] in a previous study (N = 76). However, the detection rate of HSV was 6.7% at AE onset in bronchiectasis (almost exclusively in URTI-AE, with an higher load than in non-URTI-AE) in our study. HSV has been more commonly detected in critically ill patients (22%) [Citation34] and patients with severe COPD at an onset of AE (19%) [Citation35]. COPD patients with HSV detected had a greater severity of AE and higher risk of death than those without [Citation35–37]. Some viruses (such as metapneumovirus and HSV) might be neglected but common triggers of AE in bronchiectasis, although our study design cannot ascertain whether the higher detection rate of them reflected reactivation only.
We have identified differences in viral spectrum between EURTI-AE (dominated by rhinovirus) and LURTI-AE (dominated by influenza virus). In the general population, symptom deterioration culminated at 2 days and recovered within one week for rhinovirus-associated URTI [Citation38]; but for influenza virus-related URTI symptom deterioration typically culminated at 2–3 days and recovered at 7–14 days [Citation39]. Therefore, more attention should be paid to the timing of URTI to predict the trajectory of AE.
Elevated systemic IFI27 levels have been demonstrated upon viral infection [Citation40]. Although similar expression patterns existed between URTI-AE and non-URTI-AE, IFI27 expression level was higher in sputum from patients with the detection of either metapneumovirus, HSV or parainfluenza at any AE onset compared to those without in our study. This has lent further support to the fact that URTI was associated with viral detection and the heightened host responses in adults with bronchiectasis.
An important finding of our study was that URTI-AE indicated poorer clinical outcomes. Despite the notable differences between different symptomatic assessment tools, URTI-AE was consistently associated with greater symptom burdens and yielded delayed recovery compared with non-URTI-AE. Our study has extended the previous findings of other chronic respiratory diseases. In COPD, patients with URTI-AE had more notable symptom deterioration and prolonged convalescence compared to those with non-URTI-AE [Citation8]. Distinguishing URTI-AE from non-URTI-AE might help clinicians to identify patients with greater symptom burden earlier and escalate the therapeutic interventions. The propensity of the benefit of URTI treatment on AE recovery needs to be further explored.
Patients with URTI-AE had a higher future risk of AE (especially URTI-AE) compared to non-URTI-AE, hinting on the longer-term consequences of URTI on AE in bronchiectasis. Similar findings have been reported – in patients with COPD, URTI markedly increased the future risks of AE [Citation9]. Interestingly, frequent exacerbators with COPD also had a higher incidence of URTI during longitudinal follow-up [Citation8]. In asthma, higher risk of URTI might be partly interpreted by the long-term use of inhaled corticosteroids [Citation15]. Identifying a potential phenotype of AE, a subgroup with frequent URTI, and analysing its risk factor might help to clarify the impact of viral infection on AE.
Early identification and intervention of URTI may help to minimize the risk of AE. Our findings justified a more proactive prevention of URTI in bronchiectasis through implementing vaccinations, administering oral immune boosters, and strengthening personal hygiene practices (maintaining social distance, wearing face mask and practicing hand hygiene [Citation38,Citation41]). The different viruses detected at EURTI-AE and LURTI-AE warranted precision diagnosis and management.
Notably, the single-centre study design as constrained the generalizability of our findings. Despite no demographic differences between the overall cohort and AE cohort, the small sizes of AE samples were a major limitation, although this was particularly challenging during COVID-19 outbreaks. Second, spontaneous sputum was the only sample source and nasal swabbing should have been incorporated into the assessment of the viral spectrum, although the consistency between upper airways and lower airways has been demonstrated in a previously published study with a relatively smaller sample size [Citation18]. Third, we have mostly included patients with mild AE not needing hospitalization. Caution should be exercised to extrapolate findings to dry bronchiectasis or more severe AE. Finally, our study design took place prior to symptom questionnaire validation, therefore some missing data cannot be avoided and we have simultaneously evaluated the symptom burden with three existing questionnaires, thus safeguarding the validity of our observations.
In patients with bronchiectasis, URTI is associated with a characteristic pathogen spectrum at AE onset, confers greater symptom burdens and prolongs recovery, and significantly increases future risks of URTI-AE. These findings justify the prevention and intervention of URTI to minimize its adverse impact on the progression of bronchiectasis.
Supplemental Material
Download Zip (4.8 MB)Acknowledgment
W. J. G. and N. S. Z. were the guarantors of the study. Y. H., L. J. C. and W. J. G. drafted the manuscript; Y. H., W. J. G. and N. S. Z. contributed to conception and design; Y. H., C. L. C., L. J. C., H. M. L., R. L. Z., C. X. P., X. X. Z., Z. F. H. and X. F. Z. were responsible for patient recruitment; Y. H., C. L. C., L. J. C., Z. H. L., M. X. S. and X. F. Z. collected individual data; Y. H.,S. Y. Z. and C. Y. D. performed statistical analyses; W. J. G. and N. S. Z. provided critical review of the manuscript and approved the final submission.
Disclosure statement
No potential conflict of interest was reported by the author(s).
Additional information
Funding
References
- Chang AB, Fortescue R, Grimwood K, et al. European respiratory society guidelines for the management of children and adolescents with bronchiectasis. Eur Respir J. 2021;58(2):2002990.
- Kapur N, Masters IB, Chang AB. Exacerbations in noncystic fibrosis bronchiectasis: clinical features and investigations. Respir Med. 2009;103(11):1681–1687.
- Chalmers JD, Aliberti S, Filonenko A, et al. Characterization of the “frequent exacerbator phenotype” in bronchiectasis. Am J Respir Crit Care Med. 2018;197(11):1410–1420.
- Mac Aogain M, Narayana JK, Tiew PY, et al. Integrative microbiomics in bronchiectasis exacerbations. Nat Med. 2021;27(4):688–699.
- Dicker AJ, Lonergan M, Keir HR, et al. The sputum microbiome and clinical outcomes in patients with bronchiectasis: a prospective observational study. Lancet Respir Med. 2021;9(8):885–896.
- Guan WJ, Gao YH, Xu G, et al. Sputum bacteriology in steady-state bronchiectasis in Guangzhou, China. Int J Tuberc Lung Dis. 2015;19(5):610–619.
- Martinez-García MA. Pseudomonas aeruginosa infection and exacerbations in bronchiectasis: more questions than answers. Eur Respir J. 2018;51(2):1702497.
- Hurst JR, Donaldson GC, Wilkinson TM, et al. Epidemiological relationships between the common cold and exacerbation frequency in COPD. Eur Respir J. 2005;26(5):846–852.
- Johnston NW, Olsson M, Edsbacker S, et al. Colds as predictors of the onset and severity of COPD exacerbations. Int J Chron Obstruct Pulmon Dis. 2017;12:839–848.
- Heikkinen T, Järvinen A. The common cold. Lancet. 2003;361(9351):51–59.
- Arroll B. Common cold. BMJ Clin Evid. 2011;2011:1510.
- Wiselka MJ, Kent J, Cookson JB, et al. Impact of respiratory virus infection in patients with chronic chest disease. Epidemiol Infect. 1993;111(2):337–346.
- Jackson DJ, Gern JE. Rhinovirus infections and their roles in asthma: etiology and exacerbations. J Allergy Clin Immunol Pract. 2022;10(3):673–681.
- Ortega H, Nickle D, Carter L. Rhinovirus and asthma: challenges and opportunities. Rev Med Virol. 2021;31(4):e2193.
- Yang M, Zhang Y, Chen H, et al. Inhaled corticosteroids and risk of upper respiratory tract infection in patients with asthma: a meta-analysis. Infection. 2019;47(3):377–385.
- Chen CL, Huang Y, Yuan JJ, et al. The roles of bacteria and viruses in bronchiectasis exacerbation: A prospective study. Arch Bronconeumol. 2020;56(10):621–629.
- Reiff DB, Wells AU, Carr DH, et al. CT findings in bronchiectasis: limited value in distinguishing between idiopathic and specific types. AJR Am J Roentgenol. 1995;165(2):261–267.
- Gao YH, Guan WJ, Xu G, et al. The role of viral infection in pulmonary exacerbations of bronchiectasis in adults: a prospective study. Chest. 2015;147(6):1635–1643.
- Hill AT, Haworth CS, Aliberti S, et al. Pulmonary exacerbation in adults with bronchiectasis: a consensus definition for clinical research. Eur Respir J. 2017;49(6):1700051.
- Chalmers JD, Haworth CS, Metersky ML, et al. Phase 2 trial of the DPP-1 inhibitor brensocatib in bronchiectasis. N Engl J Med. 2020;383(22):2127–2137.
- Dransfield MT, Voelker H, Bhatt SP, et al. Metoprolol for the prevention of acute exacerbations of COPD. N Engl J Med. 2019;381(24):2304–2314.
- Stolz D, Papakonstantinou E, Grize L, et al. Time-course of upper respiratory tract viral infection and COPD exacerbation. Eur Respir J. 2019;54(4):1900407.
- Artaraz A, Crichton ML, Finch S, et al. Development and initial validation of the bronchiectasis exacerbation and symptom tool (BEST). Respir Res. 2020;21(1):18.
- Finch S, Laska IF, Abo-Leyah H, et al. Validation of the COPD assessment test (CAT) as an outcome measure in bronchiectasis. Chest. 2020;157(4):815–823.
- Leidy NK, Murray LT, Monz BU, et al. Measuring respiratory symptoms of COPD: performance of the EXACT-respiratory symptoms tool (E-RS) in three clinical trials. Respir Res. 2014;15(1):124.
- Murray PR, Washington JA. Microscopic and baceriologic analysis of expectorated sputum. Mayo Clin Proc. 1975;50(6):339–344.
- Kardos P, Malek FA. Common cold – an umbrella term for acute infections of nose, throat, larynx and bronchi. Pneumologie. 2017;71(4):221–226.
- Molyneaux PL, Mallia P, Cox MJ, et al. Outgrowth of the bacterial airway microbiome after rhinovirus exacerbation of chronic obstructive pulmonary disease. Am J Respir Crit Care Med. 2013;188(10):1224–1231.
- Gao YH, Guan WJ, Zhu YN, et al. Respiratory pathogen spectrum in pulmonary exacerbation of bronchiectasis in adults and its association with disease severity. Zhonghua Jie He He Hu Xi Za Zhi. 2019;42(4):254–261.
- Kapur N, Mackay IM, Sloots TP, et al. Respiratory viruses in exacerbations of non-cystic fibrosis bronchiectasis in children. Arch Dis Child. 2014;99(8):749–753.
- Park YE, Sung H, Oh YM. Respiratory viruses in acute exacerbations of bronchiectasis. J Korean Med Sci. 2021;36(34):e217.
- Coverstone AM, Wilson B, Burgdorf D, et al. Recurrent wheezing in children following human metapneumovirus infection. J Allergy Clin Immunol. 2018;142(1):297–301.e2.
- Rohde G, Borg I, Arinir U, et al. Relevance of human metapneumovirus in exacerbations of COPD. Respir Res. 2005;6(1):150.
- Daubin C, Parienti JJ, Vincent S, et al. Epidemiology and clinical outcome of virus-positive respiratory samples in ventilated patients: a prospective cohort study. Crit Care. 2006;10(5):R142.
- McManus T, Marley A, Baxter N, et al. Herpes simplex virus and mortality in COPD. Am J Respir Crit Care Med. 2009;179:A5348.
- Bruynseels P, Jorens PG, Demey HE, et al. Herpes simplex virus in the respiratory tract of critical care patients: a prospective study. Lancet. 2003;362(9395):1536–1541.
- Luyt CE, Combes A, Deback C, et al. Herpes simplex virus lung infection in patients undergoing prolonged mechanical ventilation. Am J Respir Crit Care Med. 2007;175(9):935–942.
- Jacobs SE, Lamson DM, St George K, et al. Human rhinoviruses. Clin Microbiol Rev. 2013;26(1):135–162.
- Hutchinson EC. Influenza virus. Trends Microbiol. 2018;26(9):809–810.
- Tang BM, Shojaei M, Parnell GP, et al. A novel immune biomarker IFI27 discriminates between influenza and bacteria in patients with suspected respiratory infection. Eur Respir J. 2017;49(6):1602098.
- Turner RB, Fuls JL, Rodgers ND, et al. A randomized trial of the efficacy of hand disinfection for prevention of rhinovirus infection. Clin Infect Dis. 2012;54(10):1422–1426.