
 ?Mathematical formulae have been encoded as MathML and are displayed in this HTML version using MathJax in order to improve their display. Uncheck the box to turn MathJax off. This feature requires Javascript. Click on a formula to zoom.
Abstract
Dairy cooperative societies have a viable contribution to the reduction of poverty and improve incomes of the smallholder farmers in developing countries. Farmers in these countries are encouraged to join cooperatives to work cooperatively. However, in Ethiopia in general and in the study area in particular smallholder farmers’ cooperative membership is very low, and farmers are still hesitating to be members of dairy cooperatives. Thus, this study was planned to investigate the determinants of dairy cooperative membership among smallholder farmers. Sample diary cooperatives were selected through a simple random sampling method. For this study, cross-sectional data were collected from 266 dairy farmers through interview schedules. Determinates of dairy cooperative membership were analyzed using the binary probit model. The model result shows that dairy farming experience, family size, livestock holding, participation in training, access to market information, number of crossbreed cow ownership, and neighbors’ membership are found positively and significantly associated with dairy cooperative membership decisions. Conversely, landholding size and distance from residence to the dairy cooperative are negatively and significantly associated with dairy cooperative membership decisions. This indicates that farmers having large landholdings and far away from the dairy cooperatives are less benefited from the dairy cooperative society. The study identified that enhancing asset ownership, providing sufficient and frequent market information, providing training about dairy production, and establishing milk collection centers can improve dairy cooperative membership of farmers.
PUBLIC INTEREST STATEMENT
Ethiopia is among the leading in terms of the number of livestock held in Africa. The country is suitable for dairy production, but the production system is not market-oriented. Most of the smallholder dairy farmers in the country are producing in the traditional way of production and face several problems. In addition, the perishable nature of milk and the smallholder production system means that there is a need for strong collective action. However, farmers are not well organized; the number of dairy cooperatives’ and farmers’ membership in these cooperatives is very low. Thus, organizing smallholder farmers into dairy cooperatives improves the benefit of smallholder farmers from the dairy sector. Since, dairy cooperatives profited smallholder farmers by reducing transaction costs, improving bargaining power, connecting buyers and sellers, supplying the required production farm inputs, and providing credit services. Thus, this study tried to identify the determinants of dairy cooperative membership.
1. Introduction
Agriculture is the most important economic sector in Ethiopia, which provides cash income, employment opportunities, and foreign exchange. It contributes 34.1% to the Gross Domestic Product (GDP), creates employment for about 79% of the population, and generates 79% of foreign earnings (Ministry of Agriculture MOA, Citation2019). It is also the source of most raw materials for Ethiopian agro-industries. It is dominated by crop production which accounts for about 71.2% of the agricultural GDP; on the other hand, livestock production accounts for 20.5% of the agricultural GDP and the remaining 8.3% is contributed by forestry and fishery sectors (Ethiopia National Plan Commission (ENPC), Citation2016).
In Ethiopia, the livestock sector, mainly dairy and dairy products, makes a massive contribution to smallholders as income generation and employment creation (Mihret et al., Citation2017). About 16% of the country’s export earning is generated from this sector (Getabalew et al., Citation2019). The country holds huge potential for dairy development due to its large livestock population, which comprises 63.2 million cattle, 1.2 million camels, 34 million goats, and 31.8 million sheep (Food and Agriculture Organization FAO, Citation2019). However, dairy production in the country is influenced by shortages and fluctuations in the quality and quantity of feed, poor and eroding genetic resource bases, lack of proper management, diseases, lack of adequate market infrastructure, poor service delivery and policy, and institutional problems (Tefera & Gebre, Citation2015). Mojo et al. (Citation2017) also discovered that smallholder dairy farmers in developing countries, such as Ethiopia, face numerous constraints, from production to marketing. Therefore, cooperatives play an important role in overcoming these constraints.
According to Yadav (Citation2018), cooperatives are established to improve the livelihood of the poor section of the community by enhancing economic well-being, providing credit service with fair interest rates, enhancing the saving habit and reducing expenditure, helping to reduce unemployment, and improving the cooperation among farmers. The study by Abate et al. (Citation2014) in Ethiopia describes the effectiveness of cooperatives in improving the technical efficiency of farmers. Through bringing buyers and sellers together, dairy cooperatives can improve bargaining power and reduce transaction costs and price risks of producers (Chagwiza et al., Citation2016). It fosters the skills of producers by providing appropriate information, creating awareness, and increasing innovation capability and adaptation strategies to changing market conditions (FAO, Citation2012). Moreover, it can serve as an instrument for disseminating dairy technologies (Bernard & Spielman, Citation2009), play an important role in coordinating the flow of milk from their members to the dairy industry, and provide the required dairy farm inputs from the industry to farmers (Misganaw et al., Citation2017). Additionally, it reduces production challenges by providing credit services to member farmers (Tefera et al., Citation2016).
In Ethiopia cooperation has a long history in the form of cultural and traditional associations (such as iqub, wonfel, debo, and idir) which provides economic, social, and religious service for the society (Abebaw & Haile, Citation2013); helps the community by improving social cohesion, bargaining power and support among the people (Bernard et al., Citation2010). However, the first formal cooperative organizations were established in the 1950s (Kodama, Citation2007). But, at that time, members of cooperatives were only large landholders, while smallholder farmers were excluded. However, after the downfall of the Derg regime, the government has stressed the prominence of cooperatives as vehicles for successful economic development and alleviating poverty among resource-poor farmers (Getnet & Anullo, Citation2012). In 2002, the Federal Cooperative Agency (FCA) was established by the government with a mandate of supervising the implementation of cooperative legislation, designing policies and legal procedures, and ensuring the coherence of cooperative policy with other sectors (labor and employment, land, customs, taxation, and financial regulations). Moreover, the agency guides and supports cooperative promotion activities all over the country, working through the regional state Bureau of Cooperative Promotion (Federal Democratic Republic of Ethiopia FDRE, Citation2002).
Despite numerous potential advantages and efforts that have been done, yet, cooperatives in the country are susceptible to several problems; for instance, freeriding, corruption, principal–agent problems, and different types of mismatches between individual and collective interests (Ortmann & King, Citation2007). In addition, poor leadership, dependence on supporting organizations, shortage of money, and low farmers’ participation in cooperatives are the major prevailing problems in the development of cooperatives (Borda‐Rodriguez et al., Citation2016). In this regard, Smallholder farmers’ cooperative membership in the country is generally very low (9%), but about 40% of the rural households have access to cooperatives in their local kebele (Dejen & Matthews, Citation2016). Similarly, Mojo et al. (Citation2015) also reported low participation of members in cooperatives.
Based on the report of the FCA, (Citation2016) cited by Daniel (Citation2018), there are only 504 dairy cooperatives involved in milk production and marketing activities in diverse parts of the country. In the Amhara region, based on the annual report of the Amhara Region Cooperative Agency (2019), there are 3,145 active agricultural cooperatives with 3,088,509 members, of which only 126 are dairy cooperatives. Thus, charming more cooperatives into the dairy sector to improve dairying in the country and increasing the success of existing dairy cooperatives through helping, promoting, and resolving their production and marketing limitation is essential. To do so, assessing the factors determining dairy cooperative membership is of paramount importance. Therefore, this study was done to identify the factors determining dairy cooperative membership in northwestern Ethiopia.
2. Methodology
2.1. Description of the study area
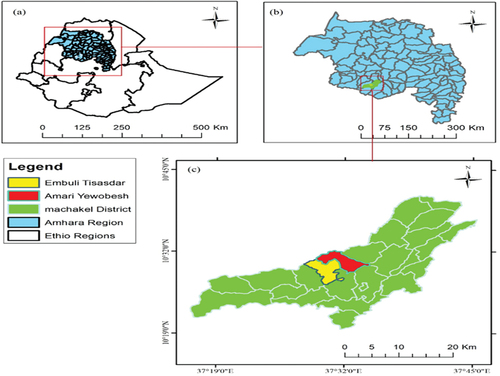
The study was done in Machakel district (Amhara Region), which is one of the main dairy-producing areas in the region. The district is located at 10° 19ˈ 75ˈˈ to 10° 41ˈ 00ˈˈ N latitude and 37° 16ˈ 46ˈˈ to 37° 45ˈ 42ˈˈ E longitude. It is 330 km from the northwestern part of Addis Ababa and 237 km from the southern part of Bahir Dar, the capital city of the Amhara Region. The Machakel district is divided into 25 rural and 2 urban Kebeles-centered Amanuel as an administrative town. The district has a total area of 79,556 ha with an elevation range between 1200 and 3200 (meters above sea level (m. a. s. l.) and the district has an estimated population of 145,219 (MWADO, Citation2020). Agriculture was the mainstay of the district. The agroecology of the district is appropriate for diverse agricultural productions.
Mixed farming system (crop and livestock) production is the major source of income and livelihood for people in the district. Wheat, maize, teff, and barley are the major crops cultivated in the area. Livestock rearing is also an integral part of their production system. Cattle, sheep, goat, horse, donkey, mule, poultry, and honey bee (apiculture) productions are a very common practice in the area. However, there is little market-oriented production system. According to the annual report of the Animal Production and Fishery Development Office of the district, there are 35,022 dairy cows. Of these, 1591 were crossbred cows and 33,431 were local breads. In recent times, there has been a fast-growing smallholder dairy production system with great emphasis on milk production and marketing cooperatives, and very few privately owned dairy farms. The district is highly suitable for animal production, particularly for the dairy sector. However, farmers have not benefited from the sector as its potential, and their production system in the area is not well connected with the market. To overcome such constraints, farmers should be organized through dairy cooperatives. However, the number of dairy cooperatives as well as farmers’ membership in these few dairy cooperatives is a problem in the district and that is why this study was conducted in the area.
In the study area, there are five dairy production and marketing cooperatives. These cooperatives provide different services to member farmers like buying and selling milk and milk products, breeding, improved feed, training on dairy production and the importance of cooperatives, and dividends. However, these services are not limited to only member farmers. For example, non-members can sell their milk to the dairy cooperative, and they can buy improved feeds from the cooperative, but the selling and buying prices of these goods are not similar with member farmers. Figure depicts the map of the study area.
Figure 1. Location map of the study area.
2.2. Sampling design and sample sources
The study was conducted based on cross-sectional data collected from 266 dairy farmers under two dairy productions and marketing cooperatives in Machakel district from January 2021 to March 2021. For this study, the sample households were selected from member and non-member dairy farmers using a multistage sampling technique. In the first stage, Embuli and Yewobesh dairy production and marketing cooperatives were selected randomly from among the five dairy production and marketing cooperatives in the district. Second stage, stratified sampling was used since the population is heterogeneous concerning dairy cooperative membership. Dairy farmers in the kebele (where dairy cooperatives are found) were categorized into two strata: cooperative member dairy farmers and non-member dairy farmers. Finally, 123 members and 143 non-members of 266 dairy farmers were selected randomly based on probability proportionate to size.
Primary and secondary data, which had both qualitative and quantitative characteristics, were collected from primary and secondary data sources. Primary data were collected from the sample households using interview schedules and key informant interviews with district cooperative office experts and dairy cooperative managers. Finally, the data were analyzed using STATA version 14.
2.3. Method of data analysis
2.3.1. Binary probit model
Econometric models are important for estimating the association between the dependent and explanatory variables. In this study, the dependent variable was a dummy variable (membership or non-membership in dairy cooperatives). In this situation, estimations using multiple linear regression models may lead to many problems. Hence, many alternative models that are compatible with binary dependent variables have been developed. Among these, the most widely used are the linear probability model (LPM), logit model, and probit model. However, LPM has many problems, such as (1) heteroskedasticity of the disturbance term, (2) lower R2 values, (3) non-normality of disturbance, and (4) the predicted value may be outside the 0 to 1 range. To avoid these defects, nonlinear probability models (logit and probit) are preferable to the LPM.
Nonlinear probability models allow for estimating the likelihood of being a member of dairy cooperatives given some relevant demographic, socio-economic, and institutional factors. To model dummy or binary outcome variables such as membership in dairy cooperatives, binary probit regression is applied. As stated by Long and Freese (Citation2006), regression models for dummy outcomes estimate the pattern of the effect of independent variable(s) on the probability of incidence of an event. To determine the drivers of dairy cooperative membership, a binary probit regression was used (Long & Freese, Citation2006; Williams, Citation2018). It can include an error-term distribution and realistic probabilities (Nagler, Citation2002). For the time being, the probit model assumes one and zero values for dairy cooperative members and non-members, respectively, which are observed only for the response variable Y, and there is a latent, unobserved continuous variable Y* (critical or threshold value) that determines the value of the response variable Y (Sebopetji & Belete, Citation2009). Thus, following Gujarati, (1988), the decision of a farmer to join a dairy cooperative is specified as follows:
where Pi signifies the probability of the dummy-dependent variable of the individual household whether deciding or not to be a member of dairy cooperatives; Y* is the critical or threshold value of the endogenous variable; yi is the dependent variable (ability to join dairy cooperative or otherwise); Zi is the standard normal variable, i.e., Z N (0, σ2). βi is the coefficient of explanatory variables that need to be estimated, Xi represents explanatory variables that are expected to affect the dairy cooperative membership. F is the standard normal cumulative distribution function, further written as:
The inverse of the cumulative normal function is used to obtain an estimate of Yi:
In this study, the marginal effect is used to interpret the association between a specific explanatory variable and the outcome of the dependent variable. The marginal effect associated with the independent variables X on probability P (Yi = 1/X), holding other variables constant, can be computed as:
According to Buis (Citation2010), this can be interpreted as the extent to which the likelihood of a change in the dependent variable is expected to increase or decrease for a unit change in independent variable.
2.3.2. Variable definition and working hypotheses
2.3.2.1. Dependent variable
Farmer dairy cooperative membership is a dummy-dependent variable in the model, taking a value of 1 if a farmer is a member of the dairy cooperatives and 0 otherwise.
2.3.2.2. Explanatory variables
Dairy Cooperative membership was assumed to be affected by different characteristics related to farmer’s demographic, social, economic, and institutional characteristics. The following variables were defined and hypothesized based on the preliminary information and reviews. The defination of variables and their working hypothesis including the expected relationship between dairy cooperative mebership and the independent variables are presented in Table .
Table 1. Summary of explanatory variables for econometric analysis
3. Results and discussions
3.1. Descriptive statistics of household characteristics
Data on demographic, socioeconomic, and institutional variables collected through interview schedules from smallholder farmers (member and non-member), summary statistics, and statistical tests of these continuous and dummy variables are presented in Tables . To test the significance of continuous and dummy variables among members and non-members, a t-test and X2 (chi-square) test were employed, respectively. Dairy cooperative members are more aged and have more dairy farming experience than non-members. In addition, members are also more educated and have more labor force, livestock, and crossbreed cow ownership and extension contact than non-members. Conversely, members had less landholding size and distance from home to the dairy cooperative than the non-members.
Table 2. Descriptive statistics of sample farmers for continuous variables
Table 3. Descriptive statistics of sample respondents for dummy variables
3.1.1. Age of the household head
The average age of the sample households was found to be 45.48 years, with a standard deviation of 9.53 years with a minimum and maximum age of 24 and 75 years, respectively. This implies that the majority of the sample respondents are in the productive age group. The result also showed that the average age of members is 47.39 with a standard deviation of 9.55, while the age of non-members was 43.85 with a standard deviation of 9.23. As shown in Table , the t-test indicated a significant mean difference was found between members and non-members of dairy cooperatives concerning the age of the sample respondents.
3.1.2. Household head years of education
The educational level of the household head influences farmers’ choice to be a member of dairy cooperatives by enhancing farmers’ ability and understanding of the cooperatives. The average educational status of member household heads was grade 3.38 with a standard deviation of 3.34, and non-members were grade 2.22 with a standard deviation of 3.02. This indicates that members were more educated than non-member dairy farmers. The t-test result showed that there was a significant mean difference among members and non-members in terms of the educational status of household heads (Table ).
3.1.3. Family size
According to Chagwiza et al. (Citation2016) family size has an important implication for a household’s dairy cooperative membership decision. The family size of the sample respondents in terms of man equivalent ranged between 0.8 and 8.8. The mean family size of sample respondents in terms of man equivalent was found to be 3.06 with a standard deviation of 1.21. For the members of the dairy cooperative, the mean family size in man equivalent was found 3.20 with a standard deviation of 1.33 while for the non-members it was found to be 2.94 with a standard deviation of 1.08. As indicated in Table , a significant mean difference was found between member and non-member smallholder farmers concerning family size.
3.1.4. Dairy farm experience
The mean dairy farming experience of member household heads was 18.70 years but it was 12.07 years for the non-member household heads with a standard deviation of 9.34 and 9.51, respectively. As indicated in Table , a significant mean difference was found between dairy cooperative members and non-member smallholder farmers concerning the dairy farming experience of household heads.
3.1.5. Landholding size
Land is a blood vessel for farm households, and the key productive asset and rural community life is highly correlated to it. The mean landholding size of sample respondents was 1.62 ha with a standard deviation of 0.92. It also indicated that dairy farmers have owned a minimum and maximum of 0 and 4.13 ha of land, respectively. The mean landholding size of members was 1.61 ha with a standard deviation of 0.94, while the non-members owned 1.64 ha with a standard deviation of 0.91. It indicates that the mean landholding size of members was less than that of the non-members. However, the mean difference between members and non-members was not statistically significant in terms of landholding size (Table ).
3.1.6. Livestock holding
A mixed farming system is practiced in the study area; they cultivate crops and raise animals for their livelihood. Livestock rearing plays a significant role for households in the area. It provides milk and milk products, meat, eggs, drafting power, and transportation. Moreover, livestock production for dairy purposes is highly practiced in the study area. In the calculation of TLU, oxen, cows, bulls, heifer, calves, donkeys, horses, mule, sheep, goats, and poultry were included based on their conversion factors. The study indicated that sample households had a minimum of 1.25 and a maximum of 15.87 TLU. On average, member and non-member sample respondents owned 8.00 TLU and 6.39 TLU, respectively. However, the overall average livestock holding for the sample farmers was 7.13 TLU (Table ). This implies that members had higher livestock holding and were in a better position than non-members including dairy cows. Based on the t-test result, a statistically significant mean difference was found between the two groups for livestock holding.
3.1.7. Crossbreed cow owned
The average number of crossbreed cows owned was 1.37 with a standard deviation of 1.00 for members of the dairy cooperative and 0.36 with a standard deviation of 0.52 for the non-members. The overall average number of crossbreed cows owned by sample respondents was 0.83. The result shows that members of the cooperatives owned more crossbreed cows than non-members. As shown in Table the mean difference test between members and non-members was statistically significant concerning the number of crossbreed cow ownership.
3.1.8. Extension contacts
Institutional support services are the basic factors for farmers' dairy cooperative membership through linking farmers with different governmental and non-governmental institutions. In this case, among other factors extension contact of farmers with development agents plays an important role for dairy cooperative membership through improving the awareness level and technical knowledge of farming activities. The survey result revealed that on average, the sample household’s contact with development agents was 3.73 times per annum with a minimum visit of 0 and a maximum visit of 0 24 times, respectively. The average number of extension contacts per year for member farmers of dairy cooperatives was 5.12 days. Meanwhile, for the non-members of the dairy cooperative, the average number of extension contacts was 2.52 days per year. The mean difference test between members and non-members was statistically significant concerning the frequency of extension contact (Table ).
3.1.9. Distance from respondent’s home to the market
Market distance is another influencing variable for dairy cooperative membership, because the market is an important factor for selling dairy products, buying dairy production inputs, and also used for social interaction and exchange of different ideas and goods. In this regard, the result indicated that the mean distance of the respondent’s home from the market took 116.91 min for members and 106.12 min for non-members with a standard deviation of 29.39 and 16.98 min, respectively. The overall mean for sample farmers showed the walking distance from respondents’ homes to the nearest market was found 111.11 min with a standard deviation of 24.11 min. As shown in Table , significant mean difference was found among the two groups concerning distance from home to the market.
3.1.10. Distance from home to the dairy cooperative
Distance to the milk cooperative is also another important influencing factor for dairy cooperative membership. Dairy Cooperative is the main market outlet of dairy products for dairy farmers and also supplies different services such as improved feeds, breading services, training and other dairy-related services. The mean distance from the respondents’ home to the milk cooperative was found at 38.32 walking minutes. The result also indicated that the average distance of the respondent’s home from the dairy cooperative took 26.21 min for members and 48.74 min for non-members with a standard deviation of 19.13 and 20.64 min, respectively. A statistically significant mean difference was found among members and non-members concerning distance from home to the dairy cooperative (Table ).
3.1.11. Sex
Among the total 266 respondent farmers 245 (92.11%) were male-headed, and the remaining were female-headed farmers. The surveyed result showed that from male-headed households 116 (47.35%) and 129 (52.65%) were members and non-members of dairy cooperatives, respectively. While from female-headed households, 7 (33.33%) and 14 (66.67%) were members and non-members of dairy cooperatives, respectively. The chi-square test indicated that there was no significant difference in the sex of respondent farmers between dairy cooperative members and non-members (Table ).
3.1.12. Social responsibility
The result of the study depicted that out of the total sample households, 96 (36.09%) had social responsibility in their community, while 170 (63.91%) did not have any social responsibility in their community. From households having social responsibility in the community, 53.13% and 46.87% were members and non-members of dairy cooperatives, respectively. From households that did not have any social responsibility, 42.35% and 57.65% were members and non-members of dairy cooperatives, respectively. These social responsibilities in which household heads are involved are community leaders, religious leaders, local institution leaders, elders, etc. The participation of farmers in these social responsibilities can increase easy access to information about the benefits and importance of cooperatives. The test statistics indicated that there was a significant difference among members and non-members of dairy cooperatives concerning social responsibility (Table ).
3.1.13. Access to credit
Among the total sample respondents 64 (24.06%) received credit, while the remaining 202 (75.94%) did not receive credit service (Table ). It also indicated that from credit user households 34 (53.12%) and 30 (46.88%) were members and non-members of dairy cooperatives, respectively. From credit non-user households, 89 (46.16%) and 113 (55.94%) were members and non-members of dairy cooperatives, respectively. This result indicated that most of the sample respondents did not receive credit services because of collateral problems, high interest rates and some due to not needing credit at all. The former Amhara Credit and Saving Institution (ACSI) and the current Tsedey Bank are the main source of credit in the study area. The result revealed that no significant difference between members and non-members of dairy cooperatives to credit service.
3.1.14. Off/non-farm participation
Off/non-farm participation is an important factor for households to fulfill financial constraints through diversifying their source of income. Out of the total sample households, 157 (59.02%) were involved in off/non-farm activities, while the rest 109 (40.98%) were not participated in off/non-farm activities. From off/non-farm activity participants, 73 (46.5%) and 84 (53.5%) were members and non-members of dairy cooperatives, respectively. On the other hand, from non-participants, 50 (45.87%) and 59 (54.13%) were members and non-members of dairy cooperatives, respectively. As shown in Table , a significant difference was not found between the two groups in terms of off/non-farm participation.
3.1.15. Training participation
The survey result indicated that among the sample households, 137 (51.5%) participated in training related to dairy production, while the remaining 129 (48.5%) did not participate in any training on dairy production. The result also showed that, from training participated households, 106 (77.37%) were members and 31 (22.63%) were non-members of dairy cooperatives. From the training of non-participant households, 17 (13.18%) and 112 (86.92%) were members and non-members of dairy cooperatives, respectively. The result indicated that a significant difference was found among members and non-members of dairy cooperatives in terms of training participation of households (Table ).
3.1.16. Market information access
In this study, market information was captured through milk market information access; it helps farmers to improve their know-how about the marketing condition of their milk and facilitate dairy cooperative membership decisions. The result indicated, out of the sample households, 161 (60.35%) had access to market information, while the rest 105 (39.65%) did not have market information access. The results also showed that 115 (71.43%) and 46 (28.57%) households had access to market information and 8 (7.62%) and 97 (97%) households did not have market information access were members and non-members of dairy cooperatives, respectively. The test statistics indicated that a statistically significant difference was found among members and non-members of dairy cooperatives in terms of market information access (Table ).
3.1.17. Neighbors’ membership
Out of the total sample households 180 (67.67%) had neighbor dairy cooperative member farmers, while the remaining 86 (32.33%) did not have dairy cooperative member farmers. The results also indicated that from households having neighbor dairy cooperative members 103 (57.22%) and 77 (42.78%) and from households that did not have dairy cooperative member farmers 20 (23.26%) and 66 (76.74%) were members and non-members of dairy cooperatives, respectively. A statistically significant difference was found among the two groups with this variable.
3.2. Determinants of dairy cooperative membership
The binary probit model was employed to analyze determinant factors of dairy cooperative membership, and hence, it has binary outcomes (Table ). Before the estimation of the model, a diagnostic test of multicollinearity for continuous and categorical variables was conducted using the variance inflation factor and contingency coefficient, respectively. The result indicated that the mean value of VIF is 1.60, which is below the maximum value of 10. It indicates that multicollinearity is not a problem in the estimated model. A heteroskedasticity test (Breusch–Pagan test) was conducted, and the result depicts that there is no problem with heteroscedasticity. The normality of residuals was also tested by using the Shapiro–Wilk test. The dependent variable (dairy cooperative membership) in the probit model is coded as 1 if the head of the household is a member of a dairy cooperative and 0 otherwise. The result indicated that the model adequately fitted the data at a 1% level (LR ch2 (17) = 278.14; p = 0.000)
Table 4. Estimation results of probit model for dairy cooperative membership
The output of the probit membership equation revealed that out of 17 variables included in Model 9 was found significantly determined the probability of a dairy cooperative membership decision. The result explored that farming experience, family size (man equivalent), livestock holding (TLU), training access, access to market information, crossbreed cow ownership, and neighbor’s membership were found significantly and positively associated with dairy cooperative membership decisions. Conversely, the dairy cooperative membership decision was negatively and significantly associated with landholding size and distance from residence to the dairy cooperative.
Landholding size was found to significantly and negatively affect the probability of dairy cooperative membership decisions. It indicates that farmers with the smallest (poorest) landholders benefited from dairy cooperative membership. This might be because farmers with less land might be focused on dairy production and intensify dairy farming, which may improve the probability of dairy cooperative membership. The result is in agreement with (Chagwiza et al., Citation2016) who pointed out that the likelihood of cooperative membership and landholding size was negatively and significantly related in Ethiopia. Similarly, Petcho et al. (Citation2019) reported that landholding size and membership in rice cooperatives were negatively associated in Thailand. However, this contradicts the findings of (Abate et al., Citation2014; Ahmed & Mesfin, Citation2017; Mojo et al., Citation2017) who noted a positive and significant association between landholding size and membership in cooperatives. Moreover, this study is opposed to the finding of Abate et al. (Citation2014), who reported that cooperative members have bigger landholding size and less livestock ownership in Ethiopia; Bernard et al. (Citation2008), presented farmers’ participation in cooperatives as positive and significantly associated with landholding size and negatively associated with number of cattle owned in Ethiopia.
The dairy farm experience is expected to positively affect the probability of dairy cooperative membership. As expected, the variable was positive and statistically significant. This is because of the fact that farming experience helps farmers to accumulate and improve knowledge and skills related to dairy production and dairy cooperatives. It also enhances their production system and improves their understanding of dairy cooperatives, and in turn, facilitates dairy cooperative membership. Previous studies by Kumar et al. (Citation2018); Priscilla and Chauhan (Citation2019) in India and Petcho et al. (Citation2019) in Thailand reported similar findings.
As expected, the family size (in man equivalent) significantly determines the probability of cooperative membership. Household size (man equivalent) is a good indicator of the available labor force for dairy production. Dairy production and membership in dairy cooperatives require more labor for rearing and managing dairy cows and frequently supplying milk to dairy cooperatives. The result depicts that member farmers need to assign more labor to dairy production. The finding is in line with (Abate et al., Citation2014) who reported that farmers with large family sizes are more likely to be members of agricultural cooperatives. Similarly, Sikawa and Mugisha (Citation2013) also noted that the probability of becoming a member of cooperatives is high for households having more adults in their family. Njiru et al. (Citation2015) also support the finding that a higher number of people above the age of 18 positively related to the likelihood of dairy cooperative membership. However, the result is contradicted by the report of Kumar et al. (Citation2018) explored a negative significant association between cooperative membership and family size in India.
As hypothesized, the distance from residence to the dairy cooperative had a negative sign in the model, indicating a negative relationship. It is justified because when the cooperative office is near the household residence, the required cost of time and labor that the farmer spends to communicate with cooperative officers is reduced. The exposure of farmers located near the dairy cooperative can also improve their knowledge about the dairy cooperatives. Moreover, cooperatives can provide benefits to the nearby farmers like; market access by facilitating the easy sale of milk they produce in relatively large quantities and providing the necessary farm inputs at a reasonable price. The result is in agreement with those of Tefera and Gebre (Citation2015) and Chagwiza et al. (Citation2016).
Livestock holding (TLU) is expected to have a positive relationship with dairy cooperative membership. As expected, the executed result also indicated that livestock holdings and dairy cooperative membership had a positive significant relationship. Livestock is a proxy for farmers’ wealth status. Farmers with large livestock holdings have a good chance of earning more money to invest in buying dairy animals and production farm inputs. Consequently, milk production increases, and there is a need for a more consistent and stable market for improved milk production (Sulastri & Maharjan, Citation2002). The present finding is consistent with Njiru et al. (Citation2015) in Kenya, which indicated that herd size and dairy cooperative membership had a positive relationship.
Crossbreed cow ownership positively and significantly affects cooperative dairy membership. As farmers own productive dairy cows, their likelihood of being members of the dairy cooperative increases. This is because farmers having more high-yielding crossbreed dairy cows can produce and supply a sufficient quantity of milk to the cooperative. Thus, farmers tend to be members of dairy cooperatives to obtain sustainable market outlets for their products. The finding is in agreement with Bayan (Citation2018); Priscilla and Chauhan (Citation2019) both noted that crossbreed cow ownership and dairy cooperative membership are positively and significantly associated in India.
Access to market information was expected to affect the likelihood of dairy cooperative membership decisions positively. In this study, the effect is captured by the milk market information access of households. As expected, the results revealed that milk market information access and the probability of dairy cooperative membership were positively related and significant. This can be justified because, as households are informed about the price of milk, it motivates their decision to be a member of dairy cooperatives. Information improves farmers’ knowledge about the marketing conditions of their milk. Similarly, Dejen and Matthews (Citation2016) concluded that access to information facilitates cooperative membership among farmers.
The model results revealed that training access positively and significantly influenced dairy cooperative membership, indicating that the provision of training attracts more farmers to the cooperative. This might be because training helps farmers to modernize the dairy production system, which in turn increases their milk production. Training also raises farmers’ understanding of the importance of dairy cooperatives. The present finding is consistent with Grace (Citation2011); Zeweld et al. (Citation2013); Dejen and Matthews (Citation2016); and Gashaw and Kibret (Citation2018), who reported that credit service increases farmers’ membership in agricultural cooperatives.
The availability of neighboring dairy cooperative members and dairy cooperative membership decisions had a positive significant association. This could happen because the existence of nearby dairy cooperative members motivates farmers’ membership decisions by exchanging information related to dairy cooperatives. Accessibility of information is a key to awareness about the contribution of membership in cooperatives. Furthermore, it helps farmers to understand the importance of becoming a member of the dairy cooperative by observing and asking the neighboring member farmers. Similarly, Ma and Abdulai (Citation2016) explored that the existence of neighboring members positively influences apple farmers’ cooperative membership decisions in China.
4. Conclusions
The results of descriptive statistics revealed that there is significant variation among members and non-members regarding age, dairy farm experience, educational level, extension contact, distance to market and milk cooperative, livestock holding, social responsibility, training participation, milk market information access, and crossbreed cow ownership. The results from the binary probit model indicate that household demographic, socioeconomic, and institutional factors, such as dairy farming experience, family size (man equivalent), livestock holding, participation in training, access to market information, number of crossbreed cow ownership, and neighbor’s membership positively and significantly affect the likelihood of a dairy cooperative membership. This shows that farmers with large resource ownership (livestock, labor, and crossbreed cow) except landholding size are more likely to be a member of dairy cooperatives and benefit from it as compared to non-members. By contrast, farmers having large landholding sizes and far away from the dairy cooperative are less benefited from the dairy cooperative. Additionally, providing training, credit, and market information attracts farmers to dairy cooperatives.
Based on this study, it is recommended that to improve dairy cooperative membership of farmers, enhancing asset ownership, providing sufficient and frequent market information, and providing training about dairy production should be given much emphasis. Moreover, milk collection centers and sub-centers should be established in areas where dairy farmers are located far away from dairy cooperatives.
Biography.docx
Download MS Word (13.5 KB)Disclosure statement
No potential conflict of interest was reported by the author(s).
Supplementary material
Supplemental data for this article can be accessed online at https://doi.org/10.1080/23311932.2023.2289717
Additional information
Funding
Notes on contributors

Abateneh Molla
Abateneh Molla is a full-time lecturer in the Department of Rural Development and Agricultural Extension at Woldia University, Ethiopia. His primary responsibilities include researching livelihood, agriculture, and marketing agricultural products, and teaching. Abateneh Molla Gelaw is a 2021/2022 graduating set from the Department of Rural Development and Agricultural Extension at Bahir Dar University. He has MSc. Degree in rural development Management from Bahir Dar University. Currently he is a full time lecturer at Woldia University in the department of Rural Development and Agricultural Extension, and he has been teaching several courses to the students. His interest areas of research are financial sustainability, poverty reduction, microfinance, gender, agricultural extension, technology adoption and dissemination, livelihood and food security.
References
- Abate, G., Francesconi, G. N., & Getnet, K. (2014). Impact of Agricultural cooperatives on smallholders’ technical efficiency: Empirical Evidence from Ethiopia. Annals of Public & Cooperative Economics, 85(2), 257–17. https://doi.org/10.1111/apce.12035
- Abebaw, D., & Haile, M. (2013). The impact of cooperatives on agricultural technology adoption: Empirical evidence from Ethiopia. Food Policy, 38, 82–91. https://doi.org/10.1016/j.foodpol.2012.10.003
- Ahmed, M. H., & Mesfin, H. M. (2017). The impact of agricultural cooperatives membership on the wellbeing of smallholder farmers: Empirical evidence from eastern Ethiopia. Agricultural and Food Economics, 5(1), 1–20. https://doi.org/10.1186/s40100-017-0075-z
- Bayan, B. (2018). Impacts of dairy cooperatives in smallholder dairy production systems: A case study in Assam. Agricultural Economics Research Review, 31(1), 87–94. https://doi.org/10.5958/0974-0279.2018.00008.3
- Bernard, T., & Spielman, D. J. (2009). Reaching the rural poor through rural producer organizations? A study of agricultural marketing cooperatives in Ethiopia. Food Policy, 34(1), 60–69. https://doi.org/10.1016/j.foodpol.2008.08.001
- Bernard, T. Spielman, D. J. Seyoum Taffesse, A. & Gabre-Madhin, E. Z.(2010). Cooperatives for staple crop marketing: Evidence from Ethiopia (Vol. 164). Intl Food Policy Res Inst.
- Bernard, T., Taffesse, A. S., & Gabre-Madhin, E. Z. (2008). Impact of cooperatives on smallholders’ commercialization behavior: Evidence from Ethiopia. Agricultural Economics, 39, 147–161. https://doi.org/10.1111/j.1574-0862.2008.00324.x
- Borda‐Rodriguez, A., Johnson, H., Shaw, L., & Vicari, S. (2016). What makes rural co-operatives resilient in developing countries? Journal of International Development, 28(1), 89–111. https://doi.org/10.1002/jid.3125
- Buis, M. L. (2010). Stata tip 87: Interpretation of interactions in nonlinear models. The Stata Journal, 10(2), 305–308. https://doi.org/10.1177/1536867X1001000211
- Chagwiza, C., Muradian, R., & Ruben, R. (2016). Cooperative membership and dairy performance among smallholders in Ethiopia. Food Policy, 59, 165–173. https://doi.org/10.1016/j.foodpol.2016.01.008
- Daniel, B. (2018). Social Capital and Smallholder Farmers’ Collective Action: The Case of Primary Dairy Cooperatives in West Shoa Zone, Ethiopia [ Ph.D. dissertation]. Addis Ababa University.
- Dejen, D., & Matthews, H. (2016). Agricultural cooperatives, opportunities, and challenges, the case of bench Maji zone, Ethiopia. Journal of Poverty, Investment and Development, 22, 57–70.
- Ethiopia National Plan Commission (ENPC). (2016). Growth and transformation plan II (GTP II) (205/16-2019/20). Addis Ababa.
- Federal Cooperative Agency (FCA). (2016). Achievements, challenges, and future directions of Ethiopian cooperative movements. Ethiopia.
- Federal Democratic Republic of Ethiopia. (2002). Proclamation no. 274/2002 to provide for the establishment of a cooperative Commission. Federal Negarit Gazeta,
- Food and Agricultural Organization. (2012). Agricultural cooperatives: Key to feeding the World. World Food day Leaflet. Food and Agricultural Organization.
- Food and Agriculture Organization. (2019) . Africa sustainable livestock 2050. Livestock and livelihoods spotlight Ethiopia’s cattle sector.
- Gashaw, B. A., & Kibret, S. M. (2018). Factors influencing farmers’ membership preferences in agricultural cooperatives in Ethiopia. American Journal of Rural Development, 6(3), 94–103.
- Getabalew, M., Alemneh, T., & Akeberegn, D. (2019). Dairy production in Ethiopia-existing scenario and constraints. Biomedical Journal of Scientific & Technical Research, 16(5), 12304–12309. https://doi.org/10.26717/BJSTR.2019.16.002903
- Getnet, K., & Anullo, T. (2012). Agricultural cooperatives and rural livelihoods: Evidence from Ethiopia. Annals of Public & Cooperative Economics, 83(2), 181–198. https://doi.org/10.1111/j.1467-8292.2012.00460.x
- Grace, G. (2011). Exploring the determinants of joining dairy farmers cooperatives in Rwanda: A perspective of Matimba and Isangano cooperatives.
- Kodama, Y.(2007). New role of cooperatives in Ethiopia: The case of Ethiopian coffee farmers cooperatives. African Study Monographs. Supplementary, (35), 87–108. https://doi.org/10.14989/68489
- Kumar, A., Saroj, S., Joshi, P. K., & Takeshima, H. (2018). Does cooperative membership improve household welfare? Evidence from a panel data analysis of smallholder dairy farmers in Bihar, India. Food Policy, 75, 24–36. https://doi.org/10.1016/j.foodpol.2018.01.005
- Long, J. S., & Freese, J. (2006). Regression models for categorical dependent variables using Stata (Vol. 7). Stata press.
- Ma, W., & Abdulai, A. (2016). Does cooperative membership improve household welfare? Evidence from apple farmers in China. Food Policy, 58, 94–102. https://doi.org/10.1016/j.foodpol.2015.12.002
- Machakel Woreda Agricultural Development Office (MWADO). (2020). Unpublished document. Amanuel.
- Mihret, T., Mitku, F., & Guadu, T. (2017). Dairy farming and its economic importance in Ethiopia: A review. World Journal of Dairy & Food Sciences, 12(1), 42–51.
- Ministry of Agriculture. (2019, April). Transforming Ethiopian Agriculture: PowerPoint presentation, briefing for Agricultural Scholar consultative forum. Ministry of Agriculture.
- Misganaw, G., Hailemariam, F., Mamo, D., Tajebe, S., & Nigussie, Y. (2017). Production potential, challenges, and prospects of dairy cooperatives in Aksum and Adwa Towns, Ethiopia. Journal of Dairy Veterinary Animal Research, 5(6), 00165. https://doi.org/10.15406/jdvar.2017.05.00165
- Mojo, D., Fischer, C., & Degefa, T.(2015). Social and environmental impacts of agricultural cooperatives: Evidence from Ethiopia. International Journal of Sustainable Development & World Ecology, 22(5), 388–400. https://doi.org/10.1080/13504509.2015.1052860
- Mojo, D., Fischer, C., & Degefa, T. (2017). The determinants and economic impacts of membership in coffee farmer cooperatives: Recent evidence from rural Ethiopia. Journal of Rural Studies, 50, 84–94. https://doi.org/10.1016/j.jrurstud.2016.12.010
- Nagler, J. (2002). Interpreting probit analysis. New York University.
- Njiru, R. D., Bett, H. K., & Mutai, M. C. (2015). Socioeconomic factors that influence smallholder farmers’ membership in a dairy cooperative society in Embu County, Kenya. Journal of Economics & Sustainable Development, 6(9), 283–288.
- Ortmann, G. F., & King, R. P. (2007). Agricultural cooperatives I: History, theory, and problems. Agrekon, 46(1), 40–68. https://doi.org/10.1080/03031853.2007.9523760
- Petcho, W., Szabo, S., Kusakabe, K., & Yukongdi, V. (2019). Farmers’ perception and drivers of membership in rice production community enterprises: Evidence from the central region, Thailand. Sustainability, 11(19), 5445. https://doi.org/10.3390/su11195445
- Priscilla, L., & Chauhan, A. K. (2019). Economic impact of cooperative membership on dairy farmers in Manipur: A propensity scores matching approach. Agricultural Economics Research Review, 32(1), 117–123. https://doi.org/10.5958/0974-0279.2019.00010.7
- Sebopetji, T. O., & Belete, A. (2009). An application of probit analysis to factors affecting small-scale farmers’ decision to take credit: A case study of the Greater Letaba local Municipality in South Africa. African Journal of Agricultural Research, 4(8), 718–723.
- Sikawa, G. Y., & Mugisha, J. (2013). Factors influencing south-western Uganda dairy farmers’ coffice of milk marketing channel: A case of south-western Uganda. Research Report Series, No: ISSN: 0856-9681, Moshi University College of Cooperative and Business Studies.
- Sulastri, E., & Maharjan, K. L. (2002). Role of dairy cooperative services on dairy development in Indonesia: A case study of daerah istimewa Yogyakarta province. Journal of International Development and Cooperation, 9(1), 17–39.
- Tefera, D. A., Bijman, J., & Slingerland, M. (2016). Smallholder integration into modern agrifood value chains: A case study of the Ethiopian malt barley industry. Wageningen Univerty and Research.
- Tefera, E., & Gebre, H. A. (2015). Performance and determinants of households’ participation in dairy marketing cooperatives: The case of Lemu-Arya and Bekoji dairy marketing cooperatives, Arsi zone, Oromia region, Ethiopia. Global Journal of Emerging Trends in E-Business, 1(1), 240–258.
- Williams, R. (2018). Marginal effects for continuous variables. University of Notre Dame.
- Yadav, G. (2018). Study on the impact of cooperatives on economical development. International Journal of Research-granthaalayah, 6(5), 238–245. https://doi.org/10.5281/zenodo.1270319
- Zeweld, N. W., Van Huylenbroeck, G., & Buysse, J. (2013). Determinants of rural people to join cooperatives in Northern Ethiopia. International Journal of Social Economics, 40(12), 1094–1107. https://doi.org/10.1108/IJSE-07-2012-0138