
 ?Mathematical formulae have been encoded as MathML and are displayed in this HTML version using MathJax in order to improve their display. Uncheck the box to turn MathJax off. This feature requires Javascript. Click on a formula to zoom.
Abstract
Ethiopia is frequently mentioned as a country that is extremely vulnerable to climate change. The country’s high vulnerability is mostly from its climate-sensitive agricultural sectors. However, changes in rural household livelihood vulnerability levels were detected across agro ecologic zones. Thus, this study aimed to investigate agro-ecological-based farm households’ livelihood vulnerability to climate change in Wolaita Zone, Southern Ethiopia. The study used LVI-IPCC in addition to the overall vulnerability index to quantify vulnerability factors in three selected agro-ecologies. In this study, both primary and secondary data were used. Primary data were acquired from 371 sampled households, as well as through a focus group discussion and key informant interviews. Secondary data, notably climatic data, was accessed for the years 1991 to 2022. Data on biophysical features were also collected and incorporated into indices. The study found significant variation in vulnerability factors among agro-ecological systems, with Kola agroecology being the most vulnerable (0.04) due to its high exposure (0.59) and sensitivity values (0.58), and low ability to adapt (0.52). Dega agroecology was the least vulnerable (0.48) due to its low exposure (0.46) and sensitivity (0.44). Woyna Dega agro-ecology had an intermediate score in all three factors. Based on our findings, we suggested that resilience-building adaption strategies were critical for reducing the vulnerability of smallholder farmers, and the plans should also take into account local conditions. It also advocates for more decisive policy measures to improve the community’s adaptive capacity and reduce its exposure level.
1. Introduction
Climate change is quickly emerging as one of the most serious problems that humanity has ever faced (IPCC, Citation2022; Oo et al., Citation2018). The reality of changes in the climate is now widely acknowledged, and there is mounting evidence that it poses a severe threat to development (IPCC, Citation2023). The extreme events of climate change lead to widespread social, economic, ecological, and psychological difficulties (Adger et al., Citation2017; Mekonen & Berlie, Citation2021). The escalating climate threat is expected to have far-reaching biophysical and socioeconomic repercussions, even in the long term (Formetta & Feyen, Citation2019). However, the extent of vulnerability to extreme climate change is determined by a range of factors and differs among location, and social groups (Adger et al., Citation2017; Mekonen & Berlie, Citation2021). Comprehending vulnerability is therefore essential to helping communities lessen the risks associated with climate change.
Due to its reliance on ecosystem services and goods, low adaptive ability and marginal locations, Africa is one of the continent’s most vulnerable to extreme climate events (Adu et al., Citation2018; Hahn et al., Citation2009; Hegga et al., Citation2016). As indicated by (Esayas et al., Citation2018), the climate of Africa is already changing, and the implications are being felt by communities throughout the continent. Climate change affects all economic sectors in Africa, either directly or indirectly, but subsistence agriculture remains among the most sensitive and inherently prone to climate change extremes (Asfaw et al., Citation2021; Bedeke, Citation2021). The rural residents in Africa whose primary source of income is subsistence agriculture suffer the most from infrequent and unpredictable high-intensity climate-related risks (IPCC, Citation2018; Senbeta, Citation2009). This is primarily due to Africa’s poor socioeconomic development and biophysical fragility, which has a detrimental influence on the continent’s aspiration for sustainable development goals to minimize its vulnerability to climate-induced risks.
Ethiopia, one of the most vulnerable countries in Africa to climate change, is steadily confronted with climate related adversities, most notably flooding and drought (Gitima et al., Citation2021; Harris et al., Citation2020). Climate change in Ethiopia takes place against the background of the trends in demography, economy, and governance (IPCC, Citation2014). It costs Ethiopia’s economy more than one-third of its potential growth and is expected to lower annual economic growth by 38% while raising poverty by 25% over the next twelve years (Medhin & Mekonnen, Citation2019). However, vulnerability to climate change is determined by a combination of climatic stress and various social, economic, and biophysical factors (Al et al., Citation2023; Asmamaw et al., Citation2019; Ho et al., Citation2022). This indicates a system is vulnerable if it is exposed to and susceptible to the consequences of climate change while simultaneously having limited adaptive potential (Edamo et al., Citation2022; Ukumo et al., Citation2022).
Ethiopia is particularly vulnerable to climate-related hazards since smallholder farming dominates overall livelihoods and is heavily dependent on rain-fed agriculture (Zeleke et al., Citation2021). The present climate-related shocks and strains have already had a significant influence on the vulnerability of farm households’ livelihoods in Ethiopia (Gitima et al., Citation2021). Ethiopia’s recurring floods and droughts cause loss of life, property, and displacement (Amare & Simane, Citation2017). For instance, over the last 20 years, droughts have afflicted nearly 2 million Ethiopians on average every year. According to (Simane et al., Citation2016), more than 6.8 million people have been affected by the current drought, which has resulted in an estimated 2.5 million cattle losses and increased demand for water and food assistance for more than 4.4 million and 7.2 million people, respectively. Thus, investigating climate change impacts and vulnerability guides the development of effective adaptation strategies, which should consider farm-level exposure, sensitivity, and adaptive capacity.
Several studies on farm households livelihood vulnerability to climate change have been undertaken in Ethiopia, but the majority of them were on a larger scale and used political administrations as unit of study (Abeje et al., Citation2019; Adamseged et al., Citation2019; Asfaw et al., Citation2021; Ebrahim et al., Citation2022). For instant (Abeje et al., Citation2019), built their study on integrated vulnerability assessment methods, which employed macro-level indicators. Consequently, the large-scale vulnerability assessment could not reveal discrepancies in the level of vulnerability of farm households and their adaptation approaches based on local circumstances, and outcomes may not adequately reflect the facts required for practical implementation. Furthermore, regarding policy implications in Ethiopia in general and the study area in particular, integrated and area-specific vulnerability assessments were scarce and insufficient. As a result, the focus of this study was on small-scale farm household livelihood vulnerability assessments in order to better understand community exposure, sensitivity and adaptation capacity and so assist policy makers in tailoring policies to local context.
Besides, different studies on smallholder farmers’ livelihood vulnerability in Ethiopia have produced conflicting results. According to the findings of (Asfaw et al., Citation2021; Dendir & Simane, Citation2019; Mekonen & Berlie, Citation2021; Zeleke et al., Citation2021), Smallholder farmers in the Kola agro-ecology were shown to be more vulnerable to climate change adversity than farmers in other agro-ecological settings. This was not the case for (Tesso et al., Citation2012), who discovered that farmers in Dega agro-ecology were considerably more vulnerable to risks caused by climate change than Kola farmers. In addition (Abeje et al., Citation2019), on their finding disclosed that midland agro-ecology is more vulnerable to climate change extremes in comparison to other agro-ecological settings. On the other hand (Aboye et al., Citation2022; Asrat & Simane, Citation2017), conducted a study on the major climate change extremes experienced by farm households with in lowland agro-ecology. However, these studies lack a multidimensional comparative analysis of smallholder farmers’ livelihood vulnerability across different locations. To get a clear conclusion, this study investigated in-depth assessments of smallholder farmers’ livelihood vulnerability across agro ecologies in southern Ethiopia,Wolaita zone.
2. Materials and methods
2.1. Description of the study area
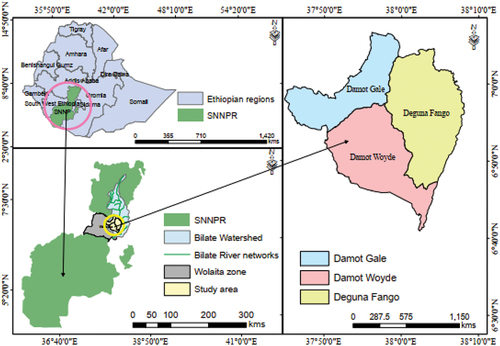
The Wolaita zone, located in South Ethiopia, covered 4,511.7 km2 and is structured with 16 Districts and 6 registered towns (Wolaita Zone Plan Departement, Citation2020). The administrative center of the Wolaita zone is Sodo town. The zone is positioned in the western escarpment of the Great East African Rift Valley, which crosses the country in two land areas, between 6.4º-7.1º N latitude and 37.4 º − 38.2 º E longitude (Figure ).
Figure 1. Location map of the study area.
Concerning population distribution, the rural area is home to the overwhelming majority of the Zone’s inhabitants, comprising 1,817,429 individuals, or 78 %, and the remaining 22 %, equivalent to 426,650 people, reside in urban areas (Wolaita Zone Plan Departement, Citation2020). The Wolaita zone is one of Ethiopia’s most densely populated area, with a population density of 515 people per square kilometer (Rahmato, Citation2007). In terms of dependency ratio, the Wolaita zone has 935,712 children (46%), 1,070,663 working-age people (52.2%), and 37,704 elderly people (1.8%), resulting in a high dependency ratio of 92% and the rate of population growth was (2.9% per year).
According to Ethiopia’s agro-ecological zone classification, the area is mostly described by mid-highland agro-ecology (1500–2300 m above sea level). Woyna Dega comprises the majority of the area (56%), with Kola and Dega representing the rest 35% and 9% (Olango et al., Citation2014). The Wolaita zone has a wide range of elevations, with the lowest point at Bilate Tena being 501 m above sea level and the highest peak, Mount Damota, standing at 2962 m above sea level (Jufare, Citation2008). The area features a highland relief that encompasses much of the midland, with lowlands on the peripheries. Even though there are large variations in the amount of rainfall between years; the area has dominantly dependent on Belg rains which extend from the end of February to early April (Esayas et al., Citation2019). Though, the amount, period, and frequency of rainfall vary considerably across agro-ecologies.
2.1.1. Livelihoods of the study area
Farming is the main source of livelihood in the zone, with mixed crop and livestock production predominates. As indicated by (Eneyew & Bekele, Citation2012), the Wolaita zone is generally divided into two livelihood zones: maize and root crops and ginger and coffee. The Zone’s midland and dry midland terrains are dominated by maize and root crops, while the highland was dominated by root crops and perennials. Crop production was generally the main source of livelihood, while livestock provides food, financial income, and insurance against uncertainty (Jufare, Citation2008). The smallholder farmers in the Wolaita zone were engaged in livestock production in addition to crop production including cattle, goats and sheep, equines and poultry. However, livestock in the study area were fed by open grazing, stall feeding, and tethered, which hastens changes in the local climate (Babiso et al., Citation2016). Moreover, overgrazing, poor land management coupled with rapid population growth, and traditional livestock production nurture the trends of changes in the climatic condition.
2.2. Research approaches and design
Researchers have debated for years the philosophical basis of the problems surrounding humans and nature. Such debates and opinions on research paradigms are broadly classified as quantitative and qualitative (Bryman, Citation2004). Each research paradigm has its own unique underpinnings and applied with in a specific approach to conduct research. Quantitative research strategies emphasize quantification in data collection and analysis and involve deductive approaches to test the theory, while qualitative research mainly emphasizes inductive approaches to generate theory (Daniel, Citation2016). As a methodology, the mixed research approach incorporates philosophical assumptions that drive the direction of data collection and analysis and mixes qualitative and quantitative methodologies at various phases of the research process (Schattman et al., Citation2018). As a result, this study used a mixed research approach, primarily through contemporaneous triangulation, in which qualitative and quantitative data were collected and processed concurrently. The quantitative technique, however, held more weight given the nature of the study and its overarching research questions, with the qualitative approach being employed to support quantitative findings and derive meaningful conclusions. The pragmatic perspective, which is the most helpful philosophy to promote mixed research methods and expedite the use of different methods in a single study, served as the broad philosophical foundation for this study.
2.3. Sampling techniques and procedures
The choice of the study survey area and the determination of the sample size were the topics covered in this section. Both probability and non-probability sampling strategies were used to pick the sample households for this investigation. To be fairly representative of the entire Zone, the study used multi-stage sampling techniques to choose the Districts/AEZs/in the Zone, the Kebeles within the selected Districts, and farm households across each Kebele for data collection at different stages.
In the first stage, the study Districts/AEZs/under the Bilate Wolaita sub-watershed within the Wolaita zone were purposefully selected. The districts within the Bilate Wolaita sub-watershed were then stratified into three agro-ecologies: Dega, Woyna-dega, and Kola, in order to estimate the extent of livelihood vulnerability to climate change among households. Subsequently, three Districts from each agro-ecology were selected to represent the administrative zone: Damot Gale (Dega), Damot Woyde (Woyna Dega), and Deguna Fango (Kola).
Three main reasons were considered when selecting the study Districts/AEZs/: The first reason was the high vulnerability of the Districts under Bilate Wolaita sub-watershed to climate-related risks, particularly drought and flooding, and is a known hotspot area in Wolaita Zone. According to (Wolaita Zone Plan Departement, Citation2020), this area has suffered from severe environmental degradation and the occurrence of climate change extreme, which has consistently impacted farm production. The second was the agro-ecological location, which was Dega, Woyna Dega, and Kola in line with Ethiopia’s traditional agro-ecological zones grouping. In this case, the dominant agro-ecology of the District and the existence of active meteorology stations were used as criterion. The third reason was the availability of precipitation and temperature data for at least 30 years (1991–2022) to measure variability and related extremes. Based on the availability of precipitation and temperature data as well as the agro-ecological location, three meteorological stations under the Bilate Woliata sub-watershed were selected to conduct variability analysis: Boditi School (D/Gale), Mayokote (D/Woyde), and Bilate Tena (D/Fango).
In the second stage, since District contains a number of Kebeles with varying agro-ecologies, Kebeles were stratified by agro-ecology, and then random sampling was employed to select representative kebeles in each District according to their agro-ecology characteristics. This ensures that the chosen Kebeles came from mutually exclusive AEZs, accounting for agro-ecologic variation within the study area. Then, three Kebeles from each AEZ (Highland, Midland, and Lowland) were selected to generate a total of 9 Kebeles.
The third stage of the multi-stage sampling technique was the selection of survey participants. A systematic sampling procedure was used to pick survey respondents from a list of selected Kebeles. In addition, the survey respondents from each AEZ were chosen using the Probability Proportional to Size (PPS) sampling method. The selection of sample household involves (i) receiving a list of N populations in each agroecology from the respective Kebele administrators; (ii) calculating sample size n; (iii) providing a sequence number for each N household and (iv) selecting one unit from the sampling frame and then calculating to derive the next units based on the size of the interval (Taherdoost, Citation2017). The sample size was then calculated using the rule of (Kothari, Citation2004), which is more appropriate for heterogeneous and large-size populations computed using (Equation1–2):
Where:
n = Sample size;
Z = Confidence interval under the normal curve that is 95% (1.96);
p = 0.5 (proportion of the population to be included in the sample that is 50%);
q = None occurrence of event = 1–0.5; that is 0.5;
N = Population size;
e = Marginal error (acceptable error term) (0.05);
Accordingly, out of a total of 3,604 households, 140 sample households (38%) were randomly selected from highland, 133 sample households (36%) out of a total of 3,423 households from the Midlands, and out of a total of 2,519 households, 98 households (26%) were randomly chosen from the lowlands. Thus, the total sample size was 371 households drawn from a total of 9,546 households.
2.4. Sources and methods of data collection
Data collection will begin once the target population, sampling frame, sampling procedure, and sample size have been determined. Data for this study were gathered from primary as well as secondary sources, and the data collection process ran from November 2022 to February 2023. The primary data were data from a cross-sectional survey that was carried out among 371 sample households across three agro-ecological zones. Tools utilized to gather primary data include household survey questionnaires, interviews with key informants, focus group discussions, and observations. A structured survey questionnaire was employed to assemble detailed information on household demographics, socio-economy, and livelihoods. Climate context, including temperature and rainfall patterns; climate extremes; climate change impacts; and prevailing uncertainties, were also addressed. In addition, 17 key informants were interviewed to triangulate and supplement the quantitative data. Furthermore, secondary data, particularly climatic data for the three stations, were gathered from the National Meteorology Agency from 1991 to 2022. The study also examined official documents, reports, and strategies addressing climate change and household’s livelihood vulnerability in Ethiopia in general and the study area in specifically.
3. Methods of data analysis
3.1. Computing the livelihood vulnerability index
To assess the vulnerability of household livelihoods to climate-related threats, the study used the Livelihood Vulnerability Index (LVI) developed by (Hahn et al., Citation2009), based on the IPCC vulnerability framework. The Livelihood Vulnerability Index (LVI) is a comprehensive, flexible and interdisciplinary method that considers socio economic, biophysical, and environmental aspects (Ebrahim et al., Citation2022). To reflect the local setting, different authors used the same framework with some key component adjustments (Abeje et al., Citation2019; Adu et al., Citation2018; Asfaw et al., Citation2021). However, this study employed comprehensively identified nine major and sub-components to determine the extent of livelihood vulnerability of farm households (Tables ). Despite the fact that each major component has a different number of sub-components, the method is a balanced weighted average approach in which each sub-components contributes equally to the overall index. Different methods of normalizing indicators are available in the literature, but in the present study, the United Nations Development Program (UNDP) approaches for computing the “Human Development Index” was used (Venus et al., Citation2022) (Equation 3).
Table 1. Major components, indicators, and explanation
Table 2. LVI-IPCC contributing factors, major components and number of Subcomponents
Where: represents the original sub-component or a normalized value of an indicator,
is the mean of the sub-component,
represents the minimum value of each sub-component and
represents the maximum value of each sub-component for the entire sample.
Following the normalization of each component, the sub-component indicators were averaged to compute the respective major components (Equation 4):
Where: is the corresponding major component for each district, n is the number of sub-components,
is the normalized values of the sub-components of the respective major component.
Once the values for each of the nine key components for each district (agroecology) were determined, they were averaged using (Equation 5) to yield the district-level LVI.
Where: is the contributing factor to the overall LVI-IPCC per district (d), W is weight for each major component M, d is the district, and n is the number of major components. Which can also be expressed using (EquationEquation 6
(6)
(6) ).
Where: the district d Livelihood Vulnerability Index, equals the weighted average of the nine main components. The weights of each major component, were determined by the number of sub-components that comprise each major component and were included to ensure that all sub-components contribute equally to the overall LVI (Hahn et al., Citation2009)). The LVI was scaled from 1 (most vulnerable) to 0 (least vulnerable).
3.2. LVI—IPCC estimation
The LVI-IPCC index is an approach for evaluating LVI that combines the IPCC concept of vulnerability (Gravitiani et al., Citation2018). For this analysis, the main components of LVI were divided into three categories: adaptive capacity, sensitivity, and exposure, which describes the procedures of calculating LVI-IPCC. The nature and extent to which a system is threatened by large climate fluctuate is represented by exposure. In this study, the average number of extreme events that occurred and were reported by respondents in the past ten years (drought, flood, injury, or loss of life, as well as no access to warning about impending natural disasters). The second component of exposure was climate change, which comprised fluctuations in average temperature and rainfall from 1991 to 2022. Adaptive capacity, on the other hand, was defined as a household’s or personal ability to deal with the problems of climate change extremes through local knowledge and adaption tactics (such as socio-demographic profiles, livelihood strategies, and social networks). The extent to which a system is influenced by climate-induced stimuli, either negatively or positively, is referred to as sensitivity. In this study, sensitivity was measured in terms of households’ food and health status, as well as access to water, land use, and sustainability. The LVI-IPCC ranged from −1 (least vulnerable) to 1 (most vulnerable) (Hahn et al., Citation2009) and was computed using (Equation 7).
Where: is the IPCC-defined contributing factor (exposure, sensitivity, or adaptive capacity) for household d,
is the major component for household d indexed by i,
is the weight of each major component, and n is the number of major components in each contributing factor.
The three contributing factors were merged using the following equation after determining exposure, sensitivity, and adaptive capacity (Equation 8):
Where: is the LVI for district (AES) d expressed using the IPCC vulnerability framework,
is the exposure score for district d,
is the adaptive capacity score for district d, and
is the weighted average sensitivity score for district d.
4. Results and discussion
The results of livelihood vulnerability analysis in this study for each agroecology were presented in two steps. The overall LVI was presented first, along with the analysis of different profiles and the contributions of each indicator across agro-ecologies. Second, based on the three vulnerability parameters (exposure, sensitivity, and adaptive capacity), the LVI-IPCC vulnerability assessments for each agro-ecologic zone were displayed.
4.1. Results of overall livelihood vulnerability index (LVI)
Table demonstrated that the findings of livelihood vulnerability indices among agro-ecologies ranged from 0.476 to 0.555. Farm households in Kola agro ecology (Deguna Fango) were shown to be more vulnerabile to extreme events of climate change than those in Dega (Damote Gale) and Woyna Dega (Damot Woyide district). As measured by LVI, the values of individual components were also variable among the three agro ecologies. As claimed by survey respondents, the high sensitivity and exposure factors that include poor health, low food availability, poor water quality, and exposure to extreme climate events, such as high temperatures and intense rainfall that led to extreme drought and excessive flooding, are to blame for the livelihood vulnerability of farm households in the Kola agroecology (Deguna Fango districts). As indicated by (Ebrahim et al., Citation2022), the key factor affecting how vulnerable farm households are to climate change is sensitivity and exposure factors. Comparably similar findings were made in Ethiopia, where farm households in the Kola agroecology were found to be more vulnerable than those in other agro-ecologies (Asfaw et al., Citation2021; Dendir & Simane, Citation2019; Mekonen & Berlie, Citation2021; Parker et al., Citation2019).
Table 3. Livelihood vulnerability index (LVI
4.1.1. Socio-Demographic Profile
This main component consists of four indicators, including the household head’s education level, dependency ratio, farming experience, and female as household head. With a weighted average of 0.406, the Kola agroecology (D/Fango district) demonstrated a more vulnerability in terms of the socio-demographic profile, followed by the W/Dega (D/Woyde district) and Dega (D/Gale District), with weighted average scores of 0.383 and 0.307, respectively. W/Dega agroecology (D/Woyde district) was found to be more vulnerable when the dependency ratio alone was taken into account, with an average score of 0.19, followed by Kola (D/Fango district) with 0.17, and Dega (D/Gale district) with an average weighted score of 0.02. This could be because the percentage of people under the age of 15 and over the age of 64 who were dependent was greater in W/Dega (D/Woyde district). This illustrats that, a household member’s vulnerability to climate change increases with their level of dependency ratio (Huong et al., Citation2019).
The second indicator in the socio-demographic main component is farming experience. By modifying planting dates, selecting crop varieties, and farm management techniques, it is anticipated that experience will offer the chance to lessen vulnerability to the effects of climate change (Venus et al., Citation2022). In this case, household heads in the Kola agro-ecology have more years of agricultural experience on average (40 years) than those in the W/Dega agro-ecology (38 years) and Dega agro-ecology (36 years). Farm households in Kola agro-ecology, therefore, have a better opportunity of adapting to the potential effects of climate change that lessen their vulnerability. In terms of gender, the three agro ecologies revealed that around 95% of families were headed by men. However, with a slight difference, the Dega agroecology was more vulnerable than the W/Dega and Kola agro ecologies, both of which have a weighted average score of 0.02. Due to gender disparities, female-headed households were more vulnerable to harsh climate condition than male-headed households (Asfaw et al., Citation2021).
Concerning the household head’s educational level, the Kola agroecology has a high vulnerability score of 0.765, followed by the W/Dega at 0.745 and the Dega agroecology at 0.614. This result revealed that more than 60% of respondents lacked basic literacy skills in three of the sample agro ecologies, rendering them more vulnerable to the effects of climate change. Studies have shown that household decisions, planning, and the family’s well-being are all based on the household head’s educational level (Dendir & Simane, Citation2019). The ability of the household to comprehend extension services and use alternative options in times of shock is also improved by education (Idrissou et al., Citation2020). Illiterate households, on the other hand, have limited access to climate change information, were unable to attend training, and have little experience with diversification, making them particularly vulnerable to climatic shocks.
4.1.2. Livelihood strategies
Three sub-components make up the livelihood major component: households that rely mostly on agriculture, households that work outside of the community, and households that have no jobs when extreme weather events occur. The W/Dega (D/Woyde district) had the highest vulnerability (0.714) based on the weighted average score for the component of livelihood strategies, followed by the Dega (D/Gale district) (0.67), and the Kola (D/Fango district) with 0.607.
It was believed that excessive reliance on agriculture as an income and food source will reduce the Farm households’ ability to adjust to climate shocks. In this regard, higher reliance on agriculture as a source of livelihood was a significant feature of the three agro-ecologies, with less than 20% participating in non-farm/off-farm activities. Farm households in W/Dega agro-ecology rely on agriculture for livelihood at a high rate (93.1%), followed by Kola (91%) and Dega (87%). A household has a greater probability of adjusting to short-term shocks to its means of subsistence the more non/off-farm activities it participates in (Ebrahim et al., Citation2022). W/Dega (D/Woyde district) had a high vulnerability score (0.67) based on household members who migrated outside of communities, compared to Kola (D/Fango districts) and Dega (D/Gale districts), which had average weighted values of 0.37 and 0.56, respectively. This implies that households in the W/Dega agro-ecology engaged in slightly more diverse livelihood activities than those in the Dega and Kola agro ecologies. However, diversifying one’s source of income does not guarantee that one’s livelihood will be less vulnerable. Varying climate shocks and stressors have capricious effects on livelihoods depending on the type of livelihood and its ability to withstand the effects of extreme occurrences (Suryanto & Rahman, Citation2019).
Climate change will have a significant negative influence on employment across all economic sectors and geographical areas, resulting in climate-induced migration, the expansion of precarious and informal jobs, and a rise in unemployment (ILO, Citation2018). In terms of the proportion of family members who reported no work when extreme weather events occur, the Dega agroecology (D/Gale districts) had a high vulnerability score (0.57), whereas the W/Dega and Kola had a similar vulnerability score (0.54). As the respondents claimed, Kola agro-ecology provides more employment prospects than others due to considerable irrigation-based agriculture investments.
4.1.3. Social network
The social network is comprised of four sub-components: lending money to others, borrowing money from others, receiving government assistance, and the distance to the nearest market. The LVI’s regarding the social network component, the Kola agroecology (D/Fango district) was more vulnerable than the W/Dega (D/Woyde district) and Dega (D/Gale district) (0.573 vs. 0.534 and 0.523, respectively). To lessen household and community vulnerability to changing climate, well-developed and coordinated social networks were required (Hahn et al., Citation2009).
In terms of borrowing money from others, the findings revealed that 72% of households in the W/Dega agro-ecology had received money from others, which was higher than the Dega (68%) and Kola (55%) agro-ecologies. While lending money to others, Kola (D/Fango district) has the highest value (0.46), followed by W/Dega and Dega, which have weighted average scores of (0.14) and (0.16), respectively. Help is a small-scale funding initiative for agricultural or other small business ventures (Asrat & Simane, Citation2017). It might be deduced that households that borrow more than they lend are more vulnerable. In terms of households that do not seek government aid, the Kola agro-ecology has the highest score (0.68), followed by the Dega and the W/Dega, which have scores of 0.65 and 0.62, respectively. Furthermore, farmers in the Kola agroecology reported commuting 9.4 kilometers to the nearest market, compared to 7.6 km and 6.3 km for farmers in the Dega and W/Dega, respectively. This indicates that the longer they had to travel to the nearest market, the more vulnerable they were.
4.1.4. Land use and sustainability
The greatest reliance on the climate-sensitive sector, as well as poor land use practice and management, exacerbates farm households’ vulnerability to climate induced shocks (Asrat & Simane, Citation2017; Mekonen & Berlie, Citation2021). The component of land use and sustainability includes two indicators: households that did not conduct soil and water conservation and households that did not practice irrigation. In terms of land use and sustainability, Dega agroecology (D/Gale districts) (0.65) was more vulnerable than W/Dega and Kola agro ecologies, which had weighted average scores of 0.59 and 0.34, respectively.
The average weighted vulnerability score for the three agro ecologies in terms of not conducting soil and water conservation practices demonstrated a little difference with the respective of W/Dega, Kola, and Dega; 0.48, 0.46, and 0.43. While the Dega agroecology (D/Gale district) had the highest vulnerability score (0.87), followed by W/Dega (D/Woyde district) (0.7), the Kola agroecology (D/Fango district) had the least vulnerability score (0.23). Protecting the soil from erosion and drying out, as well as improving soil moisture levels and water transmission, was essential in minimizing farm household livelihood vulnerability (Altieri et al., Citation2015).
4.1.5. Health status
Four indicators were used to examine health vulnerability: households without improved toilets, members of families with chronic illnesses, the average distance to the nearest health center, and access to health insurance. Based on the overall health vulnerability score, the Kola agro-ecology (D/Fango District) was highly vulnerable, with an average score of 0.577, while the Dega (Damot Gale District) and W/Dega (D/Woyde District), with weighted average scores of (0.401 and 0.518) respectively, indicated less vulnerable.
Due to the absence of improved toilets, the W/Dega agro-ecology was more vulnerable than the Dega and Kola agro ecologies (average weighted score: 0.77 vs. 0.43 and 0.73, respectively). When coupled with more frequent climate shocks, the absence of improved toilets could have serious health effects. Lack of access to improved toilets can result in a higher frequency of illnesses brought on by poor hygiene (Asmamaw et al., Citation2020; Mengistu, Citation2022). Poor sanitation during floods may exacerbate outbreaks of infectious and water-borne diseases (Levy et al., Citation2019). Kola agro-ecology (0.64) was shown to be more vulnerable to chronic illness than W/Dega and Dega agro-ecologies, which had weighted average scores of (0.335) and (0.228), respectively.
W/Dega had a higher vulnerability (0.57) for the average time it took a household to reach a health center than Dega (0.53) and Kola (0.43). W/Dega had a higher vulnerability (0.57) for the average time it took a household to reach a health center than Dega (0.53) and Kola (0.43) agro ecologies. Thus the distance to the health center revealed the direct relation with vulnerability to climate change extremes.
Access to health insurance was another sub-component of health profiles that was more vulnerable in the Kola (0.51) than in the W/Dega and Dega agro ecologies (with weighted average scores of 0.397 and 0.378, respectively). Changes in the Climate were increasing risks that pose threats to healthcare facilities functioning (Paterson et al., Citation2014; Zeleke et al., Citation2021). Strengthening health systems, especially healthcare facilities, is an important component of health adaptation planning and should be incorporated into each country’s Health National Adaptation Plan. Simultaneously, action to mitigate and adapt to climate change is urgently required to reduce climate-related pressures on health-care systems.
4.1.6. Food profiles
Under this major component, three indicators were discovered. One was the proportion of households that acquired their food from their own farms, another was the percentage of households that do not save crops from each harvest, and the third was the average number of months when households struggle to get food.
With average vulnerability scores of 0.65, 0.469, and 0.474, respectively, households in the Kola agroecology (D/Fango district) were much more vulnerable to food profile than those in the W/Dega (D/Woyde districts) and Dega (D/Gale district). Thus, the extent to which the impact of climate change on food status was dictated by how exposed and vulnerable people were to these shocks (Dendir & Simane, Citation2019). Numerous studies that supported these findings found that Kola agro ecology was more vulnerable to changes in food profiles than other agro-ecologies (Abeje et al., Citation2019; Ebrahim et al., Citation2022; Shen et al., Citation2022). For households that acquire their food from their own farm, W/Dega agro-ecology earned the highest index score (0.679), followed by Dega (0.65) and Kola (0.469).
According to the findings, 76.53 and 41.4 percent of households in Kola and Dega agro-ecologies, respectively, do not save crops. They also stated that many households in the area harvest and sell the crops in a green stage and the others were engaged outside their farm. The average number of months per year that households in the Kola reported struggling to feed their families was 7.02, which was more than the averages for W/Dega and Dega agro-ecologies (6.49 months and 4.35 months per year), respectively. The survey participants reported that the off-seasons and inter-cultivation times were the most challenging for obtaining food. This is due to changes in rainfall patterns and heavy rainfall brought on by climate change, which result in floods or inundation in the paddy fields of the Kola and W/Dega, causing crop failure and productivity losses.
4.1.7. Water vulnerability profiles
Climate threats to water delivery systems were becoming more obvious as a result of both an increase in the frequency of extreme events and continued pressures on the availability and quality of water supplies (Adu et al., Citation2018). The primary causes of water vulnerability in rural areas, however, were the agriculture sector’s reliance on water sources and the state of the existing infrastructure (Suryanto & Rahman, Citation2019). In analyzing water vulnerability profiles, three indications were taken into account: the sources of water, the typical distance that households must travel to reach their main source of water, and the inconsistency of water supply. In the LVI of the water component, the Kola (D/Fango district) was found to be more vulnerable (0.713) than the W/Dega (D/Woyde district) and Dega (D/Gale district), which had weighted average scores of (0.65) and (0.339), respectively. In agreement with this finding, scholars highlighted that Kola agroecology has highly vulnerable than W/Dega and Dega in terms of water components (Asfaw et al., Citation2021; Asmamaw et al., Citation2020; Ebrahim et al., Citation2022).
Kola agroecology (D/Fango district), which depends on natural water sources, was more vulnerable than W/Dega (D/Woyde district) and Dega (D/Gale district), which had weighted average scores of (0.58) and (0.41), respectively. Furthermore, many respondents from Kola agroecology (D/Fango district) claimed that during the dry season, natural springs and other natural water sources dried up. They also mentioned that the availability of water in the source was irregular. With regard to the inconsistent availability of water sources, the Kola agro-ecology (D/Fango districts) had the highest value, with an average weighted score of (0.86), followed by the W/Dega (D/Woyde district), with a score of (0.75), and the Dega (D/Gale districts), with a weighted average score of (0.28). With regard to distance to a water source, the Kola agroecology (D/Fango district) had a longer average distance to the nearest water source (12.35 km) than the W/Dega (D/Woyde district) and Dega (D/Gale district), which had average distances of (7.35) and (3.921), respectively. The distance to water source was therefore, indicates the level of vulnerability.
4.1.8. Climate change
The Gradual changes in rainfall and temperature can be used to detect climate change (Formetta & Feyen, Citation2019). The climate change component was represented by three indicators: the average daily maximum temperature, average daily minimum temperature, and average precipitation over the last 30 years. Kola and W/Dega agro ecologies had the greatest climate change vulnerability index values, with weighted average scores of 0.5 and 0.51, respectively. While the indicator value for the Dega agro-ecology was 0.49. This indicated that almost all the three-agroecology exhibited nearly similar vulnerability scores.
In addition, Kola (D/Fango district) showed high vulnerability scores for average maximum temperature with a value of 0.61, while W/Dega (D/Woyde district) had the highest score for average minimum temperature with an index value of 0.71. The Dega (D/Gale district) have the highest vulnerability index values in terms of average precipitation (0.51), while the Kola (D/Fango districts) have the lowest values (0.37). Three agro-ecologies endure variance, as evidenced by the mean temperature and precipitation indices. The survey result and meteorological data indicated that the average monthly maximum temperature record in the study area has linearly increased, whereas the trend in precipitation was decreasing trends. However, trends in precipitation were apparently accompanied by late onset, early exit, and prolonged rainfall in some seasons as claimed by survey participants.
4.1.9. Extreme events
This main component was an amalgamation of the frequency of floods and droughts during the past ten years, households (HHs) that did not receive warnings, and households that suffered harm or lost their lives as a result of extreme events. In terms of the four indicators of extreme event, the Kola agroecology has a higher vulnerability index (0.65) than the Dega and W/Dega agro ecologies, which have weighted average scores of 0.433 and 0.561, respectively.
According to this finding, Dega agro-ecology exhibited frequent floods in the last ten years, with an average frequency of 6.3, while Kola agroecology experienced frequent droughts, with an average frequency of 8.75. In contrast, the W/Dega (4.3) and the Dega (3.75) had the lowest frequency of floods and droughts, respectively. Households that did not receive a warning, and injury or loss of life during extreme events with respective values of 0.89, and 0.17, Kola agro-ecology scores high but with the respective value of 0.66 and 0.057 Dega agro-ecology scores low.
4.2. Household livelihood vulnerability index under IPCC
The HLVI-IPCC results showed that the three agro ecologies, which were scored from −1 to + 1, had different levels of vulnerability (Dendir & Simane, Citation2019). For each of the three agro ecologies, the LVI-IPCC estimates were −0.011 for Dega, 0.007 for W/Dega, and 0.04 for Kola. The nine major components were divided into three groups for the purpose of calculating the LVI-IPCC: exposure, sensitivity, and adaptive capability (Table ).
Table 4. Indicators, profiles, and overall livelihood vulnerability index (LVI) of the three AEZs
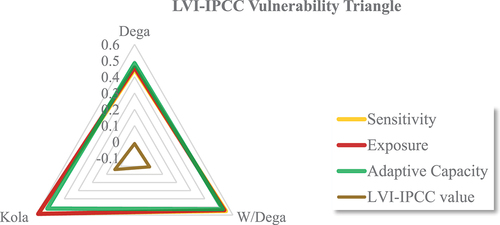
The vulnerability triangle, depicted in Figure , presents the IPCC definition of vulnerability, which takes into consideration exposure, sensitivity, and adaptive capacity and ranged from −0.011 (low vulnerability at Dega) to 0.04 (high vulnerability at Kola).
Figure 2. Vulnerability triangle of the IPCC.
4.2.1. Exposure vulnerability factor
This shows what was at risk as a result of exposure to changing climate and related extreme occurrences. The exposure profile includes seven indicators for extreme events and climate change. Four indicators of extreme events and three indicators of climate change were looked at in the analysis of exposure vulnerability factors. The vulnerability factors analysis revealed that Kola agro-ecology was more vulnerable by exposure vulnerability factor (0.584), whereas Dega agro-ecology was found to be the least vulnerable (0.457). W/Dega agro-ecology achieved an intermediate result in terms of the exposure profile average value, with a weighted average score of 0.54.
4.2.2. Adaptive capacity factor
Adaptive capacity is the ability to deal with change and adjust to changing situations. It is determined by a variety of socio-economic factors, including wealth, agricultural technology utilization, infrastructural development, and social capital profiles (Asrat & Simane, Citation2017). Three main components, including the socio-demographic characteristics, livelihood options, and social networks, make up the adaptive capacity factor. In terms of adaptive capacity factors, W/Dega agro-ecology came in first with a score of 0.528, followed by Kola agro-ecology with a score of 0.521. Dega agro-ecology, on the other hand, was found to be relatively less vulnerable, with an average score of 0.483.
4.2.3. Sensitivity vulnerability factor
A system’s sensitivity reveals how much it reacts to a given change in the climate. The main indicators of sensitivity factors were health, food, water, and land use and sustainability. Thus, the sensitivity component encompasses the broad category of the biophysical climate change effects. These include adjustments to the natural ecosystem and regulated systems like agriculture (Seneviratne et al., Citation2012). The degree to which agro-ecological systems were sensitive was determined by variations in ecosystem and agricultural characteristics (Nunes, Citation2021). Kola agro-ecology was shown to be substantially more sensitive than W/Dega and Dega, with scores of 0.584, 0.551, and 0.445, respectively.
In conclusion, Kola agro-ecology was highly vulnerable, with scores of 0.584 and 0.586 in both sensitivity and exposure vulnerability factors. W/Dega, on the other hand, has high adaptive capacity factors with an average score of 0.528. Dega agro-ecology has low index values for all three vulnerability factors, sensitivity, exposure, and adaptive capacity, with 0.445, 0.457, and 0.483, respectively. Finally, in light of the three vulnerability factors, the LVI-IPCC score exhibited that Kola agro-ecology was more vulnerable, with a score of 0.04, which was close to 1. Low vulnerability was revealed in the Dega agro-ecology, with a score of −0.011, which was close to −1. W/Dega agro-ecology had an intermediate vulnerability score of 0.007, which was close to zero.
5. Conclusion
Ethiopia, as one of the most vulnerable countries, has experienced enormous climate change concerns. Due to difference in socioeconomic and biophysical parameters, livelihoods across different agro ecologies in Ethiopia, have diverse effects on distinct groups of people at different scales. The country’s inherent vulnerability has fueled a call to action for the adoption of climate change adaption plans. Investigating livelihood vulnerability to changing climatic conditions was therefore crucial for practitioners and policymakers to establish long-term adaptation measures that foster resilience. Thus, the main goal of this study was to estimate farm household livelihood vulnerability to climate change using the LVI and LVI-IPCC techniques in three agro ecological zones of the Wolaita Zone.
The study’s findings concluded that the level of livelihood vulnerability in Kola agro-ecology (Deguna Fango District) was found to be more vulnerable to climate change extremes than those in Dega (Damote Gale District) and Woyna Dega (Damot Woyde District) agro ecologies. Likewise, based on the three vulnerability factors, the LVI-IPCC score revealed that Kola agro-ecology was the most vulnerable, with a score of 0.04, approaching the maximum value of 1. While the Dega agro-ecology exhibited low vulnerability, with a score of −0.011, which is close to −1 and Woyna Dega had a vulnerability score of 0.007, which was close to zero. The index values for each profile and indicator differed evidently across agro ecological zones, offering insight into the design and execution of agro-ecology system-specific adaptation methods for smallholder farmers in the study area.
Policymakers should work with local communities and experts to develop and implement tailored adaptation techniques that are specifically designed to address the unique challenges and vulnerabilities of each agro-ecological zone. Kola agroecology, the most vulnerable of the three agro ecological zones, necessitates the implementation of appropriate adaptation techniques such as conservation agricultural practices, including cover cropping, reduced tillage, and crop rotation, which can be effective in improving resilience in agroecological systems and livelihoods. Dega agro-ecology, on the other hand, necessitates extensive soil and water conservation intervention to lessen farm households’ vulnerability to climate extremes. Another issue that needed to be carefully considered was improving the community-based participatory watershed management plan based on local knowledge and practices. Moreover, policymakers should promote soil and water conservation interventions, such as terracing, bunding, and rainwater harvesting, to reduce farm households’ vulnerability to climate extremes in Dega agroecology. These interventions can help to improve soil quality, increase water availability, and reduce soil erosion. Therefore, it was critical for practitioners and policymakers to investigate livelihood vulnerability to climate change extremes in order to develop sustainable adaptation measures to promote resilience.
Author contribution
DD, planned the study, collected data, analysis and pre-pared the first manuscript. Y.D & S.B participated on conceptualization, data quality check and revised the draft manuscript.
Acknowledgments
The authors acknowledge the anonymous reviewers for insights and useful comments. We particularly thank the respondents who accepted and took their time to share their information.
Disclosure statement
No potential conflict of interest was reported by the author(s).
Data availability statement
The datasets and questioners utilized during and/or analyzed the current investigation are available from the corresponding author upon reasonable request.
Additional information
Funding
Notes on contributors

Daniel Dalle
Daniel Dalle, PhD Research Scholar, Department of RDAE, Wolaita Sodo University, Sodo, Ethiopia
Yisak Gech
Yisak Gecho, Associate Professor (PhD), Department of RDAE, Wolaita Sodo University, Sodo, Ethiopia.
Sisay Belay Bedeke
Sisay Belay Bedeke, Assistant Professor (PhD), Department of RDAE, Wolaita Sodo University, Sodo, Ethiopia.
References
- Abeje, M. T., Tsunekawa, A., Haregeweyn, N., Nigussie, Z., Adgo, E., Ayalew, Z. … Masunaga, T. (2019). Communities’ livelihood vulnerability to climate variability in Ethiopia. Sustainability (Switzerland), 11(22), 6302–23. https://doi.org/10.3390/su11226302
- Aboye, A. B., Kinsella, J., & Leza, T. (2022). Major climatic changes experienced by farm households: Evidence from the lowlands of southern Ethiopia. Advancements in Agricultural Development, 3(1), 87–102. https://doi.org/10.37433/aad.v3i1.163
- Adamseged, M. E., Frija, A., & Thiel, A. (2019). Dynamics of rural livelihoods and rainfall variability in northern Ethiopian highlands. Climate Risk Management, 25(March 2018), 100195. https://doi.org/10.1016/j.crm.2019.100195
- Adger, W. N., Butler, C., & Walker-Springett, K. (2017). Moral reasoning in adaptation to climate change. Environmental Politics, 26(3), 371–390. https://doi.org/10.1080/09644016.2017.1287624
- Adu, D. T., Kuwornu, J. K. M., Anim-Somuah, H., & Sasaki, N. (2018). Application of livelihood vulnerability index in assessing smallholder maize farming households’ vulnerability to climate change in Brong-Ahafo region of Ghana. Kasetsart Journal of Social Sciences, 39(1), 22–32. https://doi.org/10.1016/j.kjss.2017.06.009
- Al, A., Abu, M., Towfiqul, R., Monirul, I. G. M., Erdiaw-Kwasie, M. O., Bhandari, H., & Mallick, J. (2023). Livelihood vulnerability of char land communities to climate change and natural hazards in Bangladesh: An application of livelihood vulnerability index. Natural Hazards, 115(2), 1411–1437. https://doi.org/10.1007/s11069-022-05599-y
- Altieri, M. A., Nicholls, C. I., Henao, A., & Lana, M. A. (2015). Agroecology and the design of climate change-resilient farming systems. Agronomy for Sustainable Development, 35(3), 869–890. https://doi.org/10.1007/s13593-015-0285-2
- Amare, A., & Simane, B. (2017). Determinants of smallholder farmers’ decision to adopt adaptation options to climate change and variability in the Muger sub basin of the Upper Blue Nile basin of Ethiopia. Agriculture & Food Security, 6(1), 1–20. https://doi.org/10.1186/s40066-017-0144-2
- Asfaw, A., Bantider, A., Simane, B., & Hassen, A. (2021). Smallholder farmers’ livelihood vulnerability to climate change-induced hazards: Agroecology-based comparative analysis in Northcentral Ethiopia (woleka sub-basin). Heliyon, 7(4), e06761. https://doi.org/10.1016/j.heliyon.2021.e06761
- Asmamaw, M., Mereta, S. T., Ambelu, A., & Muneepeerakul, R. (2019). Exploring households’ resilience to climate change-induced shocks using climate resilience index in Dinki watershed, central highlands of Ethiopia. PLoS One, 14(7), e0219393. https://doi.org/10.1371/journal.pone.0219393
- Asmamaw, M., Mereta, S. T., Beyene, E. M., & Ambelu, A. (2020). Multidimensional livelihood vulnerability analysis in Dinki watershed, central highlands of Ethiopia. Climate and Development, 12(9), 814–826. https://doi.org/10.1080/17565529.2019.1698405
- Asrat, P., & Simane, B. (2017). Characterizing vulnerability of crop-based rural systems to climate change and variability: Agro-ecology specific empirical evidence from the Dabus watershed, North-West Ethiopia. American Journal of Climate Change, 06(4), 643–667. https://doi.org/10.4236/ajcc.2017.64033
- Babiso, B., Toma, S., & Bajigo, A. (2016). Land use/land cover dynamics and its implication on Sustainable land management in wallecha watershed. Global Journal of Science Frontier Research: H Environment & Earth Science, 16(4). .
- Bedeke, S. B. (2021). When crop producers face dynamic climate risks: Application of multinomial logit Model to explain adaptation process. Research Square, 1–29. https://doi.org/10.21203/rs.3.rs-919298/v1
- Bryman, A. (2004). Qualitative research on leadership: A critical but appreciative review. The Leadership Quarterly, 15(6), 729–769. https://doi.org/10.1016/j.leaqua.2004.09.007
- Can, D. N., Tu, V. H., & Hoanh, C. T. (2013). Application of livelihood vulnerability index to assess risks from flood vulnerability and climate variability -A case study in the Mekong Delta of Vietnam. Journal of Environmental Science and Engineering, 2, 476–486. .
- Daniel, E. (2016). The usefulness of qualitative and quantitative approaches and methods in researching problem-solving ability in Science education curriculum. Journal of Education & Practice, 7(15), 91–100
- Dendir, Z., & Simane, B. (2019). Livelihood vulnerability to climate variability and change in different agroecological zones of Gurage administrative zone, Ethiopia. Progress in Disaster Science, 3, 100035. https://doi.org/10.1016/j.pdisas.2019.100035
- Ebrahim, A. A., Miheretu, B. A., Alemayehu, A., & Shahid, S. (2022). Vulnerability of smallholder farmers to climate variability and change across different agro-ecological zones in Oromo Nationality Administration (ONA), north east Ethiopia. PLoS One, 17(6), 1–19. https://doi.org/10.1371/journal.pone.0268094
- Edamo, M. L., Ukumo, T. Y., Lohani, T. K., Mirani, K. B., & Ayele, M. A. (2022). Flood inundation mapping under climate change scenarios in the boyo watershed of Muluneh Legesse Edamo. Journal of Water and Climate Change, 13(8), 3170–3188. https://doi.org/10.2166/wcc.2022.193
- Eneyew, A., & Bekele, W. (2012). Determinants of livelihood strategies in Wolaita, southern Ethiopia. Agricultural Research and Reviews, 1(5), 153–1161.
- Esayas B., Simane , B., Teferi, E., Ongoma, V., & Tefera, N. (2019). Climate Variability and Farmers’ Perception in Southern Ethiopia. https://doi.org/10.1155/2019/7341465
- Esayas, B., Simane, B., Teferi, E., Ongoma, V., Tefera, N., Koudahe, K., & Ambelu, A. (2018). Temperature and rainfall trends in North Eastern Ethiopia. Advances in Meteorology, 10(2), 1–16. https://doi.org/10.19080/ijesnr.2020.25.556163
- IPCC. (2014). Climate Change 2014: Impacts, Adaptation, and Vulnerability. Part B: Regional Aspects. In Barros, V.R., C. B. Field, D. J. Dokken, M. D. Mastrandrea, K. J. Mach, T. E. Bilir, M. Chatterjee, K. L. Ebi, Y. O. Estrada, R. C. Genova, B. Girma, E. S. Kissel, A. N. Levy, S. MacCracken, P. R. Mastrandrea, & L.L. White (Eds.). Contribution of Working Group II to the Fifth Assessment. Report of the Intergovernmental Panel on Climate Change (p. 688). Cambridge University Press.
- Formetta, G., & Feyen, L. (2019). Empirical evidence of declining global vulnerability to climate-related hazards. Global Environmental Change, 57(May), 101920. https://doi.org/10.1016/j.gloenvcha.2019.05.004
- Gitima, G., Legesse, A., & Biru, D. (2021). Assessing the impacts of climate variability on rural households in agricultural land through the Application of livelihood vulnerability index. Geosfera Indonesia, 6(1), 96. https://doi.org/10.19184/geosi.v6i1.20718
- Gravitiani, E., & Fitriana, S. N., & Suryanto. (2018). Community livelihood vulnerability level in northern and southern coastal area of Java, Indonesia. IOP Conference Series: Earth and Environmental Science, 202(1). https://doi.org/10.1088/1755-1315/202/1/012050
- Hahn, M. B., Riederer, A. M., & Foster, S. O. (2009). The livelihood vulnerability index: A pragmatic approach to assessing risks from climate variability and change-A case study in Mozambique. Global Environmental Change, 19(1), 74–88. https://doi.org/10.1016/j.gloenvcha.2008.11.002
- Harris, I., Osborn, T. J., Jones, P., & Lister, D. (2020). Climate Change Knowledge Portal Report. Scientific Data, 7(1). https://doi.org/10.1038/s41597-020-0453-3
- Hegga, S., Ziervogel, G., Angula, M., Spear, D., Nyamwanza, A., Ndeunyema, E., Kunamwene, I., Togarepi, C., & Morchain, D. (2016). Vulnerability and risk assessment in Omusati region in Namibia : fostering people-centred adaptation to climate change. 1–61.
- Ho, T. D. N., Kuwornu, J. K. M., & Tsusaka, T. W. (2022). Factors influencing smallholder rice farmers ’ vulnerability to climate change and variability in the Mekong Delta region of Vietnam. European Journal of Development Research, 34(1), 272–302. https://doi.org/10.1057/s41287-021-00371-7
- Huong, N. T. L., Yao, S., & Fahad, S. (2019). Assessing household livelihood vulnerability to climate change: The case of Northwest Vietnam. Human and Ecological Risk Assessment, 25(5), 1157–1175. https://doi.org/10.1080/10807039.2018.1460801
- Idrissou, Y., Seidou, A., Nasser, M., Jacob, A., & Alkoiret Traoré, I. (2020, June). Heliyon adaptation strategies of cattle farmers in the dry and sub-humid tropical zones of Benin in the context of climate change. Heliyon, 6(7), e04373. https://doi.org/10.1016/j.heliyon.2020.e04373
- ILO. (2018). The employment impact of climate change adaptation. Input document for the G20 climate sustainability Working group. International Labour Organization. 978-92-2-031115-8.
- IPCC. (2018) . Summary for policymakers. In: Global warming of 1.5°C. An IPCC special report on the impacts of global warming of 1.5°C above pre-industrial levels and related global greenhouse gas emission pathways, in the context of strengthening the global response to. In Press.
- IPCC. (2022). Summary for policymakers: Climate change 2022_ impacts, adaptation and Vulnerability_Working group II contribution to the sixth assessment report of the Intergovernamental Panel on climate change. In Working Group II contribution to the Sixth Assessment Report of the Intergovernamental Panel on Climate Change. https://doi.org/10.1017/9781009325844.Front
- IPCC. (2023). Climate change 2023: Synthesis report, summary for policymakers. In H. Lee & J. Romero (Eds.), Climate Change 2023: Synthesis Report, Summary for Policymakers. IPCC.
- Jufare, A. T. (2008). Livelihood adaptation, risks and vulnerability in rural Wolaita, Ethiopia. [ Philosophiae Doctor (PhD) Thesis] 2008:46.
- Kothari, C. R. (2004).Research Methodology: Methods and Techniques. New Age International (P) Ltd., Publishers. 978-81-224-2488-1.
- Levy, K., M Smith, S., & Carlton, E. J. (2019). Climate change impacts on waterborne diseases: Moving toward. National Library of Medicine, 176(3), 1–19. https://doi.org/10.1007/s40572-018-0199-7.Climate
- Medhin, H., & Mekonnen, A. (2019, June). Green and climate-resilient transformation in Ethiopia. In The oxford handbook of the Ethiopian economy (pp. 287–307). https://doi.org/10.1093/oxfordhb/9780198814986.013.15
- Mekonen, A. A., & Berlie, A. B. (2021). Rural households’ livelihood vulnerability to climate variability and extremes: A livelihood zone-based approach in the Northeastern highlands of Ethiopia. Ecological Processes, 10(55). https://doi.org/10.1186/s13717-021-00313-5
- Mengistu, N. A. (2022). Rural livelihood vulnerabilities, contributing factors and coping strategies in Takusa Woreda, North Western Ethiopia. Cogent Social Sciences, 8(1). https://doi.org/10.1080/23311886.2022.2095746
- Nunes, A. R. (2021). Exploring the interactions between vulnerability, resilience and adaptation to extreme temperatures. Natural Hazards, 109(3), 2261–2293. https://doi.org/10.1007/s11069-021-04919-y
- Okolie, C. C., Danso-Abbeam, G., & Ogundeji, A. A. (2023). Livelihood vulnerability to the changing climate: The experiences of smallholder farming households in the Free State Province, South Africa. Climate Services, 30(March), 100371. https://doi.org/10.1016/j.cliser.2023.100371
- Olango, T. M., Tesfaye, B., Catellani, M., & Pè, M. E. (2014). Indigenous knowledge, use and on-farm management of enset (ensete ventricosum (welw.) Cheesman) diversity in Wolaita, southern Ethiopia. Journal of Ethnobiology and Ethnomedicine, 10(1), 1–18. https://doi.org/10.1186/1746-4269-10-41
- Oo, A. T., Huylenbroeck, G., & Speelman, S. (2018). Assessment of climate change vulnerability of farm households in Pyapon district, a delta region in Myanmar. International Journal of Disaster Risk Reduction, 28(March 2017), 10–21. https://doi.org/10.1016/j.ijdrr.2018.02.012
- Parker, L., Bourgoin, C., Martinez-Valle, A., Läderach, P., & Mushtaq, S. (2019). Vulnerability of the agricultural sector to climate change: The development of a pan-tropical climate risk vulnerability assessment to inform sub-national decision making. PLoS ONE, 14(3), 1–25. https://doi.org/10.1371/journal.pone.0213641
- Paterson, J., Berr, P., Ebi, K., & Varangu, L. (2014). Health care facilities resilient to climate change impacts. International Journal of Environmental Research and Public Health, 11(12), 13097–13116. https://doi.org/10.3390/ijerph111213097
- Rahmato, D. (2007). Development interventions in Wollaita. In A Critical Review. Forum for Social Science (pp. 1060s–2000s). 978-99944-50-13-8.
- Raihan, F., & Hossain, M. M. (2021). Livelihood vulnerability assessments and adaptation strategies to climate change: A case study in tanguar haor, Sylhet. Journal of Water and Climate Change, 12(7), 3448–3463. https://doi.org/10.2166/wcc.2021.047
- Rudiarto, I., & Pamungkas, D. (2020). Spatial exposure and livelihood vulnerability to climate-related disasters in the North Coast of Tegal City, Indonesia. International Review for Spatial Planning and Sustainable Development, 8(3), 34–53. https://doi.org/10.14246/irspsd.8.3_34
- Schattman, R. E., Méndez, V. E., Merrill, S. C., & Zia, A. (2018). Mixed methods approach to understanding farmer and agricultural advisor perceptions of climate change and adaptation in Vermont, United States. Agroecology & Sustainable Food Systems, 42(2), 121–148. https://doi.org/10.1080/21683565.2017.1357667
- Senbeta, A. F. (2009). Climate change impact on livelihood, vulnerability and coping mechanisms: A case study of West-Arsi zone, Ethiopia. Lund University International Master’s Programme in Environmental Studies and Sustainability Science, MSc, 54.
- Seneviratne, S.I., N. Nicholls, D. Easterling, C.M. Goodess, S. Kanae, J. Kossin, Y. Luo, J. Marengo, K. McInnes, M. Rahimi, M. Reichstein, A. Sorteberg, C. Vera, and X. Zhang, (2012). Changes in climate extremes and their impacts on the natural physical environment. In Field, C.B., V. Barros, T.F. Stocker, D. Qin, D.J. Dokken, K.L. Ebi, M.D. Mastrandrea, K.J. Mach, G.-K. Plattner, S.K. Allen, M. Tignor, and P.M. Midgley (Eds.) Managing the Risks of Extreme Events and Disasters to Advance Climate Change Adaptation. A Special Report of Working Groups I and II of the Intergovernmental Panel on Climate (pp. 109–230). Cambridge University Press.
- Shen, J., Duan, W., Wang, Y., & Zhang, Y. (2022). Household livelihood vulnerability to climate change in West China. International Journal of Environmental Research and Public Health, 19(1), 551. https://doi.org/10.3390/ijerph19010551
- Simane, B., Zaitchik, B. F., & Foltz, J. D. (2016). Agroecosystem specific climate vulnerability analysis: Application of the livelihood vulnerability index to a tropical highland region. Mitigation and Adaptation Strategies for Global Change, 21(1), 39–65. https://doi.org/10.1007/s11027-014-9568-1
- Sujakhu, N. M., Ranjitkar, S., He, J., Schmidt-Vogt, D., Su, Y., & Xu, J. (2019). Assessing the livelihood vulnerability of rural indigenous households to climate changes in Central Nepal, Himalaya. Sustainability, 11(10), 2977. https://doi.org/10.3390/su11102977
- Suryanto, S., & Rahman, A. (2019). Application of livelihood vulnerability index to assess risks for farmers in the sukoharjo regency and Klaten regency, Indonesia. Jamba: Journal of Disaster Risk Studies, 11(1), 1–9. https://doi.org/10.4102/jamba.v11i1.739
- Taherdoost, H. (2017). Determining sample size; How to calculate survey sample size. International Journal of Economics and Management Systems, 2(2), 237–239.
- Tessema, I., & Simane, B. (2019). Vulnerability analysis of smallholder farmers to climate variability and change: An agro-ecological system-based approach in the Fincha’a sub-basin of the upper Blue Nile basin of Ethiopia. Ecological Processes, 8(1). https://doi.org/10.1186/s13717-019-0159-7
- Tesso, G., Emana, B., & Ketema, M. (2012). Analysis of vulnerability and resilience to climate change induced shocks in North Shewa, Ethiopia. Agricultural Sciences, 03(6), 871–888. https://doi.org/10.4236/as.2012.36106
- Ukumo, T. J. O. O. A. P. E. Y., Edamo, M. L., Abdi, D. M., & Derebe, M. A. (2022). Evaluating water availability under changing climate scenarios in the woybo catchment. 13(11), 4130–4149. https://doi.org/10.2166/wcc.2022.343
- Venus, T. E., Bilgram, S., Sauer, J., & Khatri-Chettri, A. (2022). Livelihood vulnerability and climate change: A comparative analysis of smallholders in the Indo-Gangetic plains. Environment Development and Sustainability, 24(2), 1981–2009. https://doi.org/10.1007/s10668-021-01516-8
- Wolaita Zone Plan Departement. (2020). Socio-economic data of Wolaita zone.
- Zeleke, T., Beyene, F., Deressa, T., Yousuf, J., & Kebede, T. (2021). Vulnerability of smallholder farmers to climate change-induced shocks in east hararghe zone, ethiopia. Sustainability (Switzerland), 13(4), 1–19. https://doi.org/10.3390/su13042162