?Mathematical formulae have been encoded as MathML and are displayed in this HTML version using MathJax in order to improve their display. Uncheck the box to turn MathJax off. This feature requires Javascript. Click on a formula to zoom.
Abstract
This study provides an understanding of the structure of the frozen chicken market and examines whether the actors of the frozen chicken supply chain are willing to accept locally produced and processed chicken as one of their product lines. It employs primary data collected from 22 importers, 44 wholesalers and 117 retailers in Ghana. Gini Coefficient and Cragg’s Double Hurdle model were the analytical tools. The results revealed Gini coefficients of 0.702, 0.550 and 0.572 for retailers, wholesalers and importers respectively, indicating high concentration levels. Generally, retailers had the highest level of acceptance of domestically produced chicken, followed by wholesalers. As differences in prices increase, distributors are less likely to accept locally produced chicken into their distribution chain. Business experience, form of business, infrastructure for poultry, form of ownership and access to credit were the determinants of distributors’ willingness to accept domestically produced chicken, while educational level, form of ownership and safety influenced the volume distributors are willing to start with. The study therefore recommends that a business person seeking to venture into the domestically produced chicken market must be ready to invest in infrastructure as this will guarantee the impact one is able to make in the chicken industry.
REVIEWING EDITOR:
1. Introduction
The fastest-growing segment of global meat production, trade and consumption is poultry meat, with developing and transitional economies vying for the top spot in the boom (Andam, Arndt, et al., Citation2017). The poultry sub-sector creates jobs, offers revenue to the government and serves as a source of income for farmers (Atkins & Bowler, Citation2016). For instance, in 2008, the total number of workers in commercial poultry production was about 7000, with an estimated 2.5 million people directly or indirectly benefiting from it (Food and Agriculture Organization [FAO], Citation2014). Ghana’s poultry industry can be comprehensively categorized into backyard farms (also referred to unfenced birds) and commercial farms. The backyard farming system is the predominant system in Ghana with poultry assuming a vital part in the occupations of ranchers. As per different assessments, they represent 60–80% of national poultry production (Andam et al., Citation2017; Gyening, Citation2006). Backyard poultry serves as a source of protein and a way of helping to improve and sustain both rural and urban livelihoods (Adams et al., Citation2021; Islam & Jabbar, Citation2003). Commercial poultry production in Ghana can be categorized into large-scale (over 50,000 birds), medium-scale (10,000–50,000 birds) and small-scale (less than 10,000 birds) enterprises and these are generally owned by private individuals or families (Andam et al., Citation2017). Currently, there are 29 large-scale commercial poultry farms in Ghana with 13 located in the Ashanti region, 12 in the Bono East and Ahafo regions as well as 4 in the Greater Accra region. These farms primarily produce eggs and make up over 20% of the entire chicken industry in Ghana (Ghana Poultry Project, Citation2016). Broilers are normally produced to meet demand at festive seasons which include Christmas or Easter when many customers will normally buy live birds. Also, most poultry farmers sell off spent layer chickens during these festive activities. After the festive activities, farmers refocus on egg production.
Due to high cost of production which generally includes costs of feed and medications, the poultry industry in Ghana has recently seen a decline in production which has resulted in lower net returns from the business (Andam et al., Citation2017). Ghana’s Ministry of Food and Agriculture estimates that an average cost of GH₵15($2.7) is incurred by large scale poultry farmers in producing a kilogram of poultry whereas higher rates are incurred by small scale poultry farms (RVO, Citation2020). This has contributed significantly to the exit of numerous poultry firms, particularly the broiler farms (since layer farms are able to sell their eggs to break even), with potential investors progressively becoming unwilling to put resources into the business (Andam et al., Citation2019). According to Kusi et al. (Citation2015), most of the commercial poultry farms that were established around the late 1960s and the early 1970’s have either collapsed or are on the verge of collapsing and operating below capacity.
The aforementioned unfavorable occurrences are the results of a variety of factors including high cost of production which is frequently blamed on the price of feed and other inputs like medication and day-old chicks which are primarily imported (Etuah et al., Citation2020). The substantial importation of chicken meat into the country is another serious issue. Ghana imports poultry from the United States, Brazil and the European Union. The United States supplies over 40% of the market while Europe and Brazil supply 25% each (RVO, 2017). According to United States Department of Agriculture (USDA) (Citation2011, Citation2013), the domestic chicken industry’s challenges have put off potential investors from making investments in the sector, making the domestic poultry sector only supply 10% of Ghana’s total demand for chicken. Following the decline in domestic supplies and rising demand, Ghana imports more chicken. The high imports depreciate the local currency as dollars are needed to import the high volumes of poultry (Donkor et al., Citation2013). It also adds to the unemployment situation of the country since it renders local producers uncompetitive and unable to employ more hands. Due to the high cost of production and high levels of imports into the country, production levels have reduced (FAO, Citation2014). These factors have contributed to imported chicken being cheaper than domestically produced ones as buying locally grown chicken costs 25% more than buying imported ones (Ragasa et al., Citation2020).
The foregoing makes it difficult for consumers of large quantities of chicken such as restaurants and hotels to get their required quantities from local producers, making them resort to imported chicken distributors for the quantities they need. Efforts have been made to reverse the trend and the unfavorable nature of Ghana’s poultry industry. An example is the Ghana Broiler Revitalization Project (GHABROP), a 10-year project initiated by Ghana’s Ministry of Food and Agriculture which aimed to boost local capacity in the production, processing and marketing of broiler chickens. The aim of these efforts was to process locally produced birds into whole dressed birds, cut parts, and other poultry products and make them readily available as those imported (RVO, Citation2014). Despite these efforts, the local poultry sector has still not been able to meet local demand.
Studies by Kwadzo et al. (Citation2013) and Banson et al. (Citation2015) posited that consumers prefer imported broilers to locally produced broilers regardless of the taste. According to these studies, consumers cited price, form of the chicken (chicken cut parts or full chicken) and proximity as the basis of their decision. This means that if locally produced chicken can be presented in a similar form and sold in cuts just like the imported ones at the same cold stores the imported ones are sold, production of local poultry could increase, leading to a revamp of Ghana’s poultry sector. Therefore, one way of progressively making locally produced chicken available to these large quantity chicken consumers is to progressively channel the few locally produced ones through the imported chicken supply chain so that locally produced chicken will also be available through the same channel, which will provide consumers of frozen chicken an alternative, which will further lead to an increase in production and also make the Ghanaian poultry industry competitive. As a result, it is critical to understand the structure of the imported chicken market and to determine whether the actors in the frozen chicken supply chain will accept locally produced poultry as one of their product lines. In achieving the aforementioned objectives, this paper addresses four questions, viz. Q1: what is the structure of the imported chicken market in Ghana? Q2: what factors influence the volume of domestically produced chicken accepted by imported chicken distributers into their supply chains and Q3: what are the perceived opportunities and constraints associated with imported chicken distributors’ acceptance of domestically produced chicken into their supply chains? Most empirical studies on the poultry industry have focused on the nature of the poultry industry as well as the challenges it faces (Amanor-Boadu et al., Citation2016; Hagan, Citation2020; Kusi et al., Citation2015). Other studies also examined the preferences of consumers regarding their choice of chicken (Donkor et al., Citation2013; Opoku-Mensah et al., Citation2014). Market structure looks at the relevance and nature of a market and assesses the market environment of a firm (Mikhalkina et al., Citation2016). This is normally done by looking at the number of buyers and sellers and the extent of their relevance (Bukar et al. Citation2015). This is termed market concentration. The Concentration ratio, Herfindahl index and the Gini coefficient are tools used to assess the concentration of a market (Mikhalkina et al., Citation2016). Market concentration is a very useful measure of market structure as it reveals the degree of power wielded by a particular market. The sales of the market actors is what is normally used in calculating market concentration (Ipek & Ipek, Citation2018). Every firm has a position in a market. A firm with a small share in the market is seen to be under the pressure of competition. On the other hand, a firm that possesses a larger share faces small competition (Yuzaria & Rias, Citation2017).
Approximately 40% of Ghana’s animal protein comes from livestock and poultry, with the remaining 60% coming from fish (Adams et al., Citation2021; Amanor-Boadu et al., Citation2016). Poultry consumption continues to surge in Ghana with an increase in the per capita consumption of poultry and its products moving from 1.7 kilograms per capita in 2000 to 6.1 kilograms per capita in 2017 (OECD‐FAO [Organization for Economic Cooperation and Development and the Food and Agri‐culture Organization of the United Nations], 2017). The demand for poultry is normally at its peak during the Christmas and Muslim festivals (Hagan, Citation2020). The poultry sector of Ghana is of huge importance to the rural and urban communities as well as the Ghanaian economy as a whole. It is a major contributor to the sources of protein (Mottet & Tempio, Citation2017). The poultry sector creates jobs, gives revenue to the central government as well as serves as a key source of income for farmers (Landes et al., Citation2014). The sector has seen a steep decline over the last few years due to the high influx of imported chicken which accounts for about 90% of poultry consumption in Ghana (Kusi et al., Citation2015). Part of the problems faced by the poultry sub-sector can also be attributed to the high cost of production resulting from high costs of poultry feed (FAO, Citation2014). While acknowledging the great findings of the aforementioned studies, they were silent on the structure of the imported chicken market. Moreover, none of them reported whether or not imported chicken distributors were willing to accept domestically produced chicken into their supply chains.
The contributions of the present study are threefold. First, unfortunately, little or no work has been done on the structure of the frozen chicken industry. This study seeks to study the structure of the imported chicken market and the possibility of marketing Ghanaian poultry products through the same chain. Second, it is novel as it adds to the chicken literature by focusing on the distributors of imported chicken, given that most previous studies focused on consumers (Andam et al., Citation2019; Banson et al., Citation2015; Weible & Pelikan, Citation2016). Finally, this study will help poultry producers and processors gain in-depth knowledge of the frozen chicken supply chain and hence strategize to take advantage of opportunities it presents. This will provide poultry producers and processors useful information on alternative market outlets for their products, which might lead to an increase in the quantity of poultry produced and hence more employment and revenue to the state. This study aimed to assess the structure of the imported chicken market and willingness of distributors to accept domestically produced and processed chicken into their supply chains.
2. Materials and methods
2.1. Data
The study was conducted in Ghana, specifically, Kumasi in the Ashanti region and Tema in the Greater Accra region. Kumasi is the second largest city in Ghana with a population of 443,981 (GSS, Citation2021). Tema municipality has a population of 177,924 and it is also known as the ‘Harbour City’ because it houses the largest seaport in Ghana (GSS, 2021). Multistage sampling technique was used to select the respondents for this study. Tema and Kumasi were purposively selected in the first stage. Tema was selected to focus on importers since there is a port located at Tema and most importers are around this area (Andam et al., Citation2017). Kumasi was selected to focus on wholesalers and retailers. Importers in the context of this study are those traders who buy from outside Ghana and transport into the country whereas wholesalers are also those actors who buy from importers in large quantities. Wholesalers generally operate in cold rooms and sell their products in cartons. Retailers are those actors who buy from wholesalers and mostly use refrigerators. Some retailers also sell on tables and normally in kilograms.
Out of 30 importers of chicken, 22 were interviewed as they were considered a census population. This is because the importers are not many and not all of them readily availed themselves for an interview. The Yamane (Citation1967) sample size determination formula was employed to calculate the sample size for wholesalers and retailers. The formula is given as:
(1)
(1)
where
is the desired sample size,
is the finite size of the population,
is the maximum acceptable margin of error as determined by the researcher and 1 is a theoretical or statistical constant. Forty-four wholesalers were randomly selected out of a population of 50 wholesalers obtained from the Asafo Cold Operators Association. Asafo was earmarked for the wholesalers because over 90% of wholesalers in the Kumasi metropolis are located here. One hundred and seventeen retailers were also interviewed. The retailers were sampled from six markets which were purposively selected to include markets in Kumasi and those at the outskirts of Kumasi. This was to factor into the study the differences in prices and other factors that may arise due to distance from the central business area. The markets included Asafo, Suame, Ayigya, Atonsu, Tafo and Santasi markets. Suame, Ayigya, Atonsu, Tafo and Santasi markets were studied as a census since the imported chicken distributors in these markets were not many. According to the Asafo Cold Operators Association, Asafo market has about 80 retailers, out of which 66 were interviewed following the Yamane (Citation1967) sample size determination formula. For the census populations, 15 retailers out of 17 in Suame, 10 out of 12 in Ayigya, 12 out of 12 in Atonsu, 9 out of 11 in Tafo and 5 out of 5 in Santasi markets were interviewed.
The study used a semi-structured questionnaire as the survey instrument with which imported chicken distributors who were categorized into importers, wholesalers and retailers were asked questions in a face-to-face interview. The questionnaire was divided into four sections. The first section included questions on the socioeconomic characteristics of imported chicken distributors. Questions on age, gender, marital status and educational level among others were asked in this section. The second section asked questions on the characteristics of the business. This included the storage capacity, the form of business and the number of years in business. The third section focused on market characteristics of the imported chicken market. Questions in this section included the quantity of imported chicken bought and sold in a week, the sales per week and other costs incurred in acquiring imported chicken. The last section asked questions pertaining to the willingness of distributors of imported chicken to accept locally produced chicken into their supply chains as well as the the volume these distributors are willing to start with. The questionnaire had some open-ended questions regarding the constraints and opportunities within the frozen chicken market. Respondents were asked to enumerate the key constraints they face as well as the opportunities they envisaged. The interview was conducted in the local language (Twi) as this was convenient to most respondents.
2.2. Analytical framework
Both descriptive and inferential statistics were employed to analyze the data from the field survey. The Gini coefficient was used to study the structure of the imported chicken industry. Following Wongnaa et al. (Citation2022), Cragg’s Double Hurdle model was used to analyze the factors influencing the willingness of imported chicken distributors to accept domestically produced and processed chicken as well as the volumes they are willing to start with. Descriptive statistics were used to analyze the constraints and opportunities associated with imported chicken distributors’ acceptance of domestically produced chicken into their supply chains. The constraints and opportunities were analyzed by putting respondents’ views into themes. Descriptive statistics were then used to analyze the various themes.
2.2.1. The Gini coefficient
To measure the market concentration and for that matter market structure, the Lorenz curve and the Gini coefficient were employed. The Lorenz curve is an important tool for the measurement of inequality of a market. It relates the cumulative percentage of sales to the cumulative percentage of distributors. In this study, the Lorenz curve shows the quantitative relationship between the cumulative percentages of imported chicken distributors and the cumulative percentage of the sales per week of imported chicken. To compute the cumulative percentage, the sales per week of the various categories of distributors were arranged from highest to lowest. The most common measure of inequality/equality is the Gini coefficient. The Gini coefficient is a numerical portrayal of the level of imbalance in a population. It ranges between 0 and 1 and is used to decide the level of concentration of actors in the market. It is mathematically expressed as:
(2)
(2)
where
GC = Gini coefficient
= the cumulative proportion of the population variable, for
= the cumulative proportion of the sales variable, for
with
and
= summation sign.
2.2.2. Tobit, Cragg Double Hurdle and Heckman models
There are two decisions distributors of imported chicken make with regards to their acceptance of locally produced chicken. The first is the discrete decision to accept or not to accept locally produced chicken and the second decision is a continuous decision on the extent of acceptance, that is, what percentage of their chicken capacity to accept. It is misleading to estimate the factors that influence the acceptance and the extent of acceptance of domestically produced chicken by imported chicken distributors using the probit and Tobit regression models respectively, without confirming whether or not these models really fit the datasets employed in the study (Amore & Murtinu, Citation2020). Adesina (Citation1996) and Waithaka et al. (Citation2007) posit that the Tobit regression model estimates the determinants of acceptance and the extent of acceptance jointly, which sometimes creates a problem of double counting. This is because both decisions are not necessarily taken together or at the same time.
In order to solve the problem associated with the Tobit regression, a two-step model is used. The two-step models that can be used are Cragg’s double hurdle model and Heckman’s two-step model. These models estimate both the discrete and continuous decisions separately (Bannor et al., Citation2019; Mal et al., Citation2012; Wongnaa et al., Citation2021; Yirga & Hassan, Citation2013). The Heckman’s two-step model however goes a step further to address the problem of selectivity bias by including an exclusivity condition in the first step (Heckman, Citation1979). The decision to accept locally produced chicken by distributors of imported chicken and the extent of acceptance may be jointly or separately taken. In a situation where the decisions are taken separately, the extent of acceptance can be characterized by selectivity bias. A thorough examination is therefore conducted to diagnose the issue of separability and selectivity in the acceptance decision by the imported chicken distributors. A likelihood ratio test is conducted to confirm separability in the decision to accept or not. Probit, Truncated and Tobit models are estimated as shown in EquationEquations (3)(3)
(3) , Equation(4)
(4)
(4) and Equation(5)
(5)
(5) , respectively;
(3)
(3)
(4)
(4)
(5)
(5)
In EquationEquation (3)(3)
(3) , distributors who accept locally produced chicken are identified with
and distributors who do not accept are identified with
. In EquationEquation (3)
(3)
(3) , z is the latent variable for acceptance,
is a set of explanatory variables in the model,
is the set of coefficients of the explanatory variables and
is the error term. In EquationEquation (4)
(4)
(4) ,
is the extent of acceptance, y is the latent variables for the extent of acceptance,
represents the set of coefficients for the explanatory variables and
is the error term. In EquationEquation (5)
(5)
(5) ,
is the error term. The Tobit model combines EquationEquations (3)
(3)
(3) and Equation(4)
(4)
(4) to obtain a joint coefficient, which explains both the acceptance and extent of acceptance (Jagri Binpori et al., Citation2021; Wongnaa et al., Citation2019). The log likelihood ratios of all three aforementioned models (probit, truncated and tobit) are used to compute the likelihood ratio statistic (Nti et al., Citation2020; Wiredu et al., Citation2015) using the formula:
(6)
(6)
In EquationEquation (6)(6)
(6) ,
represents the log likelihoods of the probit, truncated and Tobit regressions. To justify the use of a two-step model, the estimated
from EquationEquation (6)
(6)
(6) should be greater than the chi-square distribution with degrees of freedom equal to the independent variables and the intercept used in the models. The Tobit model however will be used if the estimated
is less than the critical value, as posited by Mal et al. (Citation2012). In a situation where the estimated
is greater than the critical value, Heckman’s two-step model or Cragg’s double hurdle model can be used. As intimated earlier, Heckman’s two-step model further accounts for selectivity bias. The first step of the Heckman model also involves estimation of a probit model, as shown in EquationEquation (3)
(3)
(3) . EquationEquation (7)
(7)
(7) is used to estimate the second stage model of Heckman’s model as follows:
(7)
(7)
where
represents the extent of acceptance of locally produced chicken and
is the error term. The inverse Mills ratio (
), which corrects selectivity bias, is seen on the right-hand side of the second term of EquationEquation (7)
(7)
(7) . If
is significant, then it suggests that the extent of acceptance of locally produced chicken relies on the discrete decision to accept or not (Jagri Binpori et al., Citation2021; Marchenko & Genton, Citation2012). Cragg’s double hurdle model does not consider this condition as it provides a simpler approach when selectivity bias is absent. The second stage of Cragg’s double hurdle model is also a truncated regression without the inverse Mills ratio, as represented in EquationEquation (8)
(8)
(8) .
(8)
(8)
The results of the likelihood ratio test as well as the insignificance of the Mills ratio revealed Cragg’s Double Hurdle model to be the best functional form for the data used in the current study. The empirical models for the study are as follows:
Discrete choice model
Continuous equation
presents the description of the variables used in the Cragg Double Hurdle model.
Table 1. Variables in the double hurdle model.
2.2.3. Thematic Analysis
Respondents were required to enumerate the various constraints and opportunities they envisaged in acceptance of locally produced and processed chicken into their supply chains. The various responses were recorded in spaces provided in the questionnaire. In line with Evans and Lewis (Citation2018), these responses were analyzed by first of all grouping the various responses into same or similar groups. Descriptive statistics was then used to obtain the number of constraints and opportunities each group or thematic area had.
3. Results and Discussion
3.1. Socioeconomic Characteristics of Respondents
To position the study in the right frame, it is imperative to understand the socioeconomic characteristics of imported chicken distributors in the study area. This was done to identify the characteristics that may help to explain the structure of the imported chicken industry and further assess the willingness to accept locally produced chicken in the study area. The characteristics of imported chicken distributors such as sex, age, capacity, years of education, marital status and form of ownership are important in conducting product market acceptance studies (Tackie et al., Citation2015). and present the descriptive statistics on the socioeconomic characteristics of the respondents and their willingness to accept locally produced chicken. It is evident from that females dominate both the retail and wholesale markets of the imported chicken industry. That is, females account for 55.6% of the retail market and 55.85% of the wholesale market. However, the imported chicken market is almost fully dominated by males as they account for 77% of that market. This agrees with Mensah-Bonsu et al. (Citation2019) that reported that the producer level of the value chains is dominated by men, and the trader and processor levels are dominated by women. The retail and wholesale businesses are dominantly sole proprietorships. That is, sole proprietorship accounts for 100% of retail businesses. With the wholesale market, sole proprietorships accounted for 53.5%, partnerships accounted for 34.9% and limited liability companies accounted for 11.6%. The imported market however is dominated by limited liability companies, accounting for 68.2%. This is consistent with Dorathy (Citation2015) who reported that most retail businesses in India are sole proprietorship businesses.
Table 2. Socio-demographic characteristics of respondents (1).
Table 3. Socio-demographic characteristics of respondents (2).
3.2. Structure of the Imported Chicken Market in Ghana
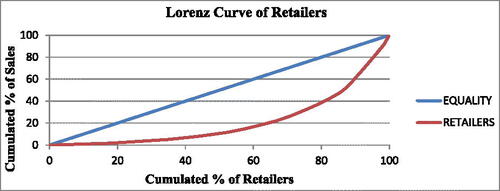
It can be observed from that the Gini coefficient calculated are 0.702, 0.550 and 0.572 for retailers, wholesalers and importers, respectively. The results imply that for the retail market, there is 70.2% inequality, meaning, the market is 70.2% less competitive. In other words, there is a very low level of competition in the retail market. The higher level of concentration in the retail market may be a result of the difference in their storage capacities. Some retailers use refrigerators and the more refrigerators a retailer uses, the likelihood that the retailer will sell more. Furthermore, some retailers sell from tables, which means that they are not likely to buy more cartons because they do not have any place to store the left-over cartons. Iheanacho (Citation2005) posits that differences in investments may also account for this level of concentration, since the levels of sales generally depend on the capacity. Hence, retailers with large investments such as bigger refrigerators, are likely to sell more.
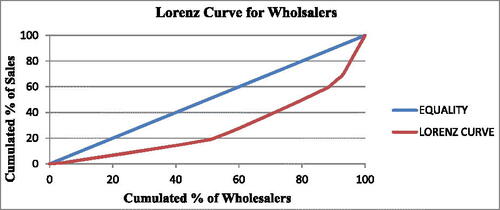
Table 4. Gini coefficient analysis for wholesalers.
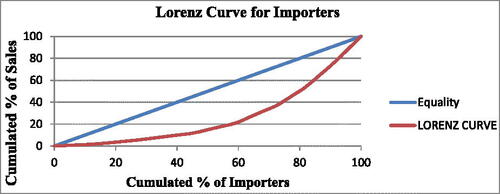
The Gini coefficient of 0.550 for wholesalers indicates an inequality of 55%. That is, the market is 55% less competitive. This means that the wholesale market is controlled by only few wholesalers. This can also be attributed to the capacity of these wholesalers. The imported chicken market also shows an inequality of 57.2%, suggesting the presence of market concentration. Appendices A, B and C present the Lorenz curves for importers, wholesalers and retailers. This means that as the Lorenz curve diverges from the line of equality, there are some levels of inequality or monopoly in the market (Ukav, Citation2017). The farther the Lorenz curve diverges from the line of equality, the lesser the competitiveness of the market.
The results of a Gini coefficient of 0.702, 0.550 and 0.572 for retailers, wholesalers and importers, respectively implies that only a few actors control the sales of the retail, wholesale and import markets. The monopoly within the retail market is relatively high, which implies that the level of entry and exit into the retail market is highly influenced by the levels of investment (Saleh et al., Citation2016).
A Gini coefficient greater than 0.35 shows inequitable sales (Afolabi, Citation2009). The Gini coefficients of the various markets therefore show inequitable distribution in sales as well as inefficiencies within the markets. Bukar et al. (Citation2015) assert that a highly concentrated market indicates an imperfect market as well as a relatively poor marketing performance within the markets. This inefficiency arises as a result of middlemen activities that exploit other actors within the imported chicken supply chain by charging exorbitant prices. The findings of the current study also corroborate the findings of Afolabi (Citation2007) who found a Gini coefficient of 0.87 for the poultry egg market in south-western Nigeria. This indicates an imperfect market for the poultry egg market. In addition, Ayele et al. (Citation2017) also found that the market for beef cattle in the Dugda district of Ethiopia was imperfect. This however contradicts the findings of Yuzaria and Rias (Citation2017) that found the Gini coefficient of beef cattle market in Paya Kumbulu West Sumatara to be less than 0.35, indicating a perfect market. Contrary to our findings, Dodo and Umar (Citation2015) as well as Garbaa et al. (Citation2012) estimated a Gini coefficient of 0.23 for the beef markets of Katsina, Nigeria, indicating a perfect market.
3.3. Willingness to Accept Locally Produced Chickens
This study examined the willingness of imported chicken distributors to accept locally produced chicken into their supply chains. This analysis was done in five levels, viz. whether they are willing to accept at the same price, at 10% higher price, at 25% higher price, at 50% higher price and at a 100% higher price. It can be observed from that, beyond a 10% price difference, distributors are unwilling to accept locally produced chicken into their supply chains.
Table 5. Willingness to accept locally produced chicken.
The results imply that any business or entity that wants to penetrate the imported chicken market with domestically produced chicken will have a high acceptance level if it penetrates the market at the same price as the imported chicken. As the price of the new product becomes higher than the imported ones, the willingness to accept domestically produced chicken dwindles, likewise the volumes to start with. This can be attributed to the attitudes of consumers toward the price of a product. Consumers tend to buy more as prices go down and buy less as prices go up (Naeem, Citation2020). Therefore, imported chicken distributors think that accepting a substitute at a relatively higher price will not sell, hence the low level of willingness to accept and volumes to start with when there is an upward adjustment of the price. The results also show that the best point of penetration is the retailers, followed by the wholesalers. This finding corroborates the findings of Lestari et al. (Citation2016) that reported that 86% of respondents were willing to accept chicken meat from bio-secure farms in Makassar City, South Sulawes Province, Indonesia with the aim of avoiding the spill over of infectious organisms. Our findings are also consistent with those of Ofuoku and Akusu (Citation2016), who found that 50% of consumers within the poultry products industry of Niger Delta, Nigeria were willing to buy value added poultry products at about 25% higher prices. The findings however contradict the findings of Ragasa et al. (Citation2019) that found that only 50% of chicken meat shoppers are willing to pay 10 to 12% higher price for non-certified poultry products as our findings revealed that 89% of imported chicken distributors are willing to accept locally produced chicken at a 10% higher price.
It can also be observed from that as the percentage gap in price increases, the percentage distributors are ready to start with drops. For instance, at a 25% price difference, retailers are willing to start with 19.2% of their poultry capacity, while wholesalers are willing to start with 18.2% as against 22.3% and 21.2%, respectively for a 10% price difference. This implies that distributors will only give up space for locally produced chicken only if the price is favorable. The higher the price, the lesser the willingness of distributors to accept locally produced chicken into their supply chains. Also, for those that will accept the local products, the quantity accepted will decline drastically (Hassen et al., Citation2021).
Table 6. Percentage of poultry capacity distributors are willing to start with.
3.4. Factors influencing willingness to accept and percentage to start with
The results of the factors that determine distributors’ decision to accept domestically produced chicken into their supply chains and their extent of acceptance are presented in and . The results of the test of separability using the likelihood ratio statistic revealed that the calculated test statistic is greater than the chi square critical value at eight degrees of freedom at the 1% significance level. This indicates that the decisions to accept and the extent of acceptance of locally produced and processed chicken occur in two stages, making a two-step model the best fit in determining the factors that influence the acceptance and extent of acceptance (Mal et al., Citation2012; Wongnaa et al., Citation2019). The estimated Mills ratio () from the Heckman’s two-step model is also insignificant, indicating the absence of selectivity bias (). Cragg’s double hurdle model therefore presents a straight forward and simple approach for estimating the factors that determine the acceptance and the extent of acceptance of domestically produced chicken into imported chicken supply chains. Therefore, in what follows, we focus on Cragg’s double hurdle model in presenting and discussing the factors influencing acceptance and extent of acceptance of locally produced chicken into imported chicken supply chains.
Table 7. Factors that determine willingness to accept and extent of acceptance.
Table 8. Factors that determine willingness to accept and extent of acceptance (Heckman model).
The results, as presented in , show that the factors that influence imported chicken distributors’ willingness to accept locally produced chicken are years of business experience, form of business, percentage of infrastructure for poultry products, form of ownership and access to credit. Years of education, form of ownership, safety and access to credit are the factors that influence the percentage distributors are willing to start with. Years of business experience had a negative influence on willingness to accept locally produced chicken by imported chicken distributors and this was statistically significant at the 10% level. This shows that if years of business experience increases, the likelihood to accept locally produced chicken into imported chicken supply chains reduces. This may be due to the fact that as the years of business experience increases most of the distributors are not willing to accept innovations in the industry, probably because, out of experience, they think there is no way local producers and processors of poultry will be able to meet the standards of their foreign counterparts. Form of business was also significant in determining the willingness of imported chicken distributors to accept locally produced chicken into their supply chains. This variable, which is statistically significant at the 1% level, has a negative effect on willingness to accept locally produced chicken. This means that as the form of business moves from retailer to wholesaler, willingness to accept reduces.
Access to credit has a negative effect on the willingness to accept locally produced chicken and this is statistically significant at the 1% level. This means that as access to credit increases, willingness to accept locally produced chicken by imported chicken distributors reduces. On the other hand, access to credit has a positive influence on the percentage to start with and this is statistically significant at the 10% level. This means that distributors are willing to increase the percentage of acceptance if they are able to access credit.
Form of ownership has a positive effect on the percentage to start with and this is statistically significant at the 10% level. This means that as a distributor moves from a sole proprietor to partnership, the percentage to start with increases. This can be explained by the fact that as ownership moves from one person to two or more, risk is diversified, hence the positive relationship with percentage to start with. This finding is consistent with similar findings of Eniola et al. (Citation2018).
Years of education had a negative effect on the percentage to start with and was statistically significant at the 5% level. The negative influence means that the higher the years of education of a distributor, the lesser the percentage that he/she is ready to allocate to locally produced chicken. This could be a result of the fact that due to the educational level of these distributors, they are able to do in-depth analysis of the acceptance of locally produced chickens. According to Jung (Citation2015), education has a positive effect on risk aversion. This means that the higher the person’s level of education, the more risk-averse he/she becomes. This explains why there is an inverse relationship between years of education and percentage to start with. This finding corroborates the findings of Erdem et al. (Citation2010) that found education to be positively significant in determining the willingness to pay for imported products. This study however contradicts the findings of Ofuoku and Akusu (Citation2016) that found level of education not to be significant in determining willingness to pay for value-added poultry products in the Niger Delta Region of Nigeria.
The variable for percentage of infrastructure for poultry products also positively influences the willingness of distributors to accept locally produced chicken and this is statistically significant at the 5% level. This means that as the percentage of available infrastructure for poultry products increases, the probability of distributors accepting locally produced chicken will increase. The variable for distributors’ perception on the safety of accepting local poultry products is significant at the 1% level and positively related to the volume of locally produced birds distributors are willing to start with. The implication is that as distributors feel safe or secured in trading in locally produced poultry products, they will increase the quantity of these products in their supply chains.
3.5. Perceived Opportunities and Constraints following distributors’ Acceptance
The study further examined the perceived opportunities and constraints associated with imported chicken distributors’ acceptance of locally produced and processed chicken into their supply chains. From , there are in all seven perceived opportunities associated with imported chicken distributors’ acceptance of locally produced and processed chicken, with most occurrences being the provision of an alternative to consumers. For some time now, consumers of frozen chicken have been left with the consumption of only imported chicken. Acceptance of the local ones will therefore provide an option to the consumers. Provision of an alternative to consumers accounted for about 38% of the responses. The next highest occurrence is the opportunity of economic benefits to the country. The respondents think that the availability of locally produced frozen chicken will lead to a reduction in the unemployment rate of the country and also add to the revenues of the country through taxes and other levies.
Table 9. Perceived opportunities and constraints of accepting locally produced chicken by actors in the frozen chicken supply chain.
The introduction of locally produced and processed chicken also provides consumers with fresh products. Respondents think that most of the imported products spend a lot of months on the sea, and even when the product arrives, some spend a lot of time at the port, which makes the chicken almost rancid, especially when there are energy crisis and high fuel costs (Mai et al., Citation2022). This therefore gives the local ones an advantage since they are produced in the country. Respondents also perceive that accepting the local frozen chicken will lessen the burden of transport costs. Depending on where these farms and processing centers are located, transport cost can be reduced drastically because distributors will not have to travel all the way to Tema for their stock. A study by Hagan (Citation2020) found transport cost to be one of the challenges of poultry business in Ejisu municipality of Ghana.
Both consumers and distributors of frozen chicken are unable to tell the safety of the imported chicken because there is virtually no way to authenticate the processing of the chicken. Some even hypothesized that imported chickens are injected with some chemicals to increase their size. For instance a respondent said that ‘how can a thigh of an imported chicken be bigger than the full chicken of a local poultry’. Locally produced and processed chicken affords consumers and distributors the opportunity to authenticate the production process. The cost of duty and other related costs will be reduced if not totally eliminated should distributors accept locally produced and processed chicken into their supply chains.
Finally, 7% of the respondents responded that because the poultry will be produced in Ghana and for that matter the absence of port duties and customs, as well as lower transit costs, it will result in relatively lower prices for local chicken. The percentage attributed to this opportunity implies that this opportunity had the least occurrence. This is because the price of locally produced poultry is currently higher than the price of imported chicken, hence this opportunity may be non-existent.
Out of a total of 307 responses on the constraints, 82 of them representing 26.7% are higher prices. The respondents think that the price of locally produced and processed chicken will be higher than that of imported ones. Most of them made this observation after considering the price of a local live bird and that of a processed imported bird. Eighteen percent of the constraints had to do with the size of the meat cuts. Juxtaposing the size of the imported chicken with the local birds, distributors wonder how a local bird can grow that big, hence they think the cuttings of the local chicken will be relatively smaller. About 18% of the constraints given were related to the difficulty in penetrating the Ghanaian market and poor quality of locally processed chicken. Respondents raised concerns about poor defeathering and the processing of already dead carcass. This assertion is supported by Bamfo (Citation2012) as well as Opoku and Akorli (Citation2009) that reported that Ghanaians prefer imported chicken to locally produced ones. Moreover, unreliability of suppliers supplying local chicken further questions the sustainability of local chicken availability. That is, the respondents think that the locally processed chicken supplies may not be reliable. According to the distributors, it may start, but producers may not be able to sustain the quantities. Finally, owing to the nature of the product involved, the paper used in packaging must be able to withstand the cold. Respondents fear that the package containing the chicken may not be able to stand the cold and hence tear off, exposing the chicken. The unreliability of supplies is just a huge challenge distributors envisage.
4. Conclusion and Recommendations
One way of progressively making local chicken available to large quantity chicken consumers is to channel the few local chickens through the imported chicken supply chain so that local chicken will also be available through the same channel, providing an alternative to consumers of imported chicken. It could create demand for locally produced chicken and further lead to increase in its production while creating competitiveness in the market. This study has provided an understanding of the structure of the imported chicken market and examined whether the actors of the frozen chicken supply chain are willing to accept locally produced poultry as one of their product lines. Based on the results of the study, it is concluded that the level of inequality among retailers is higher relative to that of importers and wholesalers. This finding signifies a highly concentrated market for retailers and a weak oligopoly for the wholesale and import markets. Beyond a price difference of 10% (that is, when the price of locally produced poultry is more than 10% higher), distributors are not willing to accept local poultry products into their supply chains. However, at 10% price difference, retailers are willing to start distributing local chicken by devoting 22% of their poultry storage capacity. Similarly, wholesalers are willing to start with 21% of their poultry storage capacity.
Years of business experience, form of business, percentage of infrastructure for poultry products, form of ownership and access to credit were the factors that influenced imported chicken distributors’ willingness to accept locally produced and processed chicken into their supply chains, while years of education, form of ownership and safety, influenced the volume distributors are willing to start with. The major opportunities to the distributors for accepting locally produced and processed chicken included the fact that local chicken was considered an alternative/substitute for imported chicken as well as the economic benefits they stand to gain through reduced transportation costs when they start receiving domestically produced chicken from nearby farms in Ghana.
The study makes the following recommendations. First, the National Association of Poultry Farmers should open negotiations with the leadership of the Cold Operators Association of Ghana to agree on terms for the supply of domestically produced chicken through their imported frozen chicken chains. Second, local poultry farmers who want to market their products through the cold chain should divide the frozen chicken market into segments and target a convenient segment in order to be able to sustain supply to the segment because local farmers may not have the capacity to supply to the bigger market. In addition, a business person seeking to venture into this market must be ready to invest in infrastructure, which will guarantee the impact one is able to make in the frozen chicken market. Finally, investors seeking to go into locally produced and processed chicken production must be ready to peg their price at the level of the price of imported chicken or at worse, 10% higher. This is because supply chain actors are not willing to accept locally produced and processed chicken priced more than 10% the price of imported chicken.
This study, like others, has several limitations. First, as earlier stated, the study was conducted in Ghana with only two regions, taking into account Ghana’s distinct cultural and economic structure. To improve the external validity of the results, replication studies in other regions with distinct social and cultural norms are proposed. A cross-sectional survey was also used to acquire the data. A longitudinal study might be a better approach for getting more objective data, particularly about the structure of the frozen chicken market. A longitudinal data will also help establish the dynamics of the frozen chicken market structure over time. Furthermore, in analyzing the willingness to accept locally produced and processed chicken, the current study only considered the differences in prices. Further studies may consider the size of cuttings and packaging which may provide deeper insights into willingness to accept locally produced and processed chicken by frozen chicken supply chain actors.
Acknowledgment
We are grateful to the Importers and Exporters Association of Ghana as well as all the poultry value chain actors for their participation in responding to the questionnaires. Furthermore, we are grateful to Miss Bernice Frinjuah and Miss Elizabeth Ayamga for their indispensable contributions throughout the data collection process.
Disclosure statement
No potential conflict of interest was reported by the author(s).
Data availability statement
We, the authors of this manuscript, would like to confirm that all raw data will be available with a reasonable request.
Additional information
Funding
Notes on contributors
Isaac Akurugu Apike
Isaac Akurugu Apike holds bachelor’s and Master of Philosophy degrees in Agribusiness Management from Kwame Nkrumah University of Science and Technology. He is Currently a PhD Candidate at the School of Business of Kwame Nkrumah University of Science and Technology. His research interests include food and consumer economics as well as supply chain management in the agri-food system.
James Osei Mensah
James Osei Mensah is an Associate Professor of Agribusiness Management at the Department of Agricultural Economics, Agribusiness & Extension of Kwame Nkrumah University of Science & Technology (KNUST), an Agribusiness Consultant and an Academic Counsellor. He holds a PhD degree in Agribusiness Management from Kwame Nkrumah University of Science & Technology (KNUST). Prof. Osei Mensah has over 13 years of teaching and research experience as an agribusiness management expert with over forty (40) peer-reviewed publications and conference papers to his credit. He teaches both undergraduate and postgraduate courses such as Principles of Agribusiness Management, Management and Entrepreneurial Skills, Research Methods for Agribusiness, Business Communication and Customer Relations, Agribusiness Management and Value Chain Analysis, and Agribusiness Planning and Management and has supervised several undergraduate and postgraduate students.
Robert Aidoo
Robert Aidoo is an Associate Professor at the Department of Agricultural Economics, Agribusiness Extension in the Faculty of Agriculture, KNUST-Kumasi who has conducted various studies in the agricultural/agribusiness sector over the past 20 years and published extensively (about 65 papers) in international peer reviewed journals. He has led different research teams to conduct research for reputable local and international organizations such as UNHCR (Ghana office), International Labour Organization (ILO-Ghana office), World Food Program (WFP-Ghana office), Danida, International Institute of Tropical Agriculture (IITA-Ibadan, Nigeria), USAID ASSESS Project, Adventist Development and Relief Agency (ADRA-Ghana), Overseas Development Institute (ODI-UK), and Ministry of Food and Agriculture-Ghana, among others.
Camillus Abawiera Wongnaa
Camillus Abawiera Wongnaa holds PhD in Agricultural Economics from the Kwame Nkrumah University of Science and Technology (KNUST) and currently a Senior lecturer in the same university. Before joining KNUST in August, 2016, he had worked for five (5) years as a Lecturer and later a Senior Lecturer and a Head of Department of Agropreneurship of Kumasi Technical University, a department he established. Dr. Wongnaa has published 73 peer reviewed journal articles, two book chapters and nine conference papers. Appointed to serve on the Editorial Board of African Journal of Agricultural and Resource Economics (AfJARE) in 2019, he is currently a Co-Editor of the journal. Camillus is also an Associate Editor of the Rural Development Section of Heliyon, an Elsevier Journal. He has consulted for African Development Bank (AfDB), CINOP commissioned by EP-NUFFIC-Hertogenbosch the Netherlands, Winrock International for Agricultural Development, etc.
Gifty Boakye Appiah
Gifty Boakye Appiah is a Lecturer in the department of Agricultural Economics, Agribusiness and Extension in the Kwame Nkrumah University of Science and Technology (KNUST). Her research experience and interests are in the field of agribusiness development and business innovation with special focus on productivity and efficiency along agricultural/food value/supply chains, knowledge transfer and innovation systems as well as value addition and development of novel agricultural products. She obtained a BSc. Degree in Agriculture with Economics option from KNUST and Master’s Degree from the University of Ghana, Legon. She also Pursued a DANIDA funded PhD program at KNUST in collaboration with three Danish Universities (Aalborg University, Denmark Technical University and University of Nordjylland-UCN. She’s a scholar of the Africalics/Globelics/Ike group PhD visiting sandwich/fellowship program in Denmark and also an early career researcher in the Africalics and Globelics Network.
References
- Adams, F., Ohene-Yankyera, K., Aidoo, R., & Wongnaa, C. A. (2021). Economic benefits of livestock management in Ghana. Agricultural and Food Economics, 9(1), 1–17. https://doi.org/10.1186/s40100-021-00191-7
- Adesina, A. A. (1996). Factors affecting the adoption of fertilizers by rice farmers in Cote d’Ivoire. Nutrient Cycling in Agroecosystems, 46(1), 29–39. https://doi.org/10.1007/BF00210222
- Afolabi, J. A. (2007). Evaluation of poultry egg marketing in South-Western Nigeria. International Journal of Poultry Science, 6(5), 362–366. https://doi.org/10.3923/ijps.2007.362.366
- Afolabi, J. A. (2009). An assessment of gari marketing in South-Western Nigeria. Journal of Social Science, 21(1), 33–38.
- Amanor-Boadu, V., Nti, F. K., & Ross, K. (2016). Structure of Ghana’s chicken industry in 2015. Department of Agricultural Economics, Kansas State University.
- Amore, M., & Murtinu, S. (2020). Tobit models in strategy research: Critical issues and applications. Global Strategy Journal, 2019, 1–25.
- Andam, K. S., Arndt, C., & Hartley, F. (2017). Eggs before chickens?: Assessing Africa’s livestock revolution with an example from Ghana (IFPRI Discussion Paper 1687). International Food Policy Research Institute (IFPRI.).
- Andam, K. S., Johnson, M. E., Ragasa, C., Kufoalor, D. S., & Das Gupta, S. (2017). A chicken and maize situation: The poultry feed sector in Ghana (IFPRI Discussion Paper 1601). International Food Policy Research Institute.
- Andam, K. S., Ragasa, C., Asante, S. B., & Amewu, S. (2019). Can Local Products Compete against Imports in West Africa? Supply-and demand-side perspectives on chicken, rice, and tilapia in Accra, Ghana (IFPRI Discussion Paper 1821). International Food Policy Research Institute (IFPRI).
- Atkins, P., & Bowler, I. (2016). Food in society: Economy, culture, geography. Routledge.
- Ayele, S., Zemedu, L., & Gebremdhin, B. (2017). Analysis of market structure, conduct and performance of beef cattle: The case of Dugda District, East Shoa Zone, Oromia Regional State, Ethiopia. Journal of Biology, Agriculture and Healthcare, 7(5), 5–11.
- Bamfo, B. A. (2012). Consumer attitude toward products made in Ghana. Global Journal of Business Research, 6(1), 39–46.
- Bannor, R. K., Oppong-Kyeremeh, H., Atewene, S., & Wongnaa, C. A. (2019). Influence of non-price incentives on the choice of cocoa licensed buying companies by farmers in the Western North of Ghana. Journal of Agribusiness in Developing and Emerging Economies, 9(4), 402–418. https://doi.org/10.1108/JADEE-11-2018-0151
- Banson, K., Muthusamy, G., & Kondo, E. (2015). The import substituted poultry industry; evidence from Ghana. International Journal of Agriculture and Forestry, 5(2), 166–175.
- Bukar, U., Mohammed, D., Wakawa, R., Shettima, B. G., & Muhammad, S. T. (2015). Analysis of market structure, conduct and performance for pepper in Borno State, Nigeria: A review. Journal of Agricultural Economics, Environment and Social Sciences, 1(1), 181–190.
- Dodo, F., & Umar, S. (2015). Analysis of structure, conduct and performance of beef marketing in Katsina, Katsina State. Global Educational Research Journal, 3(11), 370–375.
- Donkor, J., Sarpong, A., Kankam-Kwarteng, C., & Duah, F. A. (2013). Consumer choice analysis of imported and locally produced chicken products: Evidence from Ghana. European Journal of Business and Management, 5(32), 74–83.
- Dorathy, M. B. C. (2015). One person company (OPC) - The new business format for small retailers in India. Management, 20(1), 173–181.
- Eniola, S. O., Iyabo, A. S., & Peter, B. (2018). Entrepreneurship as a business organization: Nigeria perspective. International Journal of Economic Theory and Application, 5(1), 13–21.
- Erdem, C., Senturk, I., & Ozkaya, C. (2010). Determinants of willingness to pay for imported market products in developing countries: The case of Turkey. International Journal of Economic Perspectives, 4(4), 589–600.
- Etuah, S., Ohene-Yankyera, K., Liu, Z., Mensah, J. O., & Lan, J. (2020). Determinants of cost inefficiency in poultry production: Evidence from small-scale broiler farms in the Ashanti region of Ghana. Tropical Animal Health and Production, 52(3), 1149–1159. https://doi.org/10.1007/s11250-019-02115-6
- Evans, C., & Lewis, J. (2018). Analysing semi-structured interviews using thematic analysis: Exploring voluntary civic participation among adults. London: eBook, SAGE Publications Ltd.
- Food and Agriculture Organization. (2014). Poultry sector Ghana, FAO animal production and health livestock country reviews, No.6, Rome. http://www.fao.org/3/a-i3663e.pdf
- Garbaa, N., Saulawab, M. A., Ukashatuc, S., Kyiogwoma, U. B., & Alaa, A. L. (2012). Structure and conduct of beef marketing in Sokoto metropolis, Sokoto state, Nigeria. Scientific Journal of Biological Sciences, 1(3), 81–85.
- Ghana Poultry Project. (2016). Baseline Survey Report. Evaluation Authored by Kwame Nkrumah University of Science and Technology (KNUST), College of Agriculture and Natural Resources (CANR), Department of Agricultural Economics, Agribusiness & Extension. https://pdf.usaid.gov/_docs/PA00XBQ1.pdf (Accessed on 3/11/2022).
- GSS (Ghana Statistical Service). (2021). 2021 Population & housing census: Demographic, social, economic & housing characteristics. Ghana Statistical Service.
- Gyening, K. O. (2006). The future of the poultry industry in Ghana. Ghana Veterinary Medical Association, Accra.
- Hagan, M. A. S. (2020). Challenges of poultry farmers at Ejisu Municipality, Ghana. Asian Journal of Agricultural Extension, Economics & Sociology, 38(1), 63–77. https://doi.org/10.9734/ajaees/2020/v38i130299
- Hassen, T. B., El Bilali, H., Allahyari, M. S., Berjan, S., & Fotina, O. (2021). Food purchase and eating behavior during the COVID-19 pandemic: A cross-sectional survey of Russian adults. Appetite, 165, 105309. https://doi.org/10.1016/j.appet.2021.105309
- Heckman, J. J. (1979). The common structure of statistical models of truncated, sample selection and limited dependent variables and a simple estimator for such models. Annals of Economic and Social Measurement, 5(4), 475–492.
- Iheanacho, A. C. (2005). Structural characteristics and performance of retail marketing of eggs in Maiduguri metropolis of Borno State, Nigeria. Journal of Sustainable Development of Agricultural Environment, 1(1), 70–76.
- Ipek, E., & Ipek, O. (2018). Market structure of the Turkish pharmaceutical industry. Business and Economics Research Journal, 9(3), 449–462. https://doi.org/10.20409/berj.2018.116
- Islam, S. M., & Jabbar, M. A. (2003). Scavenging poultry for poverty alleviation: a review of experiences with a focus on Bangladesh. International Livestock Research Institute, Addis Ababa, Ethiopia.
- Jagri Binpori, R., Awunyo-Vitor, D., & Wongnaa, C. A. (2021). Does contract farming improve rice farmers’ food security? Empirical evidence from Ghana. World Journal of Science, Technology and Sustainable Development, 18(2), 130–149. https://doi.org/10.1108/WJSTSD-11-2020-0091
- Jung, S. (2015). Does education affect risk aversion? Evidence from the British education reform. Applied Economics, 47(28), 2924–2938. https://doi.org/10.1080/00036846.2015.1011313
- Kusi, L. Y., Agbeblewu, S., Anim, K. I., & Nyarku, M. K. (2015). The challenges and prospects of the commercial poultry industry in Ghana: A synthesis of literature. International Journal of Management Sciences, 5(6), 476–489.
- Kwadzo, G. T.-M., Dadzie, F., Osei-Asare, Y. B., & Kuwornu, J. K. M. (2013). Consumer preference for broiler meat in Ghana: A conjoint analysis approach. International Journal of Marketing Studies, 5(2), 66–73. https://doi.org/10.5539/ijms.v5n2p66
- Landes, M., Persand, S., & Dyck, J. (2014). India’s poultry sector: Development and prospects. ERS, USDA, Agricultural and Trade Report WRS-04-03.
- Lestari, S. V., Natsir, A., Karim, H., & Patrick, I. (2016). Factors affecting consumers’ willingness to pay for chicken meat from biosecure farms. International Journal of Economics and Management Engineering, 10(6), 2062–2066.
- Mai, X., Wang, W., Zhang, X., Wang, D., Liu, F., & Sun, Z. (2022). Mathematical modeling of the effects of temperature and modified atmosphere packaging on the growth kinetics of Pseudomonas lundensis and Shewanella putrefaciens in chilled chicken. Foods, 11(18), 2824. https://doi.org/10.3390/foods11182824
- Mal, P., Anik, A. R., Bauer, S., & Schmitz, P. M. (2012). Bt cotton adoption: A double-hurdle approach for North Indian farmers. AgBioForum, 15(3), 294–302.
- Marchenko, Y. V., & Genton, M. G. (2012). A Heckman selection-t model. Journal of the American Statistical Association, 107(497), 304–317. https://doi.org/10.1080/01621459.2012.656011
- Mensah-Bonsu, A., Lartey, N. N., & Kuwornu, J. K. (2019). Gender-segregated analysis of the poultry value chain in Ghana. Gender, Technology and Development, 23(2), 130–164.
- Mikhalkina, E., Maitah, M., & Šrédl, K. (2016). Measuring market structures in the dairy market in the Czech Republic. Asian Social Science, 11(21), 306–315.
- Mottet, A., & Tempio, G. (2017). Global poultry production: Current state and future outlook and challenges. World’s Poultry Science Journal, 73(2), 245–256. https://doi.org/10.1017/S0043933917000071
- Naeem, M. (2020). Understanding the customer psychology of impulse buying during COVID-19 pandemic: Implications for retailers. International Journal of Retail & Distribution Management, 49(3), 377–393. https://doi.org/10.1108/IJRDM-08-2020-0317
- RVO, Netherlands Enterprise Agency. (2014). Analysis poultry sector Ghana: An inquiry of opportunities and challenges. The Embassy of the Kingdom of the Netherlands.
- RVO, Netherlands Enterprise Agency. (2020). Analysis poultry sector Ghana: An inquiry of opportunities and challenges. The Embassy of the Kingdom of the Netherlands.
- Nti, E. K., Wongnaa, C. A., Edusah, N. S. E., Bakang, J. E. A., & Kyei, V. B. (2020). Service constraints and willingness to pay in community-managed water supply services in Ghana. World Journal of Entrepreneurship, Management and Sustainable Development. Advance online publication. https://doi.org/10.1108/WJEMSD-06-2020-0059
- Ofuoku, A. U., & Akusu, M. O. (2016). Preference and willingness of consumers to pay for value-added poultry products in Niger Delta Region of Nigeria. Journal of Northeast Agricultural University (English Edition), 23(4), 82–92. https://doi.org/10.1016/S1006-8104(17)30011-9
- Opoku, R. A., & Akorli, P. A. K. (2009). The preference gap: Ghanaian consumers attitudes toward local and imported products. African Journal of Business Management, 3(8), 350–357.
- Opoku-Mensah, S., Asare-Kyere, L., & Opoku, M. (2014). Analysis of consumption patterns and patronage of ghana grown chicken: Evidence from Accra and Kumasi, Ghana. Asian Journal of Agriculture and Food Science, 3, 234–247.
- Organization for Economic Cooperation and Development and the Food and Agri‐culture Organization of the United Nations. (2017). OECD agriculture statistics (database): OECD‐FAO agricultural outlook (edition 2017). OECD Publishing. https://doi.org/10.1787/d9e81f72-en
- Ragasa, C., Andam, K. S., Amewu, S., & Asante, S. (2019). Consumer demand and willingness to pay for safe food in Accra, Ghana: Implications for public and private sectors’ roles in food safety management (IFPRI Discussion Paper 1795). IFPRI.
- Ragasa, C., Andam, K. S., Asante, S. B., & Amewu, S. (2020). Can local products compete against imports in West Africa? Supply-and demand-side perspectives on chicken, rice, and tilapia in Ghana. Global Food Security, 26, 100448. https://doi.org/10.1016/j.gfs.2020.100448
- Saleh, A., Ochi, J. E., & Sani, M. H. (2016). Efficiency measurement of modern groundnut oil processing of RMP-12 and ex-dakar varieties in Gombe Metropolis Gombe State, Nigeria. Journal of Behavioural Economics, Finance, Entrepreneurship, Accounting and Transport, 4(3), 71–80.
- Tackie, O. N., Bartlet, R. J., & Adu-Gyamfi, A. (2015). The impact of socioeconomic factors and meat attributes on willingness to pay for locally or regionally produced livestock products in Alabama. Journal of Economics and Sustainable Development, 6(12), 140–153.
- Ukav, I. (2017). Market structures and concentration measuring techniques. Asian Journal of Agricultural Extension, Economics & Sociology, 19(4), 1–16. https://doi.org/10.9734/AJAEES/2017/36066
- United States Department of Agriculture. (2011). Foreign agricultural service, Ghana poultry and products brief annual (Gain Report Number: GH8007).
- United States Department of Agriculture. (2013). Foreign agricultural service, Ghana poultry and products annual (Gain Report Number: 1304).
- Waithaka, M. M., Thornton, P. K., Shepherd, K. D., & Ndiwa, N. N. (2007). Factors affecting the use of fertilizers and manure by smallholders: The case of Vihiga, western Kenya. Nutrient Cycling in Agroecosystems, 78(3), 211–224. https://doi.org/10.1007/s10705-006-9087-x
- Weible, D., & Pelikan, J. (2016 Imported chicken meat in Ghana: A threat for domestic producers and a blessing for consumers? [Paper presentation]. 19th Annual Conference on Global Economic Analysis, Washington, DC, USA.
- Wiredu, A. N., Zeller, M., & Diagne, A. (2015). What determines adoption of fertilizers among rice - Producing households in Northern Ghana? Quarterly Journal of International Agriculture, 54(3), 263–283.
- Wongnaa, C. A., Adams, F., Bannor, R. K., Awunyo-Vitor, D., Mahama, I., Osei, B. A., Owusu-Ansah, Y., & Ackon, A. (2019). Job creation and improved consumer health through commercialisation of tiger nut yoghurt: A willingness to pay analysis. Journal of Global Entrepreneurship Research, 9(1), 4. https://doi.org/10.1186/s40497-018-0139-x
- Wongnaa, C. A., Kyei, A. B., Apike, I. A., Awunyo-Vitor, D., & Dziwornu, R. K. (2021). Perception and adoption of artificial pollination technology in cocoa production: Evidence from Ghana. African Journal of Science, Technology, Innovation and Development, 14(6), 1642–1654.
- Wongnaa, C. A., Jelilu, F., Apike, I. A., Djokoto, J. G., & Awunyo-Vitor, D. (2022). Effect of hybrid cocoa seedlings adoption on profit efficiency in Ghana. Sustainable Futures, 4, 100074. https://doi.org/10.1016/j.sftr.2022.100074
- Yamane, T. (1967). Statistics: An introductory analysis (2nd ed.). Harper and Row.
- Yirga, C., & Hassan, R. M. (2013). Determinants of inorganic fertiliser use in the mixed crop-livestock farming systems of Central Highlands of Ethiopia. African Crop Science Journal, 21(3), 669–668.
- Yuzaria, D., & Rias, I. M. (2017). Market structure of beef cattle business in Payakumbuh West Sumatera. Journal of Advanced Agricultural Technologies, 4(4), 324–330. https://doi.org/10.18178/joaat.4.4.324-330
Appendices
Appendix A
Figure A1. Lorenz curve for importers.
Appendix B
Figure B1. Lorenz curve for wholesalers.
Appendix C
Figure C1. Lorenz curve for retailers.