
 ?Mathematical formulae have been encoded as MathML and are displayed in this HTML version using MathJax in order to improve their display. Uncheck the box to turn MathJax off. This feature requires Javascript. Click on a formula to zoom.
Abstract
Dairy production is one of the risky businesses, which seeks effective risk management strategies. Adoption of a livestock insurance scheme is one of the most effective risk management strategies for dairy entrepreneurs. However, in Nepal, insurance coverage is very low in the dairy sub-sector. The study aimed to assess the dairy farmer’s willingness to pay for the livestock insurance scheme. The study was carried out in Kavrepalanchowk district of Nepal in 2022. The simple random sampling technique was used to select 146 dairy farmers. Double Bounded Dichotomous Choice Contingent Valuation technique was used to estimate Willingness to Pay (WTP). About 93% of the respondent farmers were the member of cooperatives which was the major source of information flow for livestock insurance scheme to them. The result revealed that number of cattle reared, awareness about livestock insurance scheme, and experience of livestock loss have significant positive influences in the decision regarding the adoption of livestock insurance. Farmers are willing to pay more than the current premium rate for livestock insurance. Hence, only increasing the subsidy might not be the solution in expanding the livestock insurance adoption rate. Rather, alternative approach like mobilizing institutions (cooperative) in expanding the insurance scheme is required.
REVIEWING EDITOR:
1. Introduction
Livestock is an important sector for sustained livelihoods of small holder farmers in Nepal. The livestock sector contributes 13% to national Gross Domestic Product (GDP) and 27% to national Agriculture Gross Domestic Product (AGDP) (MoALD, Citation2021a). Indeed, the dairy sub-sector is important which shares 2/3rd of livestock sector (NDDB, Citation2021). Dairy is the prominent sub-sector which contributes to maintain food and nutritional security, generates rural employment and ensure flow of money from urban to rural areas (NDDB, Citation2021). Nepal contributes 0.24% to the world’s milk production (Singh et al., Citation2020). The annual milk production of Nepal is 2 million MT however, 0.5 million MT is still in deficit (NCRP, Citation2021). Cattle and Buffalo are the major dairy animals for milk production in Nepal (Bastola et al., Citation2020; NDDB, Citation2021; Sharma, Citation2017). Though it is an integral part of Nepalese economy, limited access to livestock health, advisory and veterinary services make the livestock business more risky (Adhikari & Bidari, Citation2018). More of livestock risks is associated with diseases and increasing mortality rate of cattle and buffalo have increased the vulnerability of livestock farmers (Devkota et al., Citation2021). Livestock insurance is considered as one of the effective techniques for risk management (Adhikari & Bidari, Citation2018; Devkota et al., Citation2021; Ghimire et al., Citation2016; Kandel & Timalsina, Citation2018; Nepali, Citation2021).
In Nepal though the agricultural insurance started seven decades ago (Jha & Singh, Citation2021), Nepal government formally started agricultural insurance as a separate policy with the promulgation of ‘Crop and Livestock Insurance Directives’ since 2013 (Sapkota, Citation2021). Currently the ‘Crop and Livestock Insurance Directives 2013’ is replaced by the ‘Agriculture, Livestock and Medicinal Herb Insurance Directives 2022’ (NIA, Citation2022). This directive has insured that all farmers of each geographical location have access to agriculture and livestock insurance. Hence Insurance Regulatory Authority of Nepal has assigned different district of each geographical location to each non-life insurance company. Currently 14 life insurance, 14 non-life insurance and 2 re-insurance companies and 7 micro-insurance companies are providing insurance service in Nepal (NIA, Citation2023). Livestock insuring farmer has to pay 5% premium of the total sum assured. However the government pays 80% of the premium charge that farmer has to pay. Hence farmer has to actually pay only 20% of the total premium that the insurance company charges for insuring a dairy animal. The insurance have to be renewed annually. Local or improved breed of cow of age 2-10 years is eligible for doing insurance. Similarly, in case of buffalo it should have the age criteria of 3-12 years (NIA, Citationn.d.). In the FY 2019/20 the premium collection for livestock insurance (92.04%) was higher than the crop insurance (7.95%) (NIA, Citation2021a).
The dairy livestock population of the Kavrepalanchowk district in the FY 2019/20 (cattle -146,555 and buffalo - 146,285) constitutes around 12.50% and 8.90% of total cattle and buffalo population of the country respectively (MoALD, Citation2021b). Kavrepalanchowk district alone contributes 4.46% of total milk production in the country (MoALD, Citation2021b). More than 60% of total milk supplied in Kathmandu Valley is from Kavrepalanchowk district (Thapa et al., Citation2020). Milk produced in Kavrepalanchowk district is sold to dairy processing centers in higher price comparative to other districts (maximum NPRFootnote1 60.78/ltr in Kavrepalanchowk and minimum NPR 49.59/ltr in Morang) (NDDB, Citation2021). Being near the largest market of milk in the country (Kathmandu), it carries huge potential of dairy enterprise.
Despite the government subsidies, the penetration of agriculture insurance is lower than other non-life insurance portfolios (MEFIN, Citation2020). The insurance products currently available in the market are based on feasibility study that only address supply side issue (Sapkota, Citation2021). Many authors have studied about the perception, status and factors influencing adoption of livestock insurance in Nepal (Devkota et al., Citation2021; Jha & Singh, Citation2021; Kandel & Timalsina, Citation2018; Subedi & Kattel, Citation2021) and WTP for crop insurance (Budhathoki et al., Citation2019; Dahal et al., Citation2021; Guo & Bohara, Citation2015; Panta et al., Citation2019; Sapkota, Citation2021). However, very few studies have been made on WTP for livestock insurance in Nepal (Devkota et al., Citation2021). Hence the study is an effort to estimate the willingness to pay for livestock insurance and to comprehend whether the premium price is the main reason for low adoption of livestock insurance or not.
Though in comparison to crop insurance livestock insurance has taken more limelight, there is still much more space to fill by insurance. Only 129001 insurance policy for agricultural insurance was sold in the FY 2019/20 though the population of dairy livestock in the FY 2019/20 was more than 10 million (NIA, Citation2021b). Livestock insurance coverage is low with respect to total national herd number (Devkota et al., Citation2021; Kandel & Timalsina, Citation2018).
Many studies carried out in Nepal on livestock insurance has addressed that the reason behind low coverage was the complex claiming procedure and low awareness of the insurance scheme among farmers (Ghimire et al., Citation2016; Kandel & Timalsina, Citation2018; Nepali, Citation2021). Not much of the literature has addressed the issue of premium price as the major reason for not adopting the livestock insurance. Still the government is continuously increasing the subsidy rate in the premium price as a strategy to stimulate the participation of farmers in the insurance program. To stimulate farmers; the government subsidizes 75% of the premium, an increase from 50% in 2014 (MEFIN, Citation2020) and currently 80% of the premium (Poudel, Citation2021). The Government of Nepal pays near a billion NPR as a grant to meet 75% subsidy which might have become larger with the increase in subsidy. This huge amount of money is invested by the government to expand the insurance however the adoption rate is low. So, Can we blame cost of premium as an issue of low adoption of livestock insurance? Is the government’s strategy to prioritize subsidy to increase livestock insurance adoption rate a good move? Thus the study aimed to reveal the Willingness to Pay (WTP) for livestock insurance in Kavrepalanchowk district, Nepal.
2. Materials and methods
2.1. Study area and sampling procedure
The study was conducted in Kavrepalanchowk district which lies in the mid-hill of Nepal. The district was purposively selected because the district has huge potential for dairy animal production. Simple random sampling technique was followed to select the farms for household survey. In total 146 dairy farming household were surveyed. The primary data were collected through household survey (146 dairy farmers) using semi-structured questionnaire, Focus Group Discussion (1) and Key Informant Interview (10). The data on bid value were collected with the use of DBDC question format. Initial bid was designed based on Key Informant Interview (KII) with insurance agent of the study area and preliminary survey where respondent were asked to elicit WTP using open elicitation technique.
Based on this the lower bid and higher bid value was set. The set bid value ranged from 50% subsidy to 80% subsidy. Lower value was set to 50% because on KII with insurance agent every interviewed insurance agent mentioned that non-commercial dairy farmers would not do insurance below 50%. Other alternative choices were made within this range. In total three different sets of bid value were designed. The three set that were designed were higher bid (2500, 2250, 2000), medium bid (2000, 1850, 1500) and lower (1500, 1250, 1000) expressed in NPR. Three different set of bid were designed to reduce the starting point bias. Bid sets were randomly allocated to the respondent by the use of color card. Respondents were asked to choose the color. Based on chosen color, respondent were asked their WTP for selected bid set. The set of bid needs to be randomly assigned to the respondent (Igarashi et al., Citation2019). Igarashi et al. (Citation2019) in his study used 5 different set of bid value and asked the respondent to randomly choose one set.
2.2. Analytical method
Data were analyzed using descriptive statistics like frequency, mean, percentage, and inferential statistics like logit model and biprobit model. The data were analyzed using MS-Excel, Stata and R- studio software.
2.2.1. Contingent valuation
To assess livestock farmer’s WTP, the Double Bounded Dichotomous Choice approach was used. It is one of the elicitation techniques of contingent valuation. The concept of CV was first developed by Ciriacy Wantrup in 1947 and it was first applied in 1963 to value the outdoor creation by Davis (OECD, Citation2018). Its use got highlighted when the US based National Oceanic and Atmospheric Administration (NOAA) used it for damage assessment made by Exxon Valdez oil spill in Alaska in 1989 (Arrow et al., Citation1993). CV has then been used by many environmental economists and being routinely applied in policy making despite several controversial statement overs its ability to make accurate estimation.
Dichotomous choice CV approach was the most popular approach among other CV method (Tian et al., Citation2011; Kerr, Citation2000). The guidelines for CV method provided by NOAA is seen as a milestone that has guided practice in the field for many years (Sajise et al., Citation2021). As per the guideline provided by NOAA blue river panel (Arrow et al., Citation1993), open ended questions keep the respondent in difficult situation, bidding game creates the anchoring and other form of bias and hence recommend dichotomous question as a desirable form of CV elicitation. Similarly Bateman et al. (Citation2002) as cited in OECD (Citation2018) also recommended dichotomous choice approach for CV. Dichotomous choice is found to require more sample size than open ended questions due to limited information available from dichotomous question from the respondent (Calia & Strazzera, Citation1999). Dichotomous choice questions also works better than the bidding game format (Freeman et al., Citation2014). Since only yes or no answer is required in dichotomous elicitation format, decision making is simple for the individual which may result in little or no non-response bias (Freeman et al., Citation2014). However within dichotomous format Single Bounded Dichotomous Choice (SBDC) requires more sample size than the DBDC format because almost twice as many bids are elicited per respondent (Sajise et al., Citation2021). Inadequate response of expressed WTP is often cited as a reason of rejection of stated preference valuation technique (Diamond & Hausman, Citation1994). DBDC requires less sample size because number of bid used in DBDC is twice of SBDC. Several other study estimated WTP using DBDC CV survey method (Abdullah & Jeanty, Citation2011; Amiry et al., Citation2009; Bradford et al., Citation2004; Jinsoo & Jihyo, Citation2015; Khan et al., Citation2014; Kim et al., Citation2012; Song et al., Citation2019).
The DBDC model is based on random utility model. A rational farmer will be willing to pay for insurance product if he values the livestock insurance scheme and no if he does not values it. If the individual answers ‘yes’ to the first question, then he is asked about his WTP for a higher bid. If he answers ‘no’ to the first question, then he is offered a lower bid. Depending on the response of the first question, second question is designed. This represents the true utility function of the respondent. The parameters for estimating WTP can be found by placing the utility difference equation in a probabilistic framework. By expressing the utility difference function in probabilistic framework, logit regression model can be used to estimate the parameter. The following model is designed based on the formula given by Aizaki et al. (Citation2014).
Let the dairy farmer’s utility status is U0 initially and after buying insurance product his utility will be U1. It is assumed that change from U0 to U1 increases the level of utility of the farmer.
Suppose the farmer n derives the utility Uin by selecting an alternative i from the set of choices. In our case, the farmer n was faced with two alternative choices (binary choice). Hence, he derives utility U1n by agreeing to buy insurance and U0n by not agreeing to buy insurance.
The dairy farmer’s utility will be given by;
U1n = (1, Vn, Sn) if the farmer agrees to pay for livestock insurance scheme
U0n = (0, Vn, Sn) if the farmer does not agree to pay for livestock insurance scheme
where Vn is the income of the respondent and Sn is the other observable attributes of the farmer which might affect his preferences.
Hence, the utility function U0n and U1n can be formulated as
(1)
(1)
(2)
(2)
where V0n and V1n are systematic (deterministic) components and e0n and e1n are the farmer’s random components.
The dairy farmer would agree on the amount or presented bid (A) to buy the livestock insurance if,
(3)
(3)
Then the probability that the respondent accepts the proposed bid A is given by
where F(A) is the cumulative probability distribution function. In DBDC elicitation technique, four different responses are gained that is ‘yes, yes’, ‘yes, no’, ‘no, yes’ and ‘no, no’. For respondent i, the probability of each response is defined as
where AiU is the initial bid, AiL is the higher follow up bid and AiU is lower follow up bid.
Given a sample of N respondent, the log likelihood function of the given model is defined as
where ,
,
, and
are binary-valued indicator variables. We assumed a logistic distribution of F(A) which is expressed as
Median = here,
are parameters of F(A)
2.2.2. Factors influencing adoption of livestock insurance scheme
In order to know the factors affecting adoption of livestock insurance scheme, logit model and probit model can be used. However in this study logit model was used. Logit model is found to better predict the outcome than the probit model in most of the situation (Jose et al., Citation2020). When the dependent variable is dichotomous, the model that are often used to predict the probability of adoption are logit and probit (Mohammed & Ortmann, Citation2005). Both models provide equally efficient parameters (Demaris, Citation1992).
The logit model is mathematically expressed as:
where Pi = probability of adoption of livestock insurance, 1-Pi = probability of not adopting livestock insurance, β0 = intercept, βi = Regression coefficients, Xi = explanatory variables ei = Error term.
Different variables included in the logit and biprobit table are presented in the table () with their expected positive or negative relationship with the adoption of livestock insurance and WTP for livestock insurance. And the detail review of each factors is discussed herewith.
Table 1. Description of variables used in logit model.
Age of household head: The probability of adopting the livestock insurance decreases as the age of household increases (Chand et al., Citation2016; Mohammed & Ortmann, Citation2005). In the study made by Subedi & Kattel (Citation2021), the average of the respondents who were adopting the insurance had lower age than then the one who were not adopting the insurance. Similar findings were made by (Mwangi & Kariuki, Citation2015; Singh & Hlophe, Citation2017; Swain & Hembram, Citation2020) but in contrary the findings of Kumari et al. (Citation2017) and Devkota et al. (Citation2021) where the age of household didn’t impact the adoption of insurance.
Level of education: Education may increase the understanding of the risk and its impact (Mohammed & Ortmann, Citation2005). Hence, higher the level of education, higher the probability of adopting the insurance (Santirongyuth, Citation2018). Kumar et al. (Citationn.d.) in his study revealed that there was positive correlation between level of education and adoption of livestock insurance. Singh and Chandel (Citation2019) in their study found that the mean value of education was higher for the insurance adopter than the non-adopter. Kumari et al. (Citation2017) in their study found that level of education was the positive discriminator in the adoption of livestock insurance. Chand et al. (Citation2016) in his study found that level of education has positive significant relation in adoption of livestock insurance. However the findings of Singh and Hlophe (Citation2017) and Swain and Hembram (Citation2020) found the negative association between level of education and adoption of livestock insurance.
Family size: Larger the size of family higher the probability to adopt the insurance (Shirley, Citation2020). Asamoah (Citation2019) in his study found that famer with the larger family size is more willing to pay for cattle insurance. Kwadz et al. (Citation2013) found the significant positive relation of family size with the WTP for crop insurance in Ghana. In all these findings larger family size was defined as the larger number of dependents in the family. Higher number of active member in the farm families could provide proper time and a greater share of ideas to deal with risk related to cattle and thus lesser requirement of several risk management tools (Subedi & Kattel, Citation2021). Hence higher number of active population implies lower adoption of insurance.
Total owned land: Farm size play the important role in adoption of new technology (Mwangi & Kariuki, Citation2015). Larger the farm size, higher the probability of adopting the insurance (Mohammed & Ortmann, Citation2005). Many study have reported positive relationship between farm size and adoption (Singh & Hlophe, Citation2017). Singh and Chandel (Citation2019) found the mean value of farm size was higher of the insurance adopter than the non-adopter. However the study made by Kumari et al. (Citation2017) didn’t find any variation in land holding between insurance adopter and non-adopter.
Buffaloes number and cattle number: In Nepal, cattle farmer are more likely to adopt insurance than buffaloes farmer as buffaloes can be easily sold in the market for meat purpose but cattle cannot be. Subedi & Kattel (Citation2021) found the significant positive relationship between cattle number and adoption of livestock insurance.
Experience of loss of livestock: Accumulation of previous experiences induces the farmer to adopt the new technology (Feder & Slade, Citation1984). Aditya et al. (Citation2018); Baumann & Sims (Citation1978) found the positive and significant relationship between loss experience and adoption of insurance. However in the study made by Devkota et al. (Citation2021) and Subedi and Kattel (Citation2021), loss experience was not found significantly impacting the adoption of livestock insurance.
Member of cooperative: Cooperative is the major source of information flow of cooperative and most trusted organization by the farmer (Devkota et al., Citation2021). The probability of adoption of livestock insurance was found increasing with the involvement of farmers in cooperatives (Subedi & Kattel, Citation2021).
Aware of livestock insurance: With the increase in awareness of livestock insurance, the probability of adopting the insurance increases (Aditya et al., Citation2018; Aina & Omonona, Citation2012; Singh & Hlophe, Citation2017). Similar result was found by Devkota et al. (Citation2021) and Kandel and Timalsina (Citation2018) where awareness about livestock insurance was positively associated and significant at 99% confidence level. Mohammed and Ortmann (Citation2005) also found significant relationship between adoption of livestock insurance and awareness of livestock insurance. Kumari et al. (Citation2017) found that awareness among farmer on insurance was a positive discriminator of adoption of livestock insurance.
3. Results and discussion
3.1. Socio-demographic status of the farmers
Respondents had an average age of 49.83 years i.e they falls on middle age groups (). Middle aged farmers are found more to adopt the insurance than the old age farmer (Nepali, Citation2021). Family of the respondent had more of economically active member and less number of economically inactive member. Lesser number of economically active members is more likely to adopt the insurance (Kwadz et al., Citation2013).
Table 2. Socio-demographic characteristics of the respondents in the study area.
Average year of schooling of the respondents was 5.82 years. Years of schooling positively influence adoption of technology (Riddell & Song, Citation2012). The average land holding per family in the study site was 0.46 ha which is very less as compared to average national land holding that is 0.68 ha per family (CBS, Citation2013 as cited in Timilsina et al., Citation2019). Less land holding implies that there will be lesser area for the farmers to grow fodder and forage for the animal and have to depend on external source for feed management.
3.2. Livestock farming characteristics
The average number of buffalo per family was 1.26 and that of cattle was 1.11 representing the higher proportion of buffalo farming in the study area (). Majority of dairy animal raised were of 2-12 years age which is the age limit for the dairy animal to get the insurance policy. The price of milk was NPR 14.04 which differed in different study sites based on distance from the main market. Main market of milk for Kavrepalanchowk district is Kathmandu and Banepa. Nearer market had higher milk price per fat (NPR 14.4) and farther market had lower price per fat (NPR 13).
Table 3. Livestock farming characteristics of the respondent farm.
3.3. Reason of livestock death
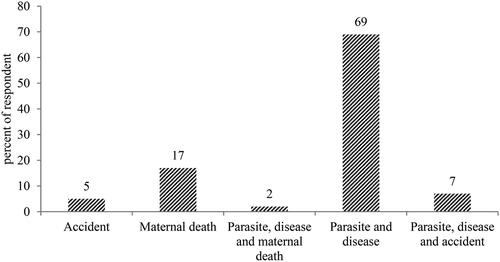
The major reasons of dairy animal death in the study were diseases, parasites, accidents and maternal death (). About 62% of the respondent reported that they had experience loss of livestock death. The major risk of livestock death faced by farmer was diseases and parasites which was 69% of total death revealed in the survey. About 17% of the total death reported in the study was due to maternal death followed by accident (5%). Frequent occurrence of disease was identified as a major problem in livestock farming in the study made by Nepali (Citation2021) that was carried out in Surkhet. Similarly Ghimire et al. (Citation2016) also concluded diseases and parasites as the major problem of livestock farmers.
Figure 1. Reason of dairy animal death of the respondent household.
3.4. Farmer’s access to service providing institution
The findings of access to service providing institution () showed that 100% of the respondent had access to financial institution. Respondent were also asked if they were member of any cooperatives. 93% of the respondent said that they were involved in cooperatives and 7% were not the member of cooperatives. These 7% told that they didn’t have much savings to save in cooperatives, so they were not the member of cooperatives. On asking about the access to livestock related training in the study area, 82% of the respondent said that they didn’t get any sort of livestock related training.
Table 4. Access to service providing institution to the respondent farm.
3.5. Adoption of livestock insurance scheme
Of total respondent, 26% were not aware about the full scheme of the insurance while 74% were aware of the livestock insurance scheme (). This might be due to difference in active mobilization of cooperatives in disseminating the information about insurance in different wards of local government. In some wards, cooperative were found actively working for disseminating the information about insurance while in some wards cooperatives were not found actively working for the dissemination of information about insurance. More than half of the respondents (61%) had adopted the livestock insurance scheme. Only 39% of the total respondents were not adopting the insurance. This reveals that only 13% of the respondent didn’t adopt the insurance though they were aware about it. When the livestock insurance non-adopters were informed about the current requirements and benefits of the insurance, 88% of the non-adopters revealed their willingness to join (WTJ) for the insurance and only 12% didn’t show their WTJ. This shows the high willingness to join the livestock insurance by the respondent. Lack of awareness about the full scheme of the insurance has hindered the adoption of livestock insurance.
Table 5. Adoption of livestock insurance scheme by dairy farmer in the study area.
Respondent were asked about the unattractive features of livestock insurance scheme. The result (). revealed that claiming procedure (44%) was lengthy and complex and was one of the most unattractive features. Similar finding was reported by Kandel and Timalsina (Citation2018) and Jha & Singh (Citation2021) which revealed that farmer were dissatisfied with the claim settlement and time taken to settle the claim. A study made in India found that the major constraint in opting livestock insurance was the lengthy procedure in filing the claim (Chand et al., Citation2016; Kumar et al., Citation2011; Citation2017; Singh & Chandel, Citation2019). Mechler et al. (Citation2006) found that one of the major reasons of failing of insurance scheme in many countries is the high cost associated with claim settling. Mongolia’s traditional indemnity based livestock insurance was found ineffective due to high cost of settling claims (Linnerooth-Bayer et al., Citation2011). About 36% of the respondent felt annual payment was also unattractive features. Only 7% of the respondent felt that the cost of insurance was expensive. About 12% of the respondent reveled that none of the feature of the insurance was unattractive. They revealed that all the features were valid.
3.6. Reason of not adopting livestock insurance
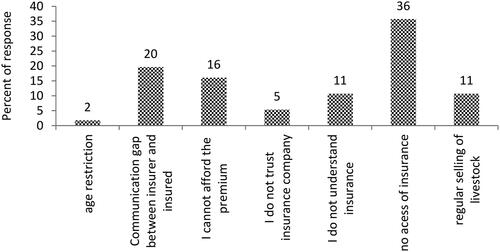
The main reason of not adopting insurance was low access to insurance (36%) (). Majority of the respondents of Namobuddha Ward-5 were not adopting the insurance. Milk collection centers in Namobuddha Ward-2 and 7 and Panchkhal-10 was nearer to the major market like Kathmandu and Banepa and around the periphery of B.P highway whereas Namobuddha Ward-5 was comparatively farther from the major market and B.P highway. Hence the access to insurance in Namobuddha ward-5 was comparatively lower than the other Wards. This might be the reason many non-adopters revealed low access to insurance as the major reason of not adopting insurance. A report of MEFIN (Citation2020) reported that 80% of the people in Nepal live in hard to access rural areas with insufficient infrastructure to effectively obtain agriculture insurance. About 20% of the respondent revealed that communication gap between insurer and insured is the reason of not adopting the insurance. Respondent were willing to buy the insurance policy but the lagging of communication between insurer and insured was hindering the adoption of the insurance. Only 16% of the non-adopter revealed that their reason of not buying insurance was they couldn’t afford the premium. Only 5% of the non-adopters respondents were found to have trust issues with insurance company
Figure 2. Reason of not buying livestock insurance.
Sources of information flow about insurance
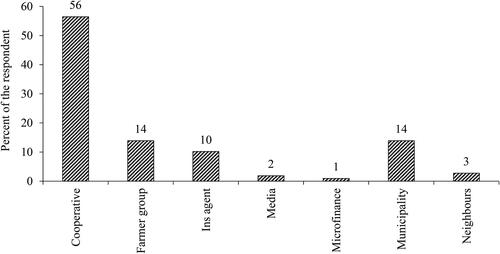
The information about the livestock insurance scheme was mainly in flowed from cooperatives (). This reveals that the cooperatives as a trustworthy organization to expand the insurance adoptability. Similar result was found by Nepali (Citation2021) i.e. cooperatives (42.2%) as a major source of information flow about insurance. But the findings were different of Devkota et al. (Citation2021) where the major source of information flow was government offices. Low access of the insurance service provider and communication gap between insurer and insured were major reason of not adopting insurance which shows the farmer’s motivation of adopting the insurance. But the active mobilization of cooperatives in expansion of insurance adoption among farmer was found lagging.
Figure 3. Sources of information flow about livestock insurance scheme in the study area.
3.7. Willingness to pay for livestock insurance scheme
The negative sign of estimates reflected the inverse relation of bid price and WTP (). This implies that as the bid price increases WTP for the insurance decreases and as the bid price decreases the WTP for the insurance increases. This statement perfectly reflects the law of demand.
Table 6. Relationship of bid price and Willingness to Pay.
Median value of WTP was used in the analysis rather than using mean value because median were more sensitive than mean and are the robust measure of central tendency (Carson et al., Citation1994; Fogarty & Aizaki, Citation2019; Hanemann, Citation1984). Rollins & Dumitras (Citation2005) used median WTP in their study in order to estimate the WTP using DBDC CV. However different study has used mean WTP as well (Buckland et al., Citation1999).
The point estimate of median value of WTP was NPR 2912 which is almost three times higher the amount farmers are currently paying (). Similar finding was found by Dahal et al. (Citation2021) in his study of WTP for crop (citrus) insurance in Nepal where the stated WTP was three time higher the amount the farmer were paying at that time. The study also used DBDC CV survey method to elicit the preferences of the farmer. The point estimate median value lied in the confidence interval of NPR 2565.30-3526.60.
Table 7. Median WTP for livestock insurance scheme.
The bid value that was used in study ranged from NPR 1000-2500. But the estimated point median value of WTP had exceeded the proposed range. Similarly the interval range was also outside the proposed range. This might be due to higher proportion of respondent saying ‘yes’ to both the bid price. If the respondent response is (yes, yes) than we can say that WTP > bidh (Aizaki et al., Citation2014; Calia & Strazzera, Citation1999; Freeman et al., Citation2014). In this study () 79% of respondent were found giving ‘yy’ (yes, yes) responses. More the money an individual is willing to pay for avoiding a loss or obtaining a benefit reflects the intensity of his/her preferences for such a loss or benefit (Markandya, Citation2002).
Table 8. Frequency of four different responses of proposed bid price.
3.8. Factors affecting adoption of livestock insurance scheme
Logit model was used to find the factors affecting adoption of livestock insurance scheme among the dairy farmers (). The model found number of cattle to be positively associated and significant at 90% confidence level. In KII with the cooperative representative from Atamanirbhar Bahudeshya Sahakari Satha Limited, it was found that greater numbers of cattle farmers were adopting the insurance and smaller numbers of buffalo farmers were adopting the insurance. Frequent buying and selling of buffalo was the reason of not adopting the insurance by buffalo farmer as compared to the cattle farmer. Since the buffalo easily get sold at the market for meat purpose and cattle meat is not sold due to religious taboos. Cattle farming are riskier as compared to buffalo. Similar result was found by Subedi and Kattel (Citation2021) where number of cattle was found positively associated with adoption of livestock insurance scheme and significant at 95% confidence level. Family size was expected to have a positive sign but in contrary a negative relation of family size and adoption of livestock insurance was found. The mean value of active population was higher than the mean value of inactive population in our study. Family size with large number of dependents had positive relationship with willingness and adoption of insurance in different study (Asamoah, Citation2019; Kwadz et al., Citation2013; Shirley, Citation2020). The regression result revealed that if the farmers were aware of livestock insurance scheme, the probability of adopting the insurance would increase by 48.7%. Similar result was found by Devkota et al. (Citation2021) and Kandel and Timalsina (Citation2018) where awareness about livestock insurance scheme was positively associated and significant at 99% confidence level. Similar other result also showed that with the increase in awareness of livestock insurance scheme, the probability of adopting the insurance increases (Aditya et al., Citation2018). Similarly if the farmer had experienced loss of livestock, the probability of adopting the insurance by the farmers would increase by 20.4%. However in the study made by Devkota et al. (Citation2021) and Subedi and Kattel (Citation2021), loss experience was not found significantly impacting the adoption of livestock insurance scheme. But different study had shown the evidence of positive and significant result on this relationship (Aditya et al., Citation2018; Baumann & Sims, Citation1978). Age of household was expected to have the negative impact on the adoption of insurance but the result showed the positive relation. Middle aged farmers are subjected more to adopt the insurance than the old age farmer (Nepali, Citation2021). In this study average age of farmer was 49 years. Family size was expected to have positive relationship with the adoption of the insurance. But the relationship was found to be opposite in this study. It might be because of lower number of dependent population in the family. More the number of dependents in the family, higher the probability of adopting the insurance was found by different study (Kwadz et al., Citation2013).
Table 9. Factors affecting adoption of livestock insurance scheme for respondent farmers.
3.9. Factors influencing willingness to pay for livestock insurance
Table given below () presents the results of a seemingly unrelated biprobit analysis aiming to understand the factors influencing households’ willingness to pay for livestock insurance. The model simultaneously investigates two dependent variables. The model is statistically significant (Wald chi2(18) = 41.01, p = 0.0015), indicating that the selected independent variables collectively play a role in influencing the willingness to pay for livestock insurance.
Table 10. Factors influencing willingness to pay for livestock insurance scheme for respondent farmers.
A positive coefficient (0.0289) with a p-value of 0.027 suggests that the age of the household head is a significant predictor of willingness to pay. The influence is positive for initial bid while it is negative for follow up bid. The relationship between willingness to pay and age of household was expected to be negative but positive significant relationship was seen. Similar result was seen in the study done by Paulos (Citation2002), Jebessa (Citation2004), Anemut (Citation2006), Bogale and Urgessa(Citation2012) and Mezgebo et al. (Citation2013) in Ethiopia and Chukwuone and Okorji (Citation2008) in Nigeria. This might be due to different socioeconomic conditions of the respondent. However follow up bid relationship shows negative relationship between willingness to pay for livestock insurance. This suggests that as the bid value increases, the willingness to pay for older people decreases. Years of schooling was also seen to have significant positive impact on willingness to pay as expected. The result was in consistent with the study made by Entele (Citation2020), Zarnikau (Citation2003), Gonfa (Citation2015). Similarly, experience of loss of livestock was found to have positive significant impacts on willingness to pay. Those farmers who had experienced loss of livestock were found more likely to pay for livestock insurance than those who have not experience the loss of livestock. Furthermore the significant positive impact in the follow up bid shows that the probability of farmers paying for the insurance increased regardless of increase in bid value. Similar result was found by Ghazanfar et al. (Citation2015). Aditya et al. (Citation2018); Baumann & Sims (Citation1978) in their study found farmer are more willing to pay and adopt the insurance scheme if they have experience loss.
4. Conclusion
Dairy farming is the important livestock sub-sector providing employment and income generation opportunities to many farmers and plays an important role in national economy. Though it is an integral part of Nepalese economy, vulnerability of livestock to different disease has made livestock farming very risky. It seeks an effective risk management strategy. Hence livestock insurance is an effective risk management tool that addresses all these risks and could reduce vulnerability of the dairy farmers. Realizing its importance Insurance Regulatory Authority of Nepal formally promulgated the Agriculture, Livestock and Medicinal Herb Insurance Directives 2022 by providing subsidy to stimulate more adoption of the insurance. Despite this subsidy scheme, livestock insurance coverage was not as expected. Hence the study intended to measure the WTP of livestock insurance scheme. The result revealed that dairy farmers were willing to pay three times more the current price of livestock insurance scheme. Hence, it is assumed that if the true WTP is higher than the current premium rate, then price of the insurance is not the issue for less coverage of insurance. Awareness about livestock insurance, loss experience of livestock and cattle number were found to have significant impact on adoption of livestock insurance. It shows that awareness about livestock insurance and how it could cover up the loss made from death of livestock could increase the adoption of livestock insurance.
Communication gap between insurer and insured and low access of insurance service provider were major reason of not buying insurance among non-adopters. About 93% of the total respondents were members of cooperatives. The major source of information flow about livestock insurance scheme was cooperatives among adopters. Hence if cooperatives are effectively mobilized, access to insurance can be improved and communication gap between insurer and insured can be reduced. Cooperative is taken as a trust worthy organization and can play a major role in providing awareness about the insurance. Increase in awareness through cooperatives can significantly impact the adoption of livestock insurance scheme.
Acknowledgements
I would like to express my gratitude towards Dean and Asst. Dean (Agriculture Faculty) and the entire faculty member for providing favourable academic environment and support for the successful completion of the study. With most appreciation, I heartily thank to all the respondents, milk collectors, Insurance Company, insurance agent, cooperative and farmer’s groups of study area, who provided me the required information, co-operated with me and provided great hospitality during the field survey of this research. Without their help, cooperation and information, the research could never be accomplished.
Disclosure statement
No potential conflict of interest was reported by the authors.
Notes
1 Nepalese Rupees (NPR) 131.90 = 1 US Dollar.
2 UB: Upper Bound.
3 LB: Lower Bound .
4 Nn means “no” response to both the double bounded dichotomous question.
5 Ny means “no” response to 1st question and “yes” response to follow up question.
6 Yn means “yes” response to 1st question and “no” response to follow up question.
7 Yy means “yes” response to both 1st and follow up question of double bounded dichotomous choice questions.
References
- Abdullah, S., & Jeanty, P. W. (2011). Willingness to pay for renewable energy: Evidence from a contingent valuation survey in Kenya. Renewable and Sustainable Energy Reviews, 15(6), 1–14. https://doi.org/10.1016/j.rser.2011.03.016
- Adhikari, R. K., & Bidari, S. (2018). Effectiveness of livestock insurance program in Dhading District of Nepal. Acta Scientific Agriculture, 2(11), 5.
- Aditya, K. S., Khan, T., & Kishore, A. (2018). Adoption of crop insurance and impact: Insights from India. Agricultural Economics Research Review, 31(2), 163. https://doi.org/10.5958/0974-0279.2018.00034.4
- Aina, O. S., & Omonona, B. T. (2012). Nigeria-agricultural-insurance-scheme-nais-prospect-achievement-and-problems.pdf. Global Advanced Research Journal of Agriculture Science, 1(5), 097–103.
- Aizaki, H., Nakatani, T., & Sato, K. (2014). Stated preference methods using R. Taylor and Francis Group.
- Amiry, S. A., Yacob, M. R., Radam, A., & Samdin, Z. (2009). Using double-bounded dichotomous choice contingent valuation and open-ended question format as support for nature conservation in Kapar bird sanctuary, 29.
- Anemut, B. (2006). Determinants of farmers’ willingness to pay for the conservation of national parks: The case of Simen Mountains National Park [Unpublished MSc thesis]. Haramaya University, Ethiopia.
- Arrow, K., Solow, R., Portney, P. R., Leamer, E. E., Radner, R., & Schuman, H. (1993). Report of the NOAA panel on contingent valuation. Federal Register, 58(10), 4601–4614.
- Asamoah, J. O. (2019). Livestock farmers’ willingness to pay for cattle insurance in the northern region of Ghana. University of Ghana, Legon.
- Bastola, N., Pandey, H., Upreti, S., Shah, K. M., Poudel, B., & Poudel, S. (2020). Milk production and value chain in rural area of Nepal: A case From Gandaki River Basin. Journal of Dairy Research & Technology, 3(2), 1–6. https://doi.org/10.24966/DRT-9315/100022
- Bateman, I., & Department of Transport Großbritannien. (2002). Economic valuation with stated preference techniques: A manual (Vol. 50, p. 480). Edward Elgar.
- Baumann, D. D., & Sims, J. H. (1978). Flood insurance: Some determinants of adoption. Economic Geography, 54(3), 189. https://doi.org/10.2307/142833
- Bogale, A., & Urgessa, B. (2012). Households’ willingness to pay for improved rural water service provision: Application of contingent valuation method in Eastern Ethiopia. Journal of Human Ecology, 38(2), 145–154. https://doi.org/10.1080/09709274.2012.11906483
- Bradford, W. D., Kleit, A. N., Krousel-Wood, M. A., & Re, R. M. (2004). Willingness to pay for telemedicine assessed by the double-bounded dichotomous choice method. Journal of Telemedicine and Telecare, 10(6), 325–330. https://doi.org/10.1258/1357633042601991
- Buckland, S. T., Macmillan, D. C., Duff, E. I., & Hanley, N. (1999). Estimating mean willingness to pay from dichotomous choice contingent valuation studies. Journal of the Royal Statistical Society: Series D (the Statistician), 48(1), 109–124. https://doi.org/10.1111/1467-9884.00175
- Budhathoki, N. K., Lassa, J. A., Pun, S., & Zander, K. K. (2019). Farmers’ interest and willingness-to-pay for index-based crop insurance in the lowlands of Nepal. Land Use Policy, 85, 1–10. https://doi.org/10.1016/j.landusepol.2019.03.029
- Calia, P., & Strazzera, E. (1999). Bias and efficiency of single vs. double bound models for contingent valuation studies: A Monte Carlo analysis. SSRN Electronic Journal. Applied Economics, 32(10), 1329–1336. https://doi.org/10.2139/ssrn.158412
- Carson, R. T., Wilks, L., & Imber, D. (1994). Valuing the preservation of Australia’s Kakadu conservation zone. Oxford Economic Papers, 46(Supplement_1), 727–749. https://doi.org/10.1093/oep/46.Supplement_1.727
- CBS. (2013). Statistical-Year-book-2013_SS.pdf (14th ed.). Central Bureau of Statistics. https://cbs.gov.np/wp-content/upLoads/2019/02/Statistical-Year-book-2013_SS.pdf
- Chand, S., Kumar, A., Bhattarai, M., & Saroj, S. (2016). Status and determinants of livestock insurance in India. A micro level evidence from Haryana and Rajasthan. Indian Journal of Agricultural Economics, 71(3), 335–346.
- Chukwuone, N. A., & Okorji, C. E. (2008). Willingness to pay for systematic management of community forests for conservation of non-timber forest products in Nigeria’s rainforest region. In R. B. Dellink & A. Ruijs (Eds.), Economics of poverty, environment and natural resource use (pp. 117–137). Springer.
- Dahal, B. R., Adhikari, S., & Khanal, A. R. (2021). Willingness to pay for crop insurance: A case from citrus farmers in Nepal. Journal of Agribusiness in Developing and Emerging Economies, 12(2), 247–261. https://doi.org/10.1108/JADEE-12-2020-0298
- Demaris, A. (1992). Logit modeling. SAGE Publications, Inc. https://doi.org/10.4135/9781412984836
- Devkota, D., Ghimire, Y. N., Timalsina, K. P., Subedi, S., & Poudel, H. K. (2021). Determinants of livestock insurance adoption in Nepal. Cogent Food & Agriculture, 7(1), 1952012. https://doi.org/10.1080/23311932.2021.1952012
- Diamond, P. A., & Hausman, J. A. (1994). Contingent valuation: Is some number better than no number? Journal of Economic Perspectives, 8(4), 45–64. https://doi.org/10.1257/jep.8.4.45
- Entele, B. R. (2020). Analysis of households’ willingness to pay for a renewable source of electricity service connection: Evidence from a double-bounded dichotomous choice survey in rural Ethiopia. Heliyon, 6(2), e03332. https://doi.org/10.1016/j.heliyon.2020.e03332
- Feder, G., & Slade, R. (1984). The acquisition of information and the adoption of new technology. American Journal of Agricultural Economics, 66(3), 312–320. https://doi.org/10.2307/1240798
- Fogarty, J., & Aizaki, H. (2019). Chapter 1 An illustrative example of contingent valuation | Non-Market Valuation with R. http://lab.agr.hokudai.ac.jp/nmvr/01-cv1.html#the-double-bounded-dichotomous-choice-or-follow-up-question-model
- Freeman, A. M., Herriges, J. A., & Kling, C. L. (2014). The measurement of environmental and resource values (3rd ed.). Taylor and Francis. http://econdse.org/wp-content/uploads/2016/07/Freeman-Herriges-Kling-2014.pdf
- Ghazanfar, S., Wen, Z. Q., Abdullah, M., Ahmad, J., & Khan, I. (2015). Farmers’willingness to pay for crop insurance in Pakistan. Journal of Business Economics and Finance, 4(2), 166–179.
- Ghimire, Y., Timsina, K. P., Kandel, G., Magar, D. B. T., Gautam, S., & Sharma, B. (2016). Agriculture insurance in Nepal: Case of banana and livestock insurance. Socioeconomics and Agricultural Research Policy Division, NARC. DOI. https://doi.org/10.13140/RG.2.1.4767.6403
- Gonfa, L. (2015). Farmers’ willingness to pay for improved forage seed in LIVES Districts of west Shewa Zone, Ethiopia [Doctoral dissertation, Haramaya University].
- Guo, W., & Bohara, A. (2015). Farmers’ perception of climate change and willingness to pay for weather_index insurance in Bahunepati, Nepal. UMN.edu. https://digitalrepository.unm.edu/cgi/viewcontent.cgi?article=1073&context=hprc
- Hanemann, W. M. (1984). Welfare evaluations in contingent valuation experiments with discrete responses. American Journal of Agricultural Economics, 66(3), 332–341. https://doi.org/10.2307/1240800
- Igarashi, A., Goto, R., & Yoneyama-Hirozane, M. (2019). Willingness to pay for QALY: Perspectives and contexts in Japan. Journal of Medical Economics, 22(10), 1041–1046. https://doi.org/10.1080/13696998.2019.1639186
- Jebessa, S. (2004). Contingent valuation of multi-purpose tree resources: The case of Arsi Zone, Ethiopia [MSc thesis, School of Graduate Studies, Addis Ababa University], 96 p.
- Jha, A. K., & Singh, O. P. (2021). Farmers’ awareness and perception about livestock insurance in Dhanusha District, Nepal. International Journal of Biological Innovations, 03(01), 228–239. https://doi.org/10.46505/IJBI.2021.3125
- Jinsoo, K., & Jihyo, K. (2015). Korean public’s perceptions on supply security of fossil fuels: A contingent valuation analysis. Applied Energy, 137, 301–309. https://doi.org/10.1016/j.apenergy.2014.10.016
- Jose, A., Philip, M., Prasanna, L. T., & Manjula, M. (2020). Comparison of probit and logistic regression models in the analysis of dichotomous outcomes. Current Research in Biostatistics, 10(1), 1–19. https://doi.org/10.3844/amjbsp.2020.1.19
- Kandel, G., & Timalsina, R. (2018). Farmers’ awareness and perception about livestock insurance: A case from Nawalparasi District of Nepal. ACTA Scientific Agriculture, 3, 117–121.
- Kerr, G. N. (2000). Dichotomous choice contingent valuation probability distributions. Australian Journal of Agricultural and Resource Economics, 44(2), 233–252. https://doi.org/10.1111/1467-8489.00109
- Khan, N. I., Brouwer, R., & Yang, H. (2014). Household’s willingness to pay for arsenic safe drinking water in Bangladesh. Journal of Environmental Management, 143, 151–161. https://doi.org/10.1016/j.jenvman.2014.04.018
- Kim, J., Park, J., Kim, H., & Heo, E. (2012). Assessment of Korean customers’ willingness to pay with RPS. Renewable and Sustainable Energy Reviews, 16(1), 695–703. https://doi.org/10.1016/j.rser.2011.08.034
- Kumar, D. S., Barah, B. C., Ranganathan, C. R., Venkatram, R., Gurunathan, S., & Thirumoorthy, S. (2011). An analysis of farmers’ perception and awareness towards crop insurance as a tool for risk management in Tamil Nadu. Agricultural Economics Research Review, 24(1), 37–46.
- Kumar, J., Singh, S. K., & Singh, A. (2017). Factors affecting adoption and level of satisfaction among dairy owners towards livestock insurance. 04. http://www.jakraya.com/journal/pdf/4-ijavsArticle_4.pdf
- Kumar, J., Singh, S. K., Singh, A., & Sharma, D. (n.d.). Factors influencing the willingness for adoption of livestock insurance among dairy owners. International Journal of Livestock Research, 8(5), 220–227. https://doi.org/10.5455/ijlr.20171220065400
- Kumari, M., Singh, K. M., Mishra, R. R., Sinha, D. K., & Ahmad, N. (2017). Role of socio-economic variables in adoption of crop insurance: A discriminant function approach. Economic Affairs, 62(3), 361. https://doi.org/10.5958/0976-4666.2017.00045.6
- Kwadz, G. T., Kuwornu, J. K. M., & Amadu, I. S. B. (2013). Food crop farmers’ willingness to participate in market-based crop insurance scheme: Evidence from Ghana. Research in Applied Economics, 5(1), p1–p21. https://doi.org/10.5296/rae.v5i1.2617
- Linnerooth-Bayer, J., Mechler, R., & Hochrainer-Stigler, S. (2011). Insurance against losses from natural disasters in developing countries. Journal of Integrated Disaster Risk Management, 1(1), 59–81. Ht https://doi.org/10.5595/idrim.2011.0013
- Markandya, A. (2002). Economic principles and overview of valuation methods for environmental impacts. In Environmental economics for sustainable growth (p. 24). Edward Elgar Publishing Ltd. https://www.czp.cuni.cz/Vzdel/letni_skola/ program/Markandya_Economic%20principles%20and%20overview%20of%20valuation%20methods%20for%20environmental%20impacts.pdf
- Mechler, R., Linnerooth-Bayer, J., & Peppiatt, D. (2006). 5683—Disaster Insurance for the Poor. A review of microinsurance for natural disaster risks in developing countries.pdf. IIASA Science for Global Insight. http://lib.riskreductionafrica.org/bitstream/handle/123456789/245/5683%20-%20Disaster%20Insurance%20for%20the%20Poor.%20A%20review%20of%20microinsurance%20for%20natural%20disaster%20risks%20in%20developing%20countries.pdf?sequence=1tps://doi .org/10 .5595/idrim.2011.0013
- MEFIN. (2020). Nepal Agricultural Insurance_Country Experience Factsheet.pdf. giz. https://mefin.org/docs/Nepal%20Agricultural%20Insurance_Country%20Experience%20Factsheet.pdf
- Mezgebo, A., Tessema, W., & Asfaw, Z. (2013). Economic values of irrigation water in Wondo Genet District, Ethiopia: An application of contingent valuation method. Journal of Economics and Sustainable Development, 4(2), 23–36.
- MoALD. (2021a). Agriculture diary 2078 for web_1619513804.pdf. Nepal Government. http://aitc.gov.np/downloadfile/agriculture%20diary%202078%20for%20web_1619513804.pdf
- MoALD. (2021b). Livestock Statistics 2076_77_1642393389 (3).pdf. Government of Nepal. http://www.dls.gov.np/reportfiles/Livestock%20Statistics%202076_77_16 42393389.pdf
- Mohammed, M. A., & Ortmann, G. F. (2005). Factors influencing adoption of livestock insurance by commercial dairy farmers in three zobatat of Eritrea. Agrekon, 44(2), 172–186. https://doi.org/10.1080/03031853.2005.9523708
- Mwangi, M., & Kariuki, S. (2015). Factors determining adoption of new agricultural technology by smallholder farmers in developing countries. Journal of Economics and Sustainable Development, 6(5), 208–216.
- NCRP. (2021). Annual_Report_2077_78_NCRP_Rampur_1634794019.pdf. National Cattle Research Program. http://ncrp.gov.np/downloadsdetail/11/2019/90039237
- NDDB. (2021). Study on data base of dairy value chain. Government of Nepal. https://nddb.gov.np/storage/uploads/LQcxqKlCvgBPembtHFzxB8T3YV12ulGtKTGfn8oP.pdf
- Nepali, B. (2021). Farmers’ perception on status of livestock insurance in Surkhet district, Nepal. Journal of Agriculture and Natural Resources, 4(2), 111–123. https://doi.org/10.3126/janr.v4i2.33679
- NIA. (2021a). Agri-8-Years-Data_up-to-2077_78.pdf. Nepal Insurance Authority. https://nib.gov.np/wp-content/uploads/2022/01/Agri-8-Years-Data_up-to-20 77_78.pdf
- NIA. (2021b). Annual Report 2076-77-compressed.pdf. Nepal Insurance Authority. https://www.nib.gov.np/Annual%20Report%202076-77-compressed.pdf
- NIA. (2022). Affiliated insurers. Insurance at a Glance. Nepal Insurance Authority. Retrieved February 23, 2022, from https://nib.gov.np/affiliated-insurers-2/
- NIA. (n.d.). Cattle-Insurance-Policy. Nepal Insurance Authority. Retrieved February 23, 2022, from http://nib.gov.np/wp-content/uploads/2019/01/Cattle-Insurance-Policy.pdf
- OECD. (2018). Cost-benefit analysis and the environment: Further developments and policy use. Organisation for Economic Co-operation and Development. https://www.oecd-ilibrary.org/environment/cost-benefit-analysis-and-the-environm ent_9789264085169-en?itemId=/content/component/9789264085169-7-en&_csp _=f0f16cd2fa01ffe2753e89821ddfd5b3&itemIGO=oecd&itemContentType=chapter
- Panta, P. K., Dutta, J. P., Kattel, R. R., & Dhungana, S. M. (2019). Farmer’s willingness to pay for crop insurance in Chitwan District, Nepal. Journal of Agriculture and Environment, 20, 93–99.
- Paulos, A. (2002). Determinants of farmers’ willingness to participate in soil conservation practices in the highlands of Bale: The case of Dinsho farming system area. Alemaya University, Dire Dawa, Ethiopia.
- Poudel, R. R. (2021). Circular-2-2078-79.pdf. https://nib.gov.np/wp-content/uploads/2021/10/Circular-2-2078-79.pdf
- Riddell, W. C., & Song, X. (2012). The role of education in technology use and adoption: Evidence from the Canadian workplace and employee survey. ILR Review, 70(5), 1219–1253.
- Rollins, K., & Dumitras, D. E. (2005). Estimation of median willingness to pay for a system of recreation areas. International Review on Public and Nonprofit Marketing, 2(1), 73–84. https://doi.org/10.1007/BF02893252
- Sajise, A. J., Samson, J. N., Quiao, L., Sibal, J., Raitzer, D., & Harder, D. (2021). Contingent valuation of nonmarket benefits in project economic analysis: A guide to good practice. Asian Development Bank. https://doi.org/10.22617/TCS210514-2
- Santirongyuth, M. P. (2018). Perceived benefits and barriers influencing the adoption of life insurance among Thai people [Doctoral dissertation, Thammasat University]. http://ethesisarchive. library.tu.ac.th/thesis/2018/TU_2018_6002040548_10312_10058.pdf
- Sapkota, B. (2021). Farmers risk perceptions, attitudes and management strategies and willingness to pay for crop insurance in Nepal [Doctoral dissertation, PhD thesis, School of Agriculture and Environment, The University of Western Australia]. https://api.research-repository.uwa.edu.au/ws/portalfiles/portal/157906957/Thesis_Doctor_of_Philosophy_Sapkota_Bibek_2021.pdf
- Sharma, B. (2017). Milk marketing and dairy value chain development in Nepal in relation with climate resilience effort in the present context. Nepalese Veterinary Journal, 34, 144–151. https://doi.org/10.3126/nvj.v34i0.22917
- Shirley, R. O. (2020). An assessment of smallholder livestock keepers’ willingness- to-pay for cattle insurance attributes in Botswana: The case of Central District [Doctoral dissertation, University of Nairobi]. http://erepository.uonbi.ac.ke/bitstream/handle/11295/ 153165/Thesis%20shirley_an%20assessment%20of%20smallholder%20livestock%20keeper.pdf?sequence=1
- Singh, A., & Hlophe, N. (2017). Factors affecting adoption of livestock insurance: A case study of livestock farmers in Manzini Region. Swaziland, 5, 1–9.
- Shingh, S., Kalwar, C. S., Poudel, S., Tiwari, P., & Jha, S. (2020). A study on growth and performance of dairy sector in Nepal. International Journal of Environment, Agriculture and Biotechnology, 5(4), 1154–1166.
- Singh, S. P., & Chandel, B. S. (2019). Factors influencing in adoption of livestock insurance with special reference to Haryana. Indian Journal of Dairy Science, 72(3), 336–341. https://doi.org/10.33785/IJDS.2019.v72i03.015
- Song, N. V., Huyen, V. N., Dung, L. T. P., & Thuy, N. T. (2019). Using double-bounded dichotomous-choice to estimate households’ willingness to pay for improved water quality in Bac Ninh province of Vietnam. Journal of Environmental Protection, 10(11), 1407–1418. https://doi.org/10.4236/jep.2019.1011083
- Subedi, S., & Kattel, R. R. (2021). Farmers’ perception and determinants of dairy cattle insurance in Nepal. Cogent Food & Agriculture, 7(1), 1911422. https://doi.org/10.1080/23311932.2021.1911422
- Swain, M., & Hembram, B. R. (2020). Determinants of adoption of crop insurance: Evidence from Bolangir District in Odisha. Journal of Land and Rural Studies, 8(2), 121–137. https://doi.org/10.1177/2321024920914767
- Thapa, U., Adhikari, N., Kafle, S., Shrestha, N., Banjara, M. R., Steneroden, K., Bowen, R., Rijal, K. R., Adhikari, B., & Ghimire, P. (2020). Effect of deworming on milk production in dairy cattle and buffalo infected with gastrointestinal parasites in the Kavrepalanchowk district of central Nepal. Veterinary Record Open, 7(1), e000380. https://doi.org/10.1136/vetreco-2019-000380
- Tian, X., Yu, X., & Holst, R. (2011). Applying the payment card approach to estimate the WTP for green food in China. In IAMO Forum (Vol. 23, pp. 1–21). http://hdl.handle.net/10419/50786
- Timilsina, R. H., Ojha, G. P., Nepali, P. B., & Tiwari, U. (2019). Agriculture land use in Nepal: Prospects and impacts on food security. Journal of Agriculture and Forestry University, 3, 1–9.
- Zarnikau, J. (2003). Consumer demand for ‘green power’and energy efficiency. Energy Policy, 31(15), 1661–1672. https://doi.org/10.1016/S0301-4215(02)00232-X