
Abstract
Ethiopia is rich in durum wheat diversity; however, national average productivity of durum wheat is low due to lack of strong national research program, and these calls for development of improved new varieties. Knowledge on extent of genetic variability and identification of important characters are a prerequisite for the development yielder and quality variety. Therefore, the present study was carried out to assess the extent of genetic variability and character association among yield and yield related traits in selected Ethiopian durum wheat landraces. Forty nine durum wheat accessions were studied for 20 traits at Sinana and Selka locations by using 7 × 7 simple lattice design in 2018/19. Combined analysis of variance revealed significant differences among accessions for all traits, indicating the presence of considerable variability among genotypes. A significant accession by locations interaction effect was observed which indicates differential performance of genotypes over environments. Protein content varied from 10.7%–16.7% with the overall mean of 13.5%. Also phenotypic coefficients of variation (PCV) ranged from 2.93 for hectoliter weight (HLW) to 27.08 for productive tillers (PTL) while, genotypic coefficients of variation (GCV) ranged from 0 for wet gluten (WGL) to 16.43 for vitreous (VTR). Low to high heritability was observed for the studied traits. Similarly, genetic advance as percent of mean varied from −0.20–31.24. High broad sense heritability and high genetic advance were obtained for grain yield (GY) (86.57 and 31.24) and vitreous (VTR) (75.76 and 29.39), respectively, indicating traits could be improved easily through selection. Overall, the present study revealed that there is sufficient variability existed in Ethiopian durum wheat landraces.
PUBLIC INTEREST STATEMENT
Updating better yielding varieties and using recommended managements can improve productivity of the crops. Varieties should be evaluated under different environments and confirmed for their adaptation by National Variety Releasing Committee before disseminating to a large community, which is a usual practice that has been conducted in the research ethics. This is due to varying environment affecting crop adaptation. In this study, therefore, different accessions were evaluated and characters were identified for specific objective which will be used for crossing purpose for the improvement of durum wheat.
1. Introduction
Globally, wheat is grown in about 224.09 million hectares holding the position of highest acreage among all crops with annual production hovering around 794.44 million metric tons (USDA, Citation2021). Durum wheat production represents 5% of total wheat production with a planting area of 16 million hectares globally (International Grains Council [IGC], 2020). Durum wheat (Triticum turgidum; 2n = 4× = 28) mostly cultivated in Mediterranean basin, where approximately 75% of the world’s durum wheat area is still grown which contributes 50% of the worldwide production (Kabbaj et al., Citation2017). Globally, the most important growing areas are situated in the Mediterranean Basin, North America, North and East Africa and South West Asia (Bonjean et al., Citation2011). It is the main source of semolina for the production of pasta, macaroni, couscous, burghul and other local end use products. In some countries, such as Italy, regulatory standards specify that pasta must be made with 100% durum semolina (Sopiwnyk, Citation2018). The production of pasta requires grain with high protein content, gluten strength, and high yellow pigment content, which provides the characteristic yellowness that, is expected from the pasta. The nutritional composition indicated that 100 g of durum wheat provides 339 calories, and it consisted of carbohydrate 71 g, protein 14 g, fat 2.5 g, minerals 2 g and considerable proportions of vitamins (thiamine and vitamin-B) and minerals like zinc and iron (Wolde et al., Citation2016).
Ethiopia is the center of diversity for durum wheat and is mostly planted on heavy black clay soils (vertisols) of the highlands between 1800 and 2800 m above sea level (Wolde et al., Citation2016, Tesemma et al., 1991). Ethiopia is a primary center of genetic diversity for durum wheat, with diverse agro-climatic zones (Alemu et al., Citation2020). Genetic variability, heritability and genetic advance are very important for building of appropriate breeding program and broadening the gene pool. The heritability is the assessment of the genetic part on appearance (phenotype), and it is useful for studying the genetic changes of a population subjected to breeding (Falconer, 1981). Assessments of heritability are influenced by various factors: type of genetic material, size of the sample, the method of sampling, the conduct of the experiment, calculation method and the relationship between all of these (Fehr, Citation1987). Heritability and the values of genetic advance help us make selection more effective and evaluate selection response (Ijaz et al., Citation2015). High heritability coupled with high genetic advance for different yield elements indicate a better opportunity to select highly productive genotypes (Stamatov et al., Citation2018). Simultaneous assessment of heritability and genetic advance is more reliable and meaningful than their individual consideration (Nwangburuka & Denton, Citation2012). Assessment of genetic advance is used in modern breeding programs and in other crops (Stamatov et al., Citation2020). On the other hand, genotypic and phenotypic coefficients of variation are useful for detecting the amount of variability present in germplasm (Datta & Das, Citation2014).
Grain yield being a polygenic trait, breeding of genotypes based solely on grain yield is not very effective. Therefore, to increase the efficiency of breeding, the identification by the wheat breeder of the traits contributing to the final yield is crucial (Saeed et al., Citation2016). It is believed that crosses between genetically diverse parents are likely to produce higher heterosis, desirable genetic recombination and segregation in progenies (Asmamaw et al., Citation2019). The large range of variability in the population provides an opportunity to select desirable traits (Arya et al., Citation2013).
Improving durum wheat yield, commercial grain quality and mineral content are an endless topic in agricultural research, due to an increase in market demand for acceptable grain quality traits. According to the Central Statistics Agency (CSA, Citation2018), the average yield of durum wheat in Ethiopia is estimated to be 27.4 q/ha which, is lower than world average due to different factors. Evidence supports the hypothesis that, landraces can provide new alleles for the improvement of commercially valuable traits (Lopes et al., Citation2015). Example, among several local durum landrace collections tested for productivity and stem and leaf rust resistance, four selections (A10, H23, P20 and R18) were developed and released to farmers in Eritrea in 1952 (Amadou et al., Citation2019). It is well established that genetic variability is a base and pre requisite for plant breeding program on which selection is practiced to select superior genotype among existing diverse germ-plasm. So it is crucial for breeders to conduct the research, determine genetic variability and ways of inheritance for different elements of the yield to derive a successful breeding program. However, in Ethiopia, the potential has not yet been fully exploited and no such studies on diversity of the existing durum wheat collections were carried out under Bale highland condition. Thus, the current objective was planned to estimate the genetic variability, heritability, genetic advance, quality and agronomic contributing traits of Ethiopian durum wheat landraces based on morpho-agronomic traits.
2. Materials and methods
2.1. Description of the study sites
The field experiment was conducted at two locations in Southern Ethiopia namely, at Sinana with geographical coordinate units of 07°07’N, 40°10’E and Selka with geographical coordinate units of 07°04’28’’N, 040°12’18’’E during 2018/19 main cropping season. Both experimental sites are characterized by pellic vertisol with a slightly acidic soil and its PH ranges from 6.3–6.8 (SARC, 2006). The altitude for Sinana on station is 2400 m, and for Selka site is 2509 m above sea level representing the potential durum wheat production area in the zone. Sinana Agricultural Research Center (SARC) is located 463 km South–East of Addis Ababa in the highlands of Bale Zone, South–Eastern Oromia and at a distance of 33 km in East the capital city of the Zone (Robe town). Also Selka site is on the way to Sinana Agricultural Research Center (SARC) 7 km away from the SARC to the south. Both areas are characterized by bimodal rainfall pattern and receive annual total rainfall ranging from 750–1400 mm. The main season receives 270–842 mm rainfall, while the short season receives from 250–562 mm rainfall annually. Mean annual minimum and maximum temperatures are 9.6 °C and 20.7 °C, respectively. The experiment at both locations was conducted during the main cropping season, which extends from August to December.
2.2. Plant materials
The experimental materials comprised of 49 durum wheat germ-plasm including three (checks) released durum wheat varieties from Sinana Agricultural Research Center viz. Bulala, Dire and Obsa (). These landraces were developed in to pure lines by SARC from collections introduced from Ethiopian Biodiversity Institute (EBI).
Table 1. Description of the test genotypes.
2.3. Experimental design and layout
The experiment was laid out in 7 × 7 simple lattice design with two replications having plot size of four rows of 20 cm spacing and 2.5 m length. The seeding rate recommended for the trial was 150 kg/ha, and fertilizer rate of 69/46 N/P2O5 was applied (Tilahun et al., Citation2008). UREA (N) was applied in split application where one third was applied at planting and the remaining two third was at tillering stage (Haile et al., Citation2012), and all important agronomic practices were followed uniformly. Planting was done by hand drilling and weed was controlled by using hand weeding as well as by using herbicide called Pallas 45OD at the recommended rate and time of application.
2.4. Data collection
All agronomic, yield and yield-related traits and quality traits both on plant and plot basis were recorded from the two middle rows units. Plant-based data were collected from randomly selected and representative 10 plants in the plot while, the plot-based data were collected from the whole harvestable plot. These were plant height (PLH), spike length (SPL), number of spikelets/spike (SPS), productive tillers/plant (PTL), number of grains/spike (KPS), days for heading (DH), days for maturity (DM), grain filling period (GFP), grain yield (GY), biomass yield (BM), harvest index (HI) (%), Thousand kernel weight (TKW) (g), Vitreous (VTR) (%), Hectoliter weight (HLW) (kg/L), Grain protein content (GPT) (%), Grain gluten content (GGL), Zeleny Index (ZI), Wet gluten content (WGL) (%), Sodium dodecyl sulfate (SDS) sedimentation (ml) and Ash content (ASC) (%).
2.5. Analysis of variance (ANOVA)
The SAS GLM procedure (SAS Institute, Inc. 2002) was employed for the analysis of variance. Fisher’s protected least significant difference (LSD) test at 5% level of significance was used for mean comparisons, whenever genotypes differences were significant. The total phenotypic variance of each trait was partitioned into genetic and non-genetic factors using the variance component method based on the combined analyses over the two tested locations. Phenotypic (PCV) and genotypic (GCV) coefficients of variation was calculated following the method of Burton and Devane (Citation1953). Broad sense heritability (H2) was calculated as a ratio of genotypic to phenotypic variance according to Allard (Citation1960). Genetic advance (GA) was determined following the procedure elaborated by Johnson et al. (Citation1955).
3. Results and discussions
3.1. Analysis of variance
The results of analysis of variance showed the existence of highly significant (p ≤ .01) variation among genotypes for biomass (BM), grain yield (GY), number of kernels per spike (KPS), productive tillers (PTL) and thousand kernel weight (TKW) while; significance differences (p ≤ .05) was observed for spike length (SPL) and number of spikelet’s per spike (SPS) at Sinana site (). At Selka, also highly significance differences (p ≤ .01) among genotypes were recorded grain filling period (GFP), plant height (PLH), grain yield (GY), spike length (SPL), productive tillers (PTL) and thousand kernel weight (TKW) while; for the remaining traits significances (p ≤ .05) () were recorded. Significance differences among accessions suggesting that the existence of wider genetic variation of durum wheat landraces. Similarly, Temesgen et al. (Citation2023) identify, highly significant (p ≤ .01) difference for all studied traits. Also, Alemayehu et al. (Citation2019) reported highly significant differences among genotypes for grain yield (GY), biomass weight (BM), spike length (SPL), days for heading (DH) and grain filling period (GFP) and reported significant(p ≤ .05) variation for grain protein content (GPC) and number of spikelet’s per spike (SPS). Again, Mengistu et al. (Citation2016) and Mohammed et al. (2011) also reported considerable genetic variability and significant differences for quantitative and qualitative traits in durum wheat genotypes.
Table 2. Analysis of variance (mean squares) for 20 studied traits of 49 durum wheat accessions studied at Sinana and Selka during 2018/19.
The results showed that the error mean squares were homogeneous for all the characters studied in the tested locations since the ratio of the highest error mean square to the smallest error mean square was less than 3.00 according to Gomez and Gomez (Citation1984). Therefore, the data were pooled across locations and analyzed accordingly. The results of analysis of variance for combined over locations data showed that there was significance variation among different durum wheat genotypes for all yield attributes and quality traits was considered in this study. Highly (p ≤ .01) significance differences were observed among studied accessions for all traits. The test locations had also a pronounced effects ranging from highly significance (p ≤ .01) for 14 traits for days for mature (DM) and heading (DH), biomass weight (BM) and grain yield (GY), Harvest Index (HI), productive tillers (PTL), thousand kernel weight (TKW), grain protein content (GPC), ash content (ASC), Zeleny Index (ZI), plant height (PLH), number of spikelet’s per spike (SPS), kernels per spike (KPS) and SDS-sedimentation. However, location effects did not induce significant variation on the six traits viz grain filling period (GFP), spike length (SPL), hectoliter weight (HLW), wet gluten (WGL) and grain gluten (GGL) ().
Table 3. Analysis of variance (mean squares) for 20 studied traits of 49 durum wheat accessions studied over locations during 2018/19.
Locations × genotypes interaction was also showed significant differences (p ≤ .05) for days for mature (DM), plant height (PLH), Harvest Index (HI), grain yield (GY), number of spikelet’s per spike (SPS) and hectoliter weight (HLW), whereas; highly significant differences (p ≤ .01) was observed for productive tiller (PTL), biomass weight (BM), wet gluten (WGL) and for SDS-sedimentation (). This implies that accessions performed differently based on environmental conditions imposed by location while, the remaining variables were showed non-significance for genotypes × locations interaction, indicates the genotypes performance were showed close differences. Generally, the observed significance differences among accessions; for the traits under study indicated the presence of genetic variations among the genotypes which in turn suggested that selection of landraces can be effective in improving both yield and quality traits of durum wheat. The same results were reported by Mengistu et al. (Citation2018) regarding genotypes by environment interactions in durum wheat landraces. Besides, such kind of variability among wheat genotypes for yield and yield-related traits were also reported by and Almaz (Citation2017).
3.2. Range and mean values of traits
3.2.1. Performance of genotypes for phenology and growth traits
Plant height (PLH) showed highly significance differences among studied genotypes at both locations and for combined over locations, indicates differential performance of genotypes over locations. The mean, maximum and minimum values of the studied traits reveal a large variability in the genotypes (). Obsa was the shortest of all while; genotype Acc7010 was the tallest of all genotypes at both locations (Supplementary Tables 1 and 3, respectively). This trait value ranged from 80.3–137.6 cm and 76.1–142.8 cm with the mean values of 103.1 and 109.7 cm at Sinana and Selka sites respectively (Supplementary Tables 7 and 8). The average value of plant height classifies it as medium-high wheat that falling into this classification, it can be assumed that they will be resistant to lodging and would tolerate higher rates of nitrogen fertilization. Generally, phenology is a key feature for adaptation of genotypes to climatic condition in which they grow. Plant height is a major agronomic trait in wheat breeding because it often affects grain yield (GY) because lodging risk prevents the economic use of sufficient quantities of nitrogen to produce canopies large enough to intercept the majority of available light during yield formation, productive tillers and number of kernels per spike. Similarly, Dragov et al. (Citation2022), Verma et al. (Citation2013), Almaz et al. (2017) and Manel et al. (Citation2015) reported that there is appreciable variability among several durum wheat genotypes for plant height.
Table 4. Estimate of range, mean, phenotypic (σ2p), genotypic (σ2g) and environmental (σ2e) variances, phenotypic (PCV) and genotypic (GCV) coefficient of variability, broad sense heritability (H2%), genotypic × location variance (σ2gl), expected genetic advance (GA) and genetic advance as percent of the mean (GA %) for twenty characters for combined over locations, 2018/19.
The genotypes with location interaction for grain filling period (GFP) was showed non-significant indicated that, the performance of genotypes for this trait was inconsiderable differences over locations. The combined over locations data showed the variation of this trait was varied from 44.8–64.1 days with overall mean value of 32.9 days. Obsa and genotype Acc5141 took the longest and shortest period to GFP respectively (Supplementary Table 5).
Combined over locations data for days for heading (DH) was varied from 58.7–85.5 with the overall mean value of 64.0 days. The shortest and longest day for heading was recorded from genotypes Acc230678 and Acc7010, respectively (). Also this trait was varied from a minimum 56.0–86.5 days at Sinana, while it ranged from 60.5–84.5 days at Selka (Supplementary Tables 7 and 8). Variation in length of days for heading of the genotypes influences directly grain yield (GY) and the genetic basis for this trait would be more worthy according to the given environmental conditions. The interaction of genotypes with locations was non-significance for this trait indicates that, mean performance of genotypes over locations and the wider adaptation range for this trait among accessions. This may be due to genetic differences and selection can be effective according to the breeding objectives. Similarly, Alemayehu et al. (Citation2019) in the study of 64 durum wheat genotypes and reported the mean for days for heading were 58 days, and the earliest line to heading was 49 days while the latest line to reach heading was 62 days. Manel et al. (Citation2015) and Mengistu et al. (Citation2016) also, reported that there was wider variability among several durum wheat genotypes for days to heading.
The genotype with location interaction for days for mature (DM) was significant which indicates that, differential performance of genotypes for this trait under each location. The wider range were recorded and the mean values of the locations showed, relatively studied accessions at Sinana matured earlier (117.4) than at Selka (119.3) (Supplementary Tables 1 and 3). At Sinana, this trait value was varied from 111.0–138.5 days, while at Selka it ranged from 108.0–136.0 days (Supplementary Tables 7 and 8). The latest and earliest was recorded from genotypes Acc7010 and Acc5141 at both locations and the same is true for combined data (Supplementary Tables 1, 3 and 5). Generally accessions that took shorter days for heading and maturity calls for exploitation of these accessions in national as well as international breeding programs to develop early maturing varieties that would be viable under adverse climatic change. Specially, in case of Bale zone, the early heading and maturing varieties are more demand since, double cropping systems are the main practice in the region and at low moisture stress is commonly problem. Earliness is a desired trait for the final grain yield as well as early maturing accessions must be give average to higher grain yield for adoption of varieties by farming communities. This result also agrees with Mengistu et al. (Citation2016) who reported 18 days difference between the early and the late days to maturity of durum wheat landraces and contradicts with Alemayehu et al. (Citation2019) who reported a narrow range 93 to 100 days to maturity in durum wheat genotypes.
3.2.2. Grain yield performance
Genotypes interaction with locations showed significance differences for grain yield (GY) indicate that, genotypes were showed differential performance under each location. The range varied from 2191.7–6023.8 kg/ha−1 at Sinana and most of accessions gave above the grand mean (4380.8 kg/ha) (Supplementary Table 7). Also at Selka grain yield varied from 2191.3–5309.1 kg/ha−1 and here also most of accessions were yielded above grand mean (3850.80 kg/ha−1) (Supplementary Table 8). The differences between maximum and minimum mean values in grain yield per hector at Sinana and Selka were 3831.1 kg/ha and 3117.7 kg/ha−1, respectively. The difference among accession was greater at Sinana, at Selka though the range was as wide as that of Sinana but, the grand mean was lower (3850.8 kg/ha−1) than that of Sinana (4380.8 kg/ha−1). This may be due to the differences between the two locations in terms of edaphic and weather conditions prevailing in the areas and slightly longer growing period of the crop at Selka compared to Sinana, which exposed the crop to frost that may cause lowers the yield in the season in particular at grain filling period of the genotypes. The higher grain yield (6023.8, 5914.4,and 5774.1 kg/ha−1) was recorded from genotypes Dire, Acc242783 and Acc243701, respectively, while lowest grain yield was recorded from genotype Acc7010 (2191.7 kg/ha) at Sinana as well as at Selka (2191.3 kg/ha−1) (Supplementary Tables 1 and 3). Both checks (Obsa and Dire) recorded higher grain yield (5309.1 and 5093.8 kg/ha−1) at Selka site, respectively. Also for combined over locations grain yield ranged from 2191.5–5565.9 kg/ha−1 (). Among studied genotypes 31 (63%) of them gave grain yield exceeding the overall mean (4115.8 kg/ha−1). Generally, yield is formed throughout the growth of the crops, with the environment and agronomic inputs at different growth stages influencing yield through their impact on specific yield components. Similarly, Mengistu et al. (Citation2016) reported a wider genetic variation of grain yield of durum wheat genotypes. Again Asmamaw et al. (Citation2019) reported the wide variation for durum wheat land races for grain yield traits.
3.2.3. Performance of yield-related traits
The mean performance of the tested accessions for yield and yield components are presented in Supplementary Tables 1, 3 and 5 for Sinana, Selka and for combined data over locations, respectively. Also the range and mean values for the traits studied are shown in Supplementary Tables 7 and 8 for Sinana and Selka sites, respectively, while for combined over locations data is presented in .
The diverse performance of the studied accessions was also reflected in the final important trait i.e. biomass weight (BM). At Sinana, it was varied from 6,750.0–20,850.0 kg/ha (Supplementary Table 7) whereas, at Selka it varied from 8700.0–20, 200.0 kg/ha−1 (Supplementary Table 8). The differences between maximum and minimum mean values in biomass weight per hector at both locations were wider indicates that, a wider variation among studied accessions. The highest overall mean values of biomass weight (13317.35 kg/ha−1) was recorded at Selka as compared to Sinana (12712.80 kg/ha) (Supplementary Tables 7 and 8). This indicates that, the crop performance was much better at Selka than at Sinana due to the differences between the two locations in terms of edaphic and weather conditions prevailing in the areas. Maximum and minimum values of biomass weight were obtained from Acc7010 (20200 kg/ha) and Acc5141 (8700 kg/ha) respectively at Selka whereas, at Sinana, the minimum and maximum values were recorded from Acc7673 and Dire, respectively (Supplementary Tables 1 and 3). Combined over locations data showed biomass weight ranged from 8525.0–18275.0 kg/ha−1 (). Alemayehu et al. (Citation2019), Mengistu et al. (Citation2016) and Mansouri et al. (Citation2018) reported similar result of wider genetic variation for biomass weight in durum wheat genotypes.
The magnitude of variation for combined over locations data showed wider variation for spike length (SPL) among studied accessions and it was ranged from 5.0–9.75 cm with the overall mean of 7.3 cm (). The shortest and the longest spike length were recorded from genotypes Acc242790 and Acc7010, respectively (Supplementary Table 5).
At Selka and Sinana, Harvest Index (HI) varied from 10.8–47.4 and 24.7–49.8 with the overall mean of 35.9 and 29.9, respectively (Supplementary Tables 7 and 8). At Selka, Obsa had the highest Harvest Index value (47.4) and genotype Acc7010 (10.85) was recorded the lowest value, while genotypes Acc5160 and Acc226694 had the lowest and highest Harvest Index values at Sinana site (Supplementary Tables 1 and 3). For combined data over locations, it also varied from 17.8–40.9 (). Basheer-Salimia and Atawnah (Citation2014) reported that improvements in HI associated with reduced height, therefore, account for more than 80% of the improvement in yield potential of wheat varieties within some twentieth century breeding programs.
Combined over locations data showed number kernels per spike (KPS) was varied from 25.1–46.7 with the overall mean value of 31.4 (). The maximum and minimum number was counted from Dire and Acc5591, respectively (Supplementary 5). At individual as well as for combined over locations, Dire recorded the highest value of all genotypes, and this indicates the stability of this genotype for this particular trait. At Sinana and Selka, KPS also ranged from 23–47 and 23–46.5, respectively (Supplementary Tables 7 and 8).
Number of number spikelet’s per spike (SPS) varied from 11.0–22.0 at Sinana while; it ranged from 13.0–24.5 at Selka. The mean value at Sinana and Selka were 16.5 and 16.9, respectively (Supplementary Tables 7 and 8). The highest number of number spikelet’s per spike was recorded from Dire (22.0) and the lowest was recorded from genotype Acc7295 (11.0) at Sinana (Supplementary Table 7) while, the highest and lowest was recorded from genotypes Acc7580 (24.5) and Acc5457 (13), respectively, at Selka (Supplementary Table 8). Also for combined over locations data this trait ranged from 14.0–22.2 (). Dreccer et al. (Citation2014) reported that, the mature wheat spike may contain 15 to 18 number spikelet’s per spike or more attached on alternating sides of the rachis.
The number of productive tillers (PTL) showed moderate variation among studied accession at both locations. This trait varied from 1–5 at Sinana and the same was true for Selka that ranged from 1–5 with the mean values of 2.9 and 2.6, respectively (Supplementary Tables 7 and 8). The minimum number of productive was recorded from genotype Acc242790 (1), and the maximum was recorded from genotype Acc7580 (5) at Sinana while; at Selka the minimum and maximum were recorded from genotypes Acc7576 (1) and Obsa (5) (Supplementary Table 1 and 3). Generally, the results of this study showed high variability in phenology, yield and yield-related traits among durum wheat accessions. Tillering capacity depends greatly upon variety and also depends on plant density Gooding et al. (Citation2002). Similarly, Mengistu et al. (Citation2016) reported the existence of wider variation of productive tillers/plant that ranged from 2.0–4.3 for durum wheat landraces.
3.2.4. Performance of landraces for processing quality and future breeding
Harvested grains from the two locations were used for laboratory analysis and performance for quality traits are presented in Supplementary Tables 2, 4 and 6 for Sinana, Selka and for combined data over locations, respectively. The range and mean values for the characters studied are shown in Supplementary Tables 7 and 8 for Sinana and Selka, respectively, while for combined data locations. ANOVA showed significance differences for genotypes interaction with locations for traits such as; hectoliter weight (HLW), wet gluten (WGL), and SDS-sedimentation. However, for traits such as, thousand kernel weight (TKW), vitreous (VTR), grain protein content (GPC), Zeleny Index (ZI), grain gluten (GGL) and ash content (ASC) did not show significance differences.
The combined data did not show significant variation for location genotypes enteraction for thousand kernel weight (TKW) indicates, slightly the performance of TKW was difference. The variability of accessions was also reflected in thousand kernel weight (TKW) trait, and it varied from 33.7–52.3 g with overall mean of 39.6 g for combined over locations. Twenty one accessions (45%) had produced thousand kernel weight (TKW) heavier than the grand mean value. Accession (Acc5152) was produced heavier thousand kernel weight (52.4 g) than checks and most of them showed competent with checks (). Also the mean values for this trait was varied from 33.5–54.5 g at Sinana whereas, it was varied from 32.3–50.3 g at Selka (Supplementary Tables 7 and 8). This result is in agreement with the report of Bemnet et al. (Citation2003) who reported TKW ranged from 33–50 g. Again Mengistu et al. (Citation2016) reported a wider range of TKW in durum wheat landraces.
The grand mean at Sinana, Selka as well as overall mean of combined data for hectoliter weight (HLW) was 79.2, 79.5 and 79.4 kg/hL, respectively. The mean range at Sinana varied from 70.0–86.4 kg/hL while, at Selka it ranged from 75.4–83.0 kg/L (Supplementary Tables 7 and 8) indicating there were ample variations among durum wheat genotypes for this trait. The highest hectoliter weight recorded from Dire at Sinana, Selka as well as for combined data over locations. Hectoliter weight is a primary factor in commercial grading of durum wheat because it is easy to measure and processing attributes such as semolina yield. This result is in agreement with the result reported by Wold et al. (2016) who reported the overall mean hectoliter weight of 80.06 kg/hL and the range was from 76.10–83.1 kg/hL.
The results of the vitreous (VTR) of studied genotypes showed highly significant differences was observed among the tested genotypes and it varied from 20.85–97.15% for combined data with the overall mean value of 86.5% and this range of variation showed the existence of variability for this trait. The minimum and maximum percent were recorded from Acc5591 and Acc242780, respectively (Supplementary Table 4). Most of accessions have more than 75% values which are good quality since it gives higher semolina yield during milling. The current result is in line with the result of Al-Saleh, A. and Brennan, C.S. (2012) who reported significant variation comparable to the present study with the mean value of 69%–95% for Syrian bread wheat varieties. Also Shimelis et al. (Citation2018) reported significant variation for vitreous.
Combined over locations data showed that, grain protein content (GPC) varied from 10.7–16.7% with the overall mean of 13.5% that recorded from genotypes Acc242787 and Acc7010 respectively (Supplementary Table 4). The range values of the grain protein content have sufficiently high values for most genotypes. Its scope determines that there is small number of genotypes with values below the minimum requirements for obtaining high-quality pasta. The determined values indicate that there is sufficient variability among genotypes and they are a source of variable genetic material. Protein is a fundamental quality test of durum wheat since it forms the basis for payment to farmers and is related to its end-product processing potential. The highest grain protein content was obtained from genotype Acc7010 (17.3%) while; the lowest was recorded from genotype Acc5152 (9.9%) at Sinana (Supplementary Table 2) whereas; the highest and lowest grain protein content was recorded from genotypes Acc7010 (16.2%) and Acc7647 (10.5%) respectively at Selka (Supplementary Table 4). The result is in line with Dragov et al. (Citation2022) who reported grains contain protein ranging from 14.5%–16.9% and again Konopka (2015) reported grain protein content varied from 11.6%–15.6% and was affected by cultivar and endosperm type. Generally, as different authors indicated that, protein quantity is influenced mainly by environmental factors and management factors, whereas the quality of the protein is largely genetically determine (Eagles et al. Citation2002).
Zeleny Index (ZI) value varied from 45.1–80.4 mL with mean values of 61.3 for combined data (). The highest value was recorded from genotype Acc7010 while, the lowest value was recorded from genotype Acc5152. In general, about 55% of genotypes recorded above 60% Zeleny Index indicated that good quality of genotypes for this trait (Supplementary Table 4). According some authors indicate zeleny value usually ranges from 0 to 80 mL and below 20 is generally regarded as unsuitable for baking and pasta making. Similarly Shimelis et al. (Citation2018) reported significant variation for zeleny index.
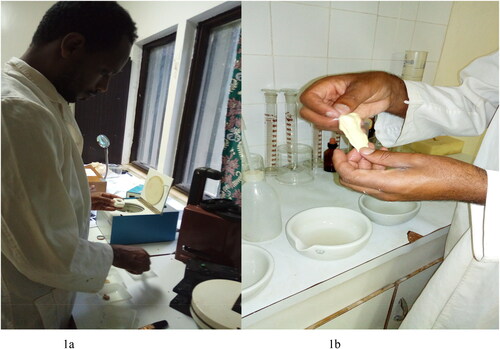
When the starch and the water soluble proteins are washed out of dough, the residual viscoelastic mass that remains water insoluble protein fractions is called gluten (). It is varied from 23.8%–35.9% at Sinana as well as 19.3%–37.4% at Selka with the mean values of 33.1% and 32.6%, respectively (Supplementary Tables 7 and 8), and the range indicates that there is variability for this traits. The highest values were recorded from genotypes Acc7665 and Acc8072 at Sinana and Selka, respectively (Supplementary Tables 2 and 4). Also for combined data, it varied from 24.7%–36.4% (). Those accessions scored high gluten percent allows an important firmness and stability to pasta after cooking whereas, pasta made with weak gluten semolina tends to deteriorate rapidly and become soft. Differences in wheat properties are mainly due to variations in structure, amount and proportion of the different gluten proteins (Moragues et al., Citation2006). Similarly Shimelis et al. (Citation2018) reported significant variation for wet gluten. Again, Mohammed et al. (2012) reported wet gluten (WGL) content of the genotypes ranged from 25.0%–33.5% in durum wheat. Also, Rharrabti et al. (Citation2003) reported substantial variability in gluten strength and baking performance among durum wheat varieties.
Figure 1. Residual viscoelastic mass water insoluble protein fractions (gluten).
Combined over locations data showed that ash content (ASC) value was ranged from 0.6–1.4g with the grand mean value of 1.1 gm (), and the minimum and maximum values were recorded from genotypes Acc5198 and Acc7010, respectively (Supplementary Table 6). Also it ranged from 0.7–1.5 g at Sinana and 0.5–1.5 g at Selka, respectively (Supplementary Tables 7 and 8). At Sinana, the overall mean value of ash content was slightly higher than at Selka, and this might arouse from the mineral content of the soil which maximize ash content at the site. The result is contradicted with Shimelis et al. (Citation2018) who reported non-significant variation for ash content among studied durum wheat.
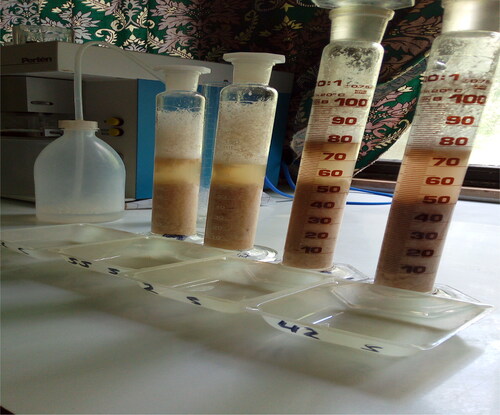
The SDS-sedimentation volume varied from 32.5–67.5 and 32.5–67.5 mL at Sinana and Selka with the mean values of 45.8 and 49.7 mL, respectively (Supplementary Tables 7 and 8). The observed significance differences among accessions for this quality trait indicated the presence of huge genetic variations among the tested accessions which in turn suggested that selection of lines with better quality would be possible within this germ-plasm. The genotype Acc7673 at Sinana and genotype Acc6974 at Selka recorded the minimum values whereas; genotype Acc7010 recorded the maximum value of SDS-sedimentation at both locations (Supplementary Tables 2 and 4). For combined data, it varied from 34.3–68.8 mL (). Totally the gluten strength assessment was done by sedimentation volume of whole grounded grain with protein detergent SDS-sedimentation (). Similarly Shimelis et al. (Citation2018) reported wider existence of durum wheat genotypes for this trait.
Figure 2. Sodium dodecyl sulphate (SDS) sedimentation.
3.3. Variance components and coefficients of variation
The twenty studied traits showed homogenous error variances and qualified for pooled analysis. All the characters exhibited accessions variance lower than that of the environmental variances (). The combined over locations estimates of phenotypic (σ2p), genotypic (σ2g) and environmental (σ2e) variances and phenotypic (PCV) and genotypic coefficients of variation (GCV) are given in , while for individual location the analyzed data are presented in Supplementary Tables 7 and 8.
A genotypic coefficient of variation (GCV) ranges from 0 for wet gluten (WGL) content to 16.4 for vitreous (VTR) as well as phenotypic coefficient of variation (PCV) ranges from 2.9 for hectoliter weight (HLW) to 27.1 for the productive tiller (PTL). The PCV values for traits such as hectoliter weight (HLW), days for heading (DH) and d for mature (DM), plant height (PLH), grain yield (GY) and thousand kernel weight (TKW) were slightly higher than that of GCV values (). For traits where the differences are smaller, it can be argued that the environment has not have a large impact and selection based on phenotypic expression can be very effective and may lead to genetic improvement of these traits. Narrower difference between the values of GCV and PCV indicated that the environmental effect was small for the expression of these traits, and they are controlled by additive gene effects (Hokrani et al., Citation2013; Mohammed et al., 2011). In contrast, the large differences in PCV and GCV show the large influence of the environment on the phenotypic expression of the other traits. Thus, the selection was not effective and should not be expected to genetically improve. Similarly, Alemayehu et al. (Citation2019) and Dawit et al. (Citation2012) also observed close difference between GCV and PCV value in durum wheat genotypes.
According to Sivasubramanian & Menon (Citation1973), GCV and PCV categorized as high (>20%), moderate (10%–20%) and low (<10%). Based on this classification, high values of PCV were recorded for characters such as biomass weight (22.9%), productive tillers (27.0%) and ash content (20.5%). Moderate PCV values were obtained for traits such as grain yield (GY), harvest index (HI), spike length (SPL), number of spikelet’s per spike (SPS), number of kernels per spike (KPS), thousand kernel weight (TKW), vitreous (VTR), grain protein content (GPC), zeleny index (ZI), grain gluten and SDS-sedimentation, whereas moderate GCV values were observed for biomass weight (BM), grain yield (GY), spike length (SPL), number of kernels per spike (SPS), productive tillers (PTL), vitreous (VTR) and ash content (ASC) (). High GCV and PCV suggest sufficient opportunities for selection of promising elite plants from a certain population for the trait. Alemayehu et al. (Citation2019) reported moderate GCV value for grain yield and biomass weight. Again Bhushan et al. (Citation2013) reported the higher magnitudes of GCV and PCV for grain yield and biomass weight, productive tillers and plant height, Dragov et al. (Citation2022) reported higher PCV number for the productivity tillering, and Malbhage et al. (Citation2020) reported moderate PCV value for the characteristics of grains number per main spike and thousand grain weight.
Low GCV and PCV values were obtained for traits such as days for heading (DH) and days for mature (DM), hectoliter weight (HLW), plant height (PLH), grain filling period (GFP) and wet gluten (WGL). Again with regard to GCV lower values was recorded for trait such as harvest index (HI), number of spikelet’s per spike (SPS), thousand kernel weight (TKW), grain protein content (GPC), zeleny Index (ZI), grain gluten (GGL) and SDS-sedimentation. For wet gluten, genotype × location interaction of GCV values was negative. This value number might be suggests that the error in the size of sampling. Since the exact estimate of these squared numbers cannot be negative, if they appear they are interpreted as being estimate of variance which is equal to zero (Miller et al., Citation1993). Low GCV and high PCV indicate the larger influence of environment on the expression of these traits and practically difficult for their improvement via direct selection and in single environments might rarely been effective. Low values indicate the need for creation of variability either by hybridization or mutation followed by selection (Tiwari et al., Citation2012). Similarly, Mayur (Citation2021) reported lower GCV for plant height, days for heading and days for mature and Dragov et al. (Citation2022) reported lower GCV value for wet gluten and number of grain per spike. Again, Graziani et al. (Citation2014) reported low PCV and GCV for plant height; Mohammed et al. (2011) for SDS-sedimentation, days for heading and Taneva et al. (Citation2019) reported low PCV values for wet gluten.
3.4. Heritability
Heritability is an important parameter in selection an effective method for improving genotypes. The selection of a single elite plant in early generations can be very effective for a trait that is highly inheritable compared to a trait that is less inheritable. Heritability estimate for characters under study for combined data is presented in . Dabholkar (Citation1992) classified H2 estimate as high (≥60%), moderate (30% to 60%) and low (≤30%). So based on this classification, days for heading (66.3%), plant height (61.1%), grain yield (86.6%), thousand kernel weight (75.2%), vitreous (75.8%) and ash content (61.5%) were recorded high broad-sense heritability values and this suggesting that, since genotypic variance was almost equal to phenotypic counterpart and characters were governed by additive genes and selection could be effective. Also it indicates the reliability with the genotype is to be recognized by its phenotypic expression. Again traits such as, days for mature (45.9%), grain filling period (42.2%), spike length (50.0%), number of kernels per spike (43.9%), hectoliter weight (44.5%), grain protein content (34.0%), Zeleny Index (41.6%) and grain gluten (49.9%) were recorded moderately high heritability broad-sense suggests that, these traits are still under genetic control and selection for these traits can be achieved through their phenotypic performance. Similarly, Graziani et al. (Citation2014), Mengistu et al. (Citation2016), Mansouri et al. (Citation2018) and Zaim et al. (2017) were reported the high heritability of days for heading, plant height, thousand kernel weight and grain yield. Additionally, Geneti et al. (Citation2022) and Mayur (Citation2021) found high heritability for days for heading, thousand kernel weight, for grain yield and for days for mature. On the other hand, Safi et al. (Citation2017) reported moderate heritability for grain filling period, number of spikelet’s per spike and spike length.
On the other hand, low heritability was recorded for characters such as SDS-sedimentation, biomass weight, Harvest Index, wet gluten, productive tillers and number of spikelet’s per spike suggesting that selection for these characters would not be effective due to predominant effects of non-additive genes in this population. This might be due to variations of influences of other characters on SDS-sedimentation trait. Generally, heritability is an indicator for transfer of traits from parents to its progeny. A similar result of low heritability of productive tillers was reported in durum wheat that was evaluated previously by Dawit et al. (Citation2012). Again, Mayur (Citation2021) reported lower heritability for SDS-sedimentation and Harvest Index whereas, Dragov et al. (Citation2022) for wet gluten content and González-Ribot et al. (Citation2017) reported low heritability values for number of spikelet’s per spike and for grain yield and Safi et al. (Citation2017) also reported low genetic gain for days for heading, days for mature, productive tiller, number of spikelet’s per spike.
3.5. Estimates of expected genetic advance
Expected genetic advance as percent of the mean was estimated based on the results of combined analysis over locations (). According to Johansen et al. (1955), genetic advances as a percentage of the mean (GAM) is classified as high (≥20%), moderate (10%–20%) and low (≤10%). Considering these ranges, high genetic advance estimates as percent of mean were recorded for grain yield (31.2%), vitreous (29.3%) and ash content (25.9%) (). Genetic advance is the improvement in the mean of selected family over the base population (Johnson et al., Citation1955), and he showed that high heritability should be accompanied by high genetic advance to arrive at more reliable conclusion for wheat improvement via selection. High estimate of these traits indicate that whenever we select the best 5% of genotypes as parent for a given trait, genotypic value of the new population for the traits will be improved highly.
Moderately high genetic advance as a percent of mean was obtained for thousand kernel weight (16.49%), biomass weight (11.81%), number of kernels per spike (15.38%), grain gluten (11.10%), spike length (16.32%), productive tillers (10.68%), and zeleny index (11.25%). This suggests that, these traits are primarily under genetic control and selection for these traits can be achieved through their phenotypic performance. However, low estimate of genetic advance as a percent of mean was observed for days for heading and days for mature, plant height, Harvest Index, grain filling period, number of spikelet’s per spike, hector liter weight, grain gluten, wet gluten and for SDS-sedimentation suggesting that, these traits are not under genetic control and direct selection for these traits are difficult through their phenotypic performance (). Arya et al. and Safi et al. (Citation2017) found the lowest genetic advance as percent of mean value for days to maturity (9.44%), days to heading and number spikelet’s per spike.
Characters such as grain yield, vitreous, ash content, thousand kernel weight, spike length, number of kernels per spike, grain gluten and Zeleny Index showed high to moderate broad-sense heritability coupled with high to moderate genetic advance. This indicates that, high heritability coupled with high genetic advance reveals the additive gene effects. The results are in accordance with Taneva et al. (Citation2019) who reported high heritability coupled with high genetic advance as percentage of mean for number of kernels per spike, thousand kernels weight and grain yield.
Lowest heritability coefficient coupled with lowest genetic advance was found for the traits such as SDS-sedimentation and wet gluten. The influence of non-additive gene actions in inheritance of these traits are prevailing and the effective selection of genotypes by phenotype in early generation will be not possible. Totally, high heritability coupled with high genetic advance as percentage of mean (GAM) are more useful than heritability alone in predicting the resultant effect during selection of best individual genotype. The lowest heritability coefficient coupled with lowest genetic advance was reported by Dawit et al. (Citation2012).
4. Conclusions
The analysis of variance for this experiment revealed that there were ample variations among durum wheat landraces for grain yield and quality traits. A large genetic variation was found among durum wheat genotypes for grain yield. Also wider ranges were observed for biomass weight, vitreous, SDS-sedimentation and grain protein content. Top five accessions with high protein content were recorded from genotypes Acc8010, Acc2211, Acc6933, Acc222393 and Acc5198. The genotype–environment interaction with predominantly larger PCVs than GCVs at all traits has been statistically significant. Slightly difference values were obtained between GCV and PCV for grain yield, days for heading, days for mature, plant height, thousand kernel weight and hectoliter weight indicating, slightly environmental effect on the expression of these traits and still they are under genetic control. Grain yield, vitreous, thousand kernel weight, days for mature, plant height and ash content are characterized by high heritability (h2BS%) over 60% and moderate to high genetic advance (GA %) over 10%. This indicating the possibility for effective selection of genotypes based on phenotypic expression in early generation and achieving rapid breeding progress. On the other hand, gluten index which are important traits both from agronomic and quality aspect are complex traits with low heritability and genetic advance as percent of mean and strong influence of environment.
Hence, from the present finding, it has been observed adequate existence of variability for most of the traits in the studied genotypes which need to be exploited in future durum wheat breeding in the studied area. Moreover, these findings should be supported by marker assisted selection for identification of gen of interest in durum wheat improvement.
Supplemental Material
Download MS Word (92.1 KB)Acknowledgements
First, my deepest and heartfelt gratitude goes to my major advisor, Bulti Tesso (PhD) and co-advisor Tesfaye Letta (PhD) for their guidance, assistance and support and encouragement throughout the entire period of this work. I would like to proudly thank the Oromia Agricultural Research Institute, Sinana Agricultural Research Centre (SARC), Agricultural Growth Program II (AGP II) and Delivering Genetic Gains in Wheat project (DGGW) for sponsoring and facilitating of this work. Also I would like to express my appreciation for staff members of cereal research team of SARC for their encouragement, collaboration and support through research activities. Last but not least, I would like to thank Haramaya University for providing available services and facilities needed for my research work.
Disclosure statement
No potential conflict of interest was reported by the author(s).
Additional information
Notes on contributors

Mulatu Aberra Ebsa
Mulatu Aberra Ebsa is research staff of crop improvement specifically cereal research department at Sinana Agricultural Research Center of Oromia Agricultural Research Institute, Ethiopia. He has undertaken applied research to enhance cereal crop productivity and production. Additionally, he has designed and conducted many experimental studies on field crops. He appreciates crop production under different agro-ecologies and encourages farmers to exploit the integrated potential of cultural practices to manage climate change and sustain productivity. He is involved in many national and international projects focusing on crop improvement along with different stakeholders
References
- Abinasa, M., Ayana, A., & Bultosa, G. (2011). Genetic variability, heritability and trait associations in durum wheat (Triticum turgidum L. var. durum) genotypes. African Journal of Agricultural Research, 6(17), 1–16.
- Abinasa, M., Ayana, A., & Bultosa, G. (2012). Variation and association of quality parameters in Ethiopian in durum wheat (Triticum turgidum L.) genotypes. International Journal of Plant Breeding and Genetics, 6(1), 17–31.
- Alemayehu, Z., Firew, M., Kebebew, A., & Zewdie, B. (2019). Variability in Ethiopian durum wheat under rain fed environment subjected to drought at anthesis. Ethiopian Journal of Agricultural Sciences, 29(2), 17–29.
- Alemu, A., Feyissa, T., Letta, T., & Abeyo, B. (2020). Genetic diversity and population structure analysis based on the high density SNP markers in Ethiopian durum wheat (Triticum turgidum ssp. durum). BMC Genetics, 21(1), 18. https://doi.org/10.1186/s12863-020-0825-x
- Allard, R. W. (1960). Principles of plant breeding. John Wiley and Sons. Inc.
- Almaz, B. (2017). Genetic variability and association of yield and yield related traits in advanced bread wheat (Triticum aestivum L.) lines in Eastern Ethiopia. [Masters of Science thesis] Haramaya University, Ethiopia.
- Al-Saleh, A., & Brennan, C. S. (2012). Bread wheat quality: some physical, chemical and rheological characteristics of Syrian and English bread wheat samples. Foods (Basel, Switzerland), 1(1), 3–17. https://doi.org/10.3390/foods1010003
- Amadou, T. S., Tiberio, C., Legesse, W., Seid-Ahmed, K., Rodomiro, O., Maarten, V. G., & Filippo, M. (2019). Durum wheat (Triticum durum desf.): Origin, cultivation and potential expansion in sub-Saharan Africa. Agronomy, 9(5), 263. https://doi.org/10.3390/agronomy9050263
- Annicchiarico, P., & Pecetti, L. (2003). Developing a tall durum wheat plant type for semi-arid, Mediterranean cereal-livestock farming systems. Field Crops Research, 80(2), 157–164. https://doi.org/10.1016/S0378-4290(02)00173-9
- Arya, S., Mishra, D., & Bornare, S. (2013). Screening genetic variability in advance lines for drought tolerance of bread wheat (Triticum aestivum). The Bioscan, 8(4), 1193–1196.
- Arya, V. K., Singh, J., Kumar, L., Sharma, A. K., Kumar, R., Kumar, P., & Chand, P. (2017). Character association and path coefficient analysis in wheat (Triticum aestivum L.). Indian Journal of Agricultural Research, 51(03) https://doi.org/10.18805/ijare.v51i03.7913
- Asmamaw, M., Keneni, G., & Tesfaye, K. (2019). Genetic diversity of Ethiopian durum wheat (Triticum durum Desf.) landrace collections as reveled by SSR markers. Advances in Crop Science and Technology, 07(01), 413. https://doi.org/10.4172/2329-8863.1000413
- Ayele, B., Solomon, G., Ammar, K., Nachit, M. M., & Abdalla, O. (2009). Overview of durum wheat research in Ethiopia: challenges and prospects. In Proceedings, Oral Papers and Posters, Technical Workshop, Borlaug Global Rust Initiative (pp. 143–149).
- Basheer-Salimia, R., & Atawnah, S. (2014). Morphological features, yield components and genetic relatedness of some wheat genotypes grown in Palestine. World Journal of Agricultural Research, 2(1), 12–21.
- Bemnet, G., Ameha, Y., Alemayehu, Z., Jemanesh, K., & Tekalign, T. (2003). Nitrogen Fertilizer effects on yield and grain quality of durum wheat. Tropical Agriculture, 80(2), 1–6.
- Bhushan, B., Bharti, S., Ojha, A., Pandey, M., Gourav, S. S., Tyagi, B. S., & Singh, G. (2013). Genetic variability, correlation coefficient and path analysis of some quantitative traits in bread wheat. Journal of Wheat Research, 5(1)
- Bonjean, A., Angus, W. J., & van Ginkel, M. (2011). The World Wheat Book, a History of Wheat Breeding.
- Burton, G. W., & Devane, D. E. (1953). Estimating heritability in tall fescue (Festuca arundinacea) from replicated clonal material. Agronomy Journal, 45(10), 478–481. https://doi.org/10.2134/agronj1953.00021962004500100005x
- CSA (Central Statistical Agency). (2018). Report on area and crop production forecast for major grain crops. Statistical Bulletins., 578, Addis Ababa.
- Dabholkar, A. R. (1992). Elements of biometrical genetics, concept publication (p. 431).
- Datta, S., & Das, L. (2014). Characterization and genetic variability analysis in Capsicum annuum L. germplasm. SAARC Journal of Agriculture, 11(1), 91–103. https://doi.org/10.3329/sja.v11i1.18387
- Dawit, T., Tadesse, D., Yigzaw, D., & Share, G. (2012). Genetic variability, correlation and path analysis in durum wheat germplasm (Triticum durum L.). Agricultural Research and Reviews, 107–112.
- Dragov, R., Uhr, Z., & Dimitrov, E. (2022). Genetic variability, heritability and genetic advance for important quantitative traits of durum wheat: Part I. Bulgaria Journal of Agricultural Science, 28(4), 691–698.
- Dreccer, M. F., Wockner, K. B., Palta, J. A., McIntyre, C. L., Borgognone, M. G., Bourgault, M., Reynolds, M., & Miralles, D. J. (2014). More fertile florets and grains per spike can be achieved at higher temperature in wheat lines with high spike biomass and sugar content at booting. Functional Plant Biology: FPB, 41(5), 482–495. https://doi.org/10.1071/FP13232
- Eagles, H. A., Hollamby, G. J., & Eastwood, R. F. (2002). Genetic and environmental variation for grain quality traits routinely evaluated in southern Australian wheat breeding programs. Australian Journal of Agricultural Research, 53(9), 1047–1057. https://doi.org/10.1071/AR02010
- EBI (Ethiopian Biodiversity Institute). (2008). Ethiopia: Second country report on the state of Plant Resource for Food and Agriculture (PGRFA) to Food and Agricultural Organization (FAO). Addis Ababa, Ethiopia. Available at http://www.pgrfa.org
- Fehr, W. (1987). Heterosis. In Principles of cultivar development. Theory and technique (vol. I, p. 115). Macmillan Publishing Company.
- Geneti, G. S., Kebede, S. A., & Mekonnen, T. B. (2022). Genetic variability and association of traits in bread wheat (Triticum aestivum L.) genotypes in Gechi district, South West Ethiopia. Advances in Agriculture, 2022, 1–17. https://doi.org/10.1155/2022/7132424
- Gomez, K. A., & Gomez, A. A. (1984). Statistical procedures for agricultural research (2nd ed.). John Wiley and Sons.
- González-Ribot, G., Opazo, M., Silva, P., & Acevedo, E. (2017). Traits explaining durum wheat yield in dry Chilean Mediterranean environments. Frontiers in Plant Science, 8, 1781. https://doi.org/10.3389/fpls.2017.01781
- Gooding, M. J., Pinyosinwat, A., & Ellis, R. H. (2002). Responses of wheat grain yield and quality to seed rate. The Journal of Agricultural Science, 138(3), 317–331. https://doi.org/10.1017/S0021859602002137
- Graziani, M., Maccaferri, M., Royo, C., Salvatorelli, F., & Tuberosa, R. (2014). Quantitative Trait Locas dissection of yield components and morpho-physiological traits in a durum wheat elite population tested in contrasting thermo-pluviometric conditions. Crop and Pasture Science, 65(1), 80–95. https://doi.org/10.1071/CP13349
- Haile, J. K., Hammer, K., Badebo, A., Nachit, M. M., & Röder, M. S. (2013). Genetic diversity assessment of Ethiopian tetraploid wheat landraces and improved durum wheat varieties using microsatellites and markers linked with stem rust resistance. Genetic Resources and Crop Evolution, 60(2), 513–527. https://doi.org/10.1007/s10722-012-9855-1
- Haile, D., Nigussie, D., & Amsalu, A. (2012). Nitrogen use efficiency of bread wheat: Effects of nitrogen rate and time of application. Journal of Soil Science and Plant Nutrition, 12(3), 389–409.
- Hokrani, H., Naik, R., Nadaf, H., Desai, S., Deshpande, S., Kalappanavar, I., & Patil, B. (2013). Genetic studies in free thresh able advanced segregating population of tetraploid wheat (Triticum dicoccum). Karnataka Journal Agricultural Sciences, 26(1), 10–13.
- ICC (International Association for Cereal Science and Technology). (2000). Standard methods of International Association for Cereal Science and Technology.
- Ijaz, F., Khaliq, I., & Shahzad, M. (2015). Estimation of heritability for some yield contributing traits in F 2 populations of bread wheat (Triticum aestivum L). Journal of Agriculture Research, 53(2), 25–30.
- International Grains Council (IGC). (2020). World Grain Statistics 2016. Available: https://www.igc.int/en/subscriptions/subscription.aspx (accessed May 21, 2020).
- Johnson, H. W., Robinson, H. F., & Comstock, R. F. (1955). Estimates of genetic and environmental variability in Soya bean. Agronomy Journal, 47(7), 314–318. https://doi.org/10.2134/agronj1955.00021962004700070009x
- Kabbaj, H., Sall, A. T., Al-Abdallat, A., Geleta, M., Amri, A., Filali-Maltouf, A., Belkadi, B., Ortiz, R., & Bassi, F. M. (2017). Genetic diversity within a global panel of durum wheat (Triticum durum) landraces and modern germplasm reveals the history of allele’s exchange. Frontiers in Plant Science, 8, 1277. https://doi.org/10.3389/fpls.2017.01277
- Konopka, I., Tańska, M., & Konopka, S. (2015). Differences of some chemicals and physical properties of winter wheat grain of mealy and vitreous appearance. Cereal Research Communications, 43(3), 470–480. https://doi.org/10.1556/CRC.2014.0048
- Lopes, M. S., El-Basyoni, I., Baenziger, P. S., Singh, S., Royo, C., Ozbek, K., Aktas, H., Ozer, E., Ozdemir, F., Manickavelu, A., Ban, T., & Vikram, P. (2015). Exploiting genetic diversity from landraces in wheat breeding for adaptation to climate change. Journal of Experimental Botany, 66(12), 3477–3486. https://doi.org/10.1093/jxb/erv122
- Majumder, D. A. N., Shamsuddin, A. K. M., Kabir, M. A., & Hassan, L. (1970). Genetic variability, correlated response and path analysis of yield and yield contributing traits of spring wheat. Journal of the Bangladesh Agricultural University, 6(2), 227–234. https://doi.org/10.3329/jbau.v6i2.4815
- Malbhage, A. B., Talpada, M. M., Shekhawat, V. S., & Mehta, D. R. (2020). Genetic variability, heritability and genetic advance in durum wheat (Triticum durum L.). Journal of Pharmacognosy and Phytochemistry, 9(4), 3233–3236.
- Manel, S., Leila, H., Abdelmalek, O., Amar, B., & Abdelkader, B. (2015). Phenotypic variability and selection agronomic characters of wheat hard (Triticum turgidum Desf.). Under Conditions Semi-Arid
- Mansouri, A., Oudjehih, B., Benbelkacem, A., Fellahi, Z. E. A., & Bouzerzour, H. (2018). Variation and relationships among agronomic traits in durum wheat (Triticum turgidum L.) under South mediterranean growth conditions: Stepwise and Path Analyses. International Journal of Agronomy, 2018, 1–11. https://doi.org/10.1155/2018/8191749
- Mayur, D., Abhay, D., Saiprasad, S. V., Divya, A., Prakash, M., Urmila, C., Neetu, Y., & Anshul, M. (2021). Genetic variability, heritability and genetic advance in durum wheat (Triticum durum) genotypes. The Pharma Innovation Journal, 10(9), 221–224. 2021 P:
- Mengistu, K., Kidane, G., Catellani, M., Frascaroli, E., Fadda, C., Pè, M. E., & Dell’Acqua, M. (2016). High density molecular characterization and association mapping in Ethiopian durum wheat landraces reveals high diversity and potential for wheat breeding. Plant Biotechnology Journal, 14(9), 1800–1812. https://doi.org/10.1111/pbi.12538
- Mengistu, D. K., Kidane, Y. G., Fadda, C., & Pè, M. E. (2018). Genetic diversity in Ethiopian durum wheat inferred from phenotypic variations. Plant Genetic Resources: Characterization and Utilization, 16(1), 39–49. https://doi.org/10.1017/S1479262116000393
- Miller, P. A., Williams, H. C., Robinson, H. F., & Comstock, R. E. (1993). Estimates of genotypic and environmental variances and co-variances in upland cotton and their implication in selection. Agronomy Journal, 43, 115–121.
- Mohammadi-Joo, S., Mirasi, A., Saeidi-Aboeshaghi, R., & Amiri, M. (2015). Evaluation of bread wheat (Triticum aestivum L.) genotypes based on resistance indices under field conditions. International Journal of Bioscience, 6(2), 331–337.
- Moragues, M., Zarco-Hernández, J., Moralejo, M. A., & Royo, C. (2006). Genetic diversity of protein subunits composition in durum wheat landraces (Triticum turgidum) from the Mediterranean basin. Genetic Resources and Crop Evolution, 53(5), 993–1002. https://doi.org/10.1007/s10722-004-7367-3
- Nwangburuk, C. C., & Denton, O. A. (2012). Inheritance of yield related traits in maize under normal and drought conditions. International Journal of Agricultural Research, 7(7), 367–375. https://doi.org/10.3923/ijar.2012.367.375
- Özbek, Ö., Taşkın, B. G., Şan, S. K., Eser, V., & Arslan, O. (2011). Gliadin polymorphism in Turkish cultivated emmer wheat landraces. Plant Systematics and Evolution, 296(1-2), 121–135. https://doi.org/10.1007/s00606-011-0481-8
- Rharrabti, Y., Villegas, D., Royo, C., Martos-Núñez, V., & García del Moral, L. F. (2003). Durum wheat quality in Mediterranean environments; Influence of climatic variables and relationships between quality parameters. Field Crops Research, 80(2), 133–140. https://doi.org/10.1016/S0378-4290(02)00177-6
- Saeed, M., Khalil, I., Nayab, D., Anjum, S., & Tanveer, M. (2016). Combining ability and heritability for yield traits in wheat (Triticum aestivum L.). Pakistan Journal of Agricultural Sciences, 53(03), 577–583. https://doi.org/10.21162/PAKJAS/16.2036
- Safi, L., Singh, R., & Abraham, T. (2017). Assessment of Heritability and Genetic Parameters in Wheat Based on Agronomic and Morphological Traits, 6(5), 18–21.
- SAS (Statistical Analysis System) Institute. (2002). SAS System for windows, Version 9.00.
- Shimelis, Y., Mohammed, W., & Letta, T. (2018). Genetic variability and diversity studies in Durum wheat (Triticum turgidum L. var. durum) genotypes based on cluster analysis using agronomic and quality traits in Southern Ethiopia. Journal of Plant Breeding and Crop Science, 10(5), 99–104.
- Sivasubramanian, S., & Menon, M. (1973). Heterosis and in breeding depression in rice. Madras Agricultural Journal, 60(7), 1139–1140.
- Sopiwnyk, E. (2018). Durum production and consumption, a global perspective. In Sustainable Production of Durum Wheat in Canada (pp. 5–9). Barilla America Inc.
- Soriano, J. M., Villegas, D., Sorrells, M. E., & Royo, C. (2018). Durum wheat landraces from east and west regions of the Mediterranean basin are genetically distinct for yield components and phenology. Frontiers in Plant Science, 9, 80. https://doi.org/10.3389/fpls.2018.00080
- Stamatov, S., Andonov, B., Chipilski, R., & Deshev, M. (2018). Genetic variability and genetic advance of the parameters of water exchange in peanut varieties (Arachis hypogaea L.) from the Bulgarian Selection. JOJ Horticulture & Arboriculture, 1(3), 555563. IDhttps://doi.org/10.19080/JOJHA.2018.01.555563
- Stamatov, S., Ishpekov, S., Deshev, M., Vankova, E., & Dallev, M. (2020). Seed retaining model of non-dehiscence sesame (Sesamum indicum L.) Genotype at Ripening. Scientific Papers. Series A. Agronomy, 63(1), 541–546.
- Taneva, K., Bozhanova, V., & Petrova, I. (2019). Variability, heritability and genetic advance of some grain quality traits and grain yield in durum wheat genotypes. Bulgarian Journal of Agricultural Science, 25(2), 288–295.
- Temesgen, D., Behailu, M., Teklehaimanot, H., Mulatu, G., Rodomiro, O., & Kassahun, T. (2023). Genetic diversity of durum wheat (Triticum turgidum L. ssp. durum, Desf) germplasm as revealed by morphological and SSR markers. Genes, 14(6), 1155.
- Tesfaye, T., Getachew, B., & Worede, M. (2008). Morphological diversity in tetraploid wheat Landrace populations from the central highlands of Ethiopia. Hereditas, 114(2), 171–176. https://doi.org/10.1111/j.1601-5223.1991.tb00321.x
- Tilahun, G., Feyissa, T., Kedir, N., Genene, G., Habtamu, S., Ashinie, B., & Abdo, W. (2008). Recommendations of production management practices. In: Fifteen years achievements. Oromia Agricultural Research Institute, Sinana Agricultural Research Center (pp. 39–46).
- Tiwari, D., Pandey, P., Tripathi, S., Giri, S., & Dwivedi, J. (2012). Studies on genetic variability for yield components in rice (Oryza sativa L.). AAB Bioflux, 3(1), 76–81.
- USDA. (2021). United States Department of Agriculture. https://apps.fas.usda.gov/psdonline/circulars/production.pdf
- Verma, P. N., Singh, B. N., & Yadav, R. K. (2013). Genetic variability and divergence analysis of yield and its contributing traits under sodic soil condition in wheat. International Journal of Agricultural Sciences, 3(2), 395–399.
- Wolde, T., Eticha, F., Alamerew, S., Assefa, E., & Dutamo, D. (2016). Genetic variability, heritability and genetic advance for yield and yield related traits in durum wheat (Triticum durum L.) accessions. Sky J. Agril. Res, 5(3), 42–47.
- Zaïm, M., El Hassouni, K., Gamba, F., Filali-Maltouf, A., Belkadi, B., Sourour, A., Amri, A., Nachit, M., Taghouti, M., & Bassi, F. M. (2017). Wide crosses of durum wheat (Triticum durum Desf.) reveal good disease resistance, yield stability and industrial quality across Mediterranean sites. Field Crops Research, 214, 219–227. https://doi.org/10.1016/j.fcr.2017.09.007