
 ?Mathematical formulae have been encoded as MathML and are displayed in this HTML version using MathJax in order to improve their display. Uncheck the box to turn MathJax off. This feature requires Javascript. Click on a formula to zoom.
Abstract
Post-harvest losses occur during storage mainly due to spills, fungal contamination, and pest damage. Therefore, this study was carried out to evaluate the effect of post-harvest management and sanitation practices by grain traders on the quality of stored grains in Kenya. A total of 342 grain traders, distributed among three counties, namely Nairobi, Embu, and Machakos, were interviewed using a semi-structured questionnaire. Maize and common beans were the main crops stored in trader’s stores. Most of the traders obtained grains from the retail brokers (39.9%) and most of the grain stores were rented (73.3%). Traders sold stocks of grains less than a month and in the first three months. The grain traders used mainly propylene bags (>84%) and bought new propylene bags for the new stock (51%). The highest proportion of grains was sold to individual consumers or local retailers. Grain sampling followed by sorting and drying were the main procedures carried out within the traders’ stores after receiving new stock. In case of deteriorated grains caused by fungal infection, insect, or other factors, most traders immediately sold the grains while other traders sold to animal feed manufacturers. Most traders had knowledge of grain standards, but more than 95% of them used their own standards to grade their grains, and < 3% of the traders used East African grain standards. Inspection of insects infestation in stores by traders was ranked first (95.4%) followed by rodents (71.7%) and mold contamination (42.5%). These findings highlight the intervention needed in the practices of grain traders to reduce food losses.
1. Introduction
With a growing population across the world, food demand is increasing rapidly, which is turning out to be a major problem for mankind. To feed the world’s population by 2050, an estimated 70% increase in food production is needed (Godfray et al., Citation2010). The increase is expected to be higher in developing countries due to increased urbanization. This will predispose a majority of the population to food insecurity, whereby some have already faced starvation and famine (Hodges et al., Citation2011). In recent years, most developing countries have formulated policies to cope with the increase in food demand. This includes policies on ways to control population growth and improve agricultural land use. Losses after harvest are crucial, although they are not given the required consideration, since they have been assigned below 5% of research funding (Kitinoja et al., Citation2011).
Over the years, countries with inadequate food supply and poverty tend to be more concerned about the international and domestic food situation (World Bank, Citation2011). Food security has been a constant concern in food production and distribution. A critical source of alarm is the extent of post-harvest food waste documented in most developing countries. It is necessary to integrate the proper management of post-harvest practices to reduce losses. According to Lipinski et al. (Citation2013), proper management of food production and after-harvest handling of food have the capacity to feed approximately 9.5 billion people by 2050. This is in line with conserving the ecosystem in a way that promotes social and economic growth. However, with increasing food production, the correlation with lowering waste will be untenable (Bourne, Citation2014).
Some sanitation practices include cleaning the store to remove dust and grain from the previous season and clearing the surrounding grounds, which can harbor pests, such as insects, weeds and debris. Furthermore, the sorting of grains by age during storage, the careful stacking of grain sacks to minimize grain kernel breakage and proper aeration will ensure proper grain storage with appropriate cost control (Pattanaik & Tripathi, Citation2016; Mwangi et al., Citation2017). According to Wilkin and Rowlands (Citation1988), grain storage in large volumes restricts detection and dealing with infestations in many stores (Compton et al., Citation1998). Inspection to identify pest sources and sanitation problems can be achieved by removing broken kernels, grain dust and weed seed resulting from multiple handling (Mwangi et al., Citation2017; Makinya et al., Citation2021).
Observing good hygiene practices and modification of storage facility conditions that are unfavorable to the thriving or survival of stored grain insect pests can prevent initial infestation or slow the multiplication of the existing pest population in the stores (Kader, Citation2005). Monitoring helps to know the dynamics of the pest population, while assessment provides knowledge of pest density and distribution. Post-harvest pests attribute the highest cause of food loss in quantity and quality to stored grains in sub-Saharan Africa (Tefera, Citation2012).
To implement sanitation tactics, the evaluation of grains and storage areas is a key factor (DiVittorio, Citation2015). Operation involved in removing dirt and drying grains before keeping them in reserve could result in reduced losses by bounds of 4.5% and 7.9%, respectively, since they help minimize fungus contamination and the prevalence of pests in the grain piles (Golob, Citation2009). The estimate of most grain losses in farm stores is 13.3%, which is attributed to insects and rodents at 8.6% and 4.7%, respectively (Edoh-Ognakosanet et al., Citation2016). In recent studies conducted in Kenya, De Groote et al. (Citation2023) reported a total of 36% loss in farm maize storage due to maize weevils and larger grain borer.
To implement effective integrated pest management programs for stored products, hygiene and adequate sanitation in the food facility are paramount. This goes a long way from the field to after harvest across the supply chain. Maintaining high-standard hygiene strategies reduces insect infestation. Sanitation is interrelated with other means of controlling pests. Therefore, poor sanitation reduces the effectiveness of other pest control strategies, such as cultural, physical, and chemical. It is of paramount importance that those who manage food storage areas pay great attention to sanitation. This will help increase the effectiveness of a wide variety of pest control methods (Abbass et al., Citation2014).
To ensure sustainability in food production, it is essential to prevent the loss of harvested food. This will promote safety and preserve the nutritional quality of the harvested grains. Hygiene in storage encompasses grain cleanliness or grain purity, cleanliness in the storage facility, and nearby areas (Toews & Subramanyam, Citation2002). Grain cleaning is described as the procedure to isolate broken grains, husks, chaff, gravel, soil, and weed seeds from healthy kernels (Kumar & Kalita, Citation2017). Poor cleaning of grains can hinder drying, which encourages food safety hazards. Therefore, damaged and poorly dried grains increase the risk of mould infection and mycotoxins contamination. Good sanitation practices will help reduce the abundance of pests in stored grains. Most studies focused on grain storage practices by farmers; however, information on storage and sanitation practices by grain traders in Africa is scarce. Therefore, the objective of this study was to assess the post-harvest management and sanitation practices of maize and beans traders in Kenya. We hypothesize that the post-harvest management and sanitation practices of grain traders can affect grain quality, and food losses in grain stores.
2. Materials and methods
2.1. Description of the study area
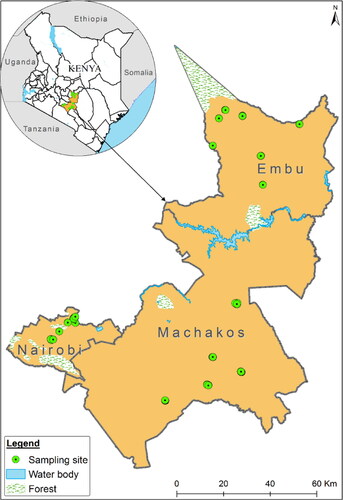
The survey to determine the impact of sanitation and pest management practices on grain quality and pest proliferation in retail stores was carried out in Kenya, in three counties, namely: Nairobi, Embu, and Machakos (). Nairobi has a fairly cool climate resulting from its high altitude (1800 m.a.s.l.). Temperatures range from a minimum of 10 °C to a maximum of 29 °C. The county has a bimodal rainfall pattern with long rains occurring between March and May. Embu county has two agroclimatic characterized by highlands and lowlands. The rainfall pattern is bimodal with long rainfalls between March and June, while short rains occur between October and December. Machakos county experiences erratic and unpredictable rains of less than 500 mm per year. The prevailing local climate is semi-arid and the landscape is hilly, rising from an altitude of 1,000 to 1,600 m.a.s.l.
Figure 1. Map of the grain traders study sites in three counties in Kenya.
2.2. Sample size determination and data collection
A representative sample of grain traders from different markets within the three counties was randomly selected for data collection. The administration of questionnaires was the main method of data collection, in order to obtain information from the stores of traders. The choice of using questionnaires helped to provide a precise presentation of the responses. The researcher could gather in-depth information on the statistical data using the questionnaires. Since there was no comprehensive list of all grain traders’ stores in; Nairobi, Machakos and Embu counties. The sample size for the survey was determined using the formula of Cochran (Citation1977).
where n0 is the sample size, Z2 is the abscissa of the normal curve that cuts off an area α at the tails (1 – α) is equivalent to the desired confidence level like at 95%), e is the desired level of precision, p is the estimated proportion of an attribute that is present in the population, and q is 1-p.
The value of Z is found in statistical tables that contain the area under the normal curve. For example; Z = 1.96 for a level of confidence of 95%.
Using Cochran’s formulae, the sample size calculated for unknown populations is 385. The target population for traders within the three counties was 3000 and the sample size was calculated by adjusting the Cochran formula to reduce the sample size to 342, which was distributed among the three counties. Information about storage facilities after harvest practices, sanitation, and storage problems was collected using semi-structured questionnaires (Appendix A) in combination with a checklist to assess sanitation levels in the stores of traders.
The questions formulated helped to obtain the following information: demographic and socioeconomic characteristics of the traders or store owners, such as gender, age, level of education, years in business, location, and ownership. Information on knowledge, attitude and practices (KAP) related to sanitation and post-harvest pest management was also covered in the trader’s stores, as well as issues related to grain quality and pricing.
2.3. Statistical analysis
The survey design for the collection of data in the field used the Open Data Kit (ODK), where a template of questionnaires was created and then uploaded to a cloud server. In the field, the data was collected using tablets installed with ODK collect. After data collection, completed questionnaires were imported into an Excel spreadsheet for data management and coding. Data collected were analyzed using a descriptive statistical technique that includes tables, pie charts, and percentages. Data analysis was performed using the Statistical Package for Social Sciences (SPSS) program version 20 where means were separated using the least significant difference test (LSD test) at a confidence level of 95%. Differences within counties and also within the overall sample were established using the Chi-square test, which was paired together with pair wise contrast using ‘chisq. Multcomp’ operates with a Bonferroni p-value modification within the RV Aide Memoire package in the R three.5.1 software.
3. Results
3.1. Socio-demographic characteristics of grain traders
Significantly higher (χ2 (2) =119.08, p < 0.001) proportion of female traders (67.5%) was recorded in the three counties (). The age of grain traders varied (χ2 (2) = 70.155, p < 0.001) between the counties, with the majority of the respondents (87%) less than 55 years old while only 12.4% over 55 years old. More than 50%of the traders in Nairobi were between 18 and 35 years old, while in Machakos, more than50% of the traders were between 35 and 55 years old. Most of the traders (42.8%) completed secondary education (χ2 (5) = 661.57, p < 0.001), while about 20% completed primary education and only 2.3% had no formal education. More than 50% of traders were in the grain business for 3–10 years, while very few (6.3%) were in the grain business for more than 20 years.
Table 1. Socio-demography of grain traders in Nairobi, Machakos and Embu in Kenya.
3.2. Grain handling and storage practices
In the stores of the traders, the following types of grains were stored, namely, sorghum, wheat, millet, rice, common bean, cowpea, green gram, groundnut, diolichos and pigeon pea. The most common (χ2 (1) = 603.24, p < 0.001) grains across the counties were maize (98.4%) and common bean (94.3%) followed by green gram (88.2%) and cowpea (72.1%). Groundnut and dolichos were the least (<15%) common grains in the traders’ stores. The stocking of rice and groundnuts in the Machakos store was significantly lower compared to Nairobi and Embu ().
Table 2. Type of grain stored, source of grains, ownership and storage time of grains in traders’ stores in Nairobi, Machakos and Embu in Kenya.
Significant (χ2 (5) = 346.5, p < 0.001) proportion of traders sourced grains from retail brokers (39.9%) or uncontracted farmers in combination with retail traders (39.9%), while only very few (0.57%) traders sourced grains from farmer cooperatives. Almost all grain stores in Nairobi and Machakos counties (χ2 (2) = 14.851, p < 0.001) were rented while more than half of the traders stores in Embu county were owned by the government (). The majority of the grains were sold in less than a month (44.8%) and in the first 3 months (45.4%), while only a few (9.8%) stocks of the grains were sold beyond 3 months ().
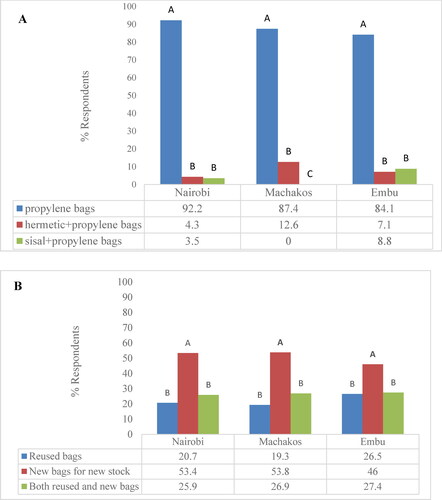
Most of the grain traders in the three counties used mainly propylene bags (>84%) to store their grains (). The number of traders who used propylene bags were (χ2 (2) = 467.66, p < 0.001) higher than the number of traders who used hermetic or sisal bags in combination with propylene bags. None of the traders in Embu county used sisal bags to store their grains (). There was significant difference (χ2 (2) = 50.81, p < 0.001) between traders who used new propylene bags for new stock compared to those who used reused bags or reused bags in combination with new propylene bags. In Nairobi and Machakos counties, more than half of the traders bought new propylene bags with new stock, unlike in Embu where the proportion of traders who used reused bags and both reused and new bags exceeds the proportion of those who bought new propylene bags for new stock ().
Figure 2. (A) Grain traders storage structure used for grain storage; (B) Bags used for new grain stock in Nairobi, Machakos and Embu in Kenya.
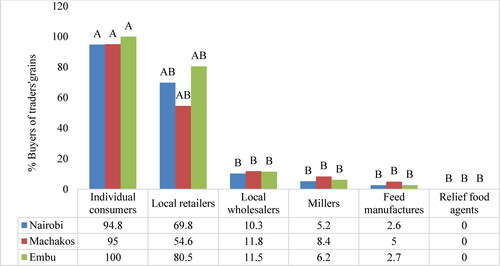
Significantly higher (χ2 (1) = 301.66, p < 0.001) grains was sold to individual consumers (>90%) or local retailers (>55%). Only a few traders (15%) sold to feed manufacturers, millers, or local wholesalers. In the three counties, none of the traders sold their grains to relief food agents ().
Figure 3. Buyers of traders’ grains in Nairobi, Machakos and Embu in Kenya.
Consumer demand was significant (χ2 (1) = 97.287, p < 0.001) determiner of the price of grain resale price followed by grain quality and contractual agreement (). Majority (87.6%) of the traders did sampling (χ2 (4) = 381.54, p < 0.001) of their new grain stock before buying it for resale. Sorting (69%) was the second most common procedure performed by traders. Rebagging (33.9%) was not common, since most grain traders used new propylene bags for new stock. Drying (21.3%) was the least practiced procedure among grain traders in the three counties ().
Figure 4. Determinants of resale price of traders’ grains in Nairobi, Machakos and Embu in Kenya.
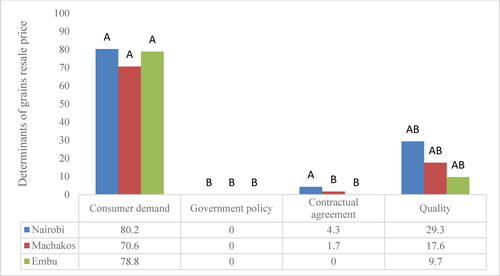
Table 3. Procedures used by grain traders for incoming new grain stock in Nairobi, Machakos and Embu in Kenya.
The grains in the stores of traders after some time could show signs of deterioration caused by fungal and insect infestation, rodents, and damage during handling processes. Most traders sold grains immediately (45.7%) (χ2 (4) = 208.01, p < 0.001) or sold to animal feed manufacturers (27%). The donation of deteriorated grains was minimal (0.2%); however, in Machakos, traders donated deteriorated grains to poultry farmers ().
Table 4. Grain trader’s practices with deteriorated grains in stores in Nairobi, Machakos and Embu in Kenya.
3.3. Knowledge of grain standards and grain inspection practices by traders
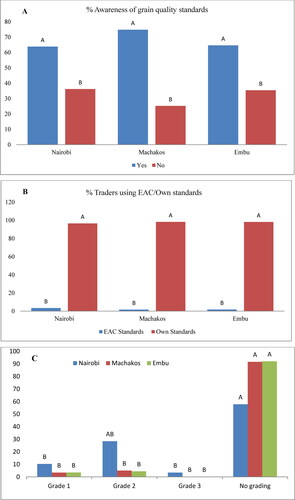
Most of the traders in Machakos (74%), Embu (64%) and Nairobi (63%) confirmed that they knew about the grain standards (). However, more than 95% of traders used their own standards to grade their grains compared to less than 3% of traders who used East African grain standards to grade their grains (). Furthermore, 92% grain traders in Embu and 91% in Machakos, did not grade their grains (). In Nairobi, 57% of grain traders did not grade their grains.
Figure 5. (A) Whether traders are aware of grain quality standards (B) those traders who use own or EAC standards, and (C) those who use different quality grades (Grade 1, Grade 2, Grade3) in Nairobi, Machakos and Embu in Kenya.
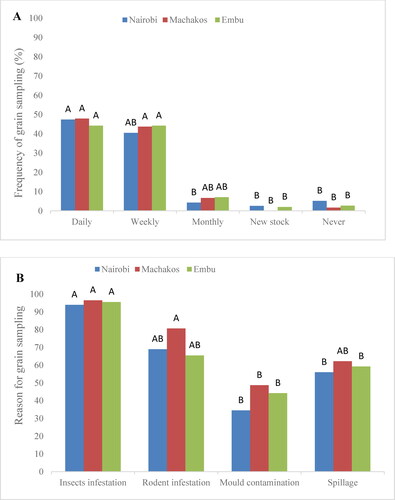
The inspection of grains by the traders within the stores was carried out mainly daily or within two weeks, mostly because the stock of most of the traders lasted for a period not exceeding a month after purchase (). In the three counties, most of the traders (90%) inspected the grains for insect infestation followed by rodent infestation (65%) and mould contamination (42.5%) ().
Figure 6. (A) Reason for sampling and (B) frequency of sampling grain by grain traders in Nairobi, Machakos and Embu in Kenya.
4. Discussion
Our study demonstrated that most traders could not store grains for more than three months due to insect pest infestations. The study revealed that grain traders practice poor post-harvest management during storage, which contributes greatly to post-harvest losses. Therefore, sanitation practices should be encouraged in grain stores to minimize grain infestation bypost-harvest pests. During storage, a study has reported that it is when the highest grain losses occur; therefore, storage plays an essential role in the food chain (Aulakh et al., Citation2013).
Procedures used by most grain traders for incoming newgrain stocks include sampling, sorting, drying, and rebagging. However, very few grain traders (7%) practice no procedures for incoming new grains stock, indicating that different procedures were carried out within the traders’ stores after receiving new stock. Most grain trading facilities must improve sanitation, as it affects grain quality through pest infestation (Makinya et al., Citation2021). The presence of insect pests is associated with a reduction in the quantity and quality of stored grains due to high temperatures and humidity. Unsafe storage settings increase the likelihood of grain damage (Befikadu, Citation2014; Garbaba et al., Citation2018; Taddese et al., Citation2020; Mesele et al., Citation2022).
This study revealed that polypropylene bags were commonly used, which is in line with the findings of Mwangi et al. (Citation2017). This is because they were cheaper and easier to access compared to hermetic bags. Polypropylene bag storage was the most common mode of grain storage. This could be linked to adaptability, simplicity of movement, sale, and inspection. Due to ease of availability and the low price of woven propylene bags, they were more popular and widely used compared to other types of bags, such as sisal bags (Mwangi et al., Citation2017; Mesele et al., Citation2022).
The bulk storage of grains was not common in the three counties, as the stocks lasted less than three months. Hodges et al. (Citation2011) reported that bulk storage structures were rare, which could be associated with increased construction costs, maintenance, and increased funds required for stocking. Several retailers used new propylene and recycled bags for new stock, which could contribute to a rising incidence of insect infestation. According to Tavuringa et al. (Citation2014), grain remains or older grain reserves carried forward from previous seasons give rise to ideal sites for reproduction. This may cause an infestation of insects from newly stocked grains. Therefore, cleaning the storage facility would depress the breeding of pests (Kiaya, Citation2014).
The grains in the stores of traders after some time showed signs of deterioration due to insects, rodents, fungi and damage during the handling process. This increased susceptibility to grain damage from pests and chemical degradation that reduces grain quality. In the three counties where the survey was conducted, the main determiner of the resale price of grains was consumer demand followed by grain quality. Government policy had no influence on resale price. This means that consumer tastes and preferences, such as sorted clean grains, had a great impact on the resale price; hence, the higher the preference of a certain grain types by consumers, the higher the retail price, and vice versa.
In most stores, the first procedure for traders was to sample the grains after receiving new stock. This was done to ensure that the grains were clean and without insect infestation. This could have been influenced by storage time, as Nairobi traders had their grains restocked in less than a month. Drying was the last among the traders in the three counties, because the traders had their way of ensuring that the grains purchased were properly dried. For example, in maize, traders used their teeth to bite the kernel to give a loud snap when dried. For other grains, traders thrust their arm into the open grain sack, and if it entered up to the elbow, the grain was dry. Since grain drying has a great influence on grain quality, failure to dry the grains after receiving them in the stock could have contributed to the higher moisture content in stored grains (Coradi et al., Citation2015; Garbaba et al., Citation2018; Moraes et al., Citation2023). Therefore, in some cases, grains placed directly on the floor in the absence of raised pallets reabsorbed the wetness of damp floors, causing molds. The present study showed that most of the traders in the study districts had knowledge of grain standards, but more than 95% of them used their own standards to grade their grains while only <3% of traders used East African grain standards. Furthermore, the majority of grain traders did not grade their grains, which could be due to the inadequate technical knowledge and time consuming nature of grain standards. Recently there have been efforts in using modern instruments and artificial intelligence to inspect grain quality. For example, recent studies by de Oliveira Carneiro et al. (Citation2023) demonstrated that near-infrared spectroscopy and machine learning models were effectively used to characterize whole and defective rice grains. Furthermore, Leal et al. (Citation2023) reported prediction of dry matter loss of stored wheat grain mass using artificial neural networks and multiple linear regression model. Jaques et al. (Citation2022) developed portable equipment that can be used for the monitoring the quality of bulk grain transport of soybean.
5. Conclusions
Our study revealed that majority of traders used propylene bags (>84%) and bought new propylene bags for the new stock (51%), and most grain traders sell out their grains in less than three months of storage due to the lack of proper sanitation practices that predispose grains to infestation by pests in storage. Extending grain storage for more than three months of storage is important in terms of ensuring a continuous supply of grain to the market; however, maintaining grain quality during this extended storage will require extra care and management by grain traders.
Grain storage sanitation prevents molds, insects, and fungi becoming a problem and helps to avoid grain losses both in quality and quantity. Grain traders should be trained in proper grain handling and storage practices that require a deep understanding of the best practice for storage hygiene and monitoring. These practices can be implemented through government grain storage policies.
The study findings show that most grain traders (over 63%) were aware of grain quality standards more than 95% of them used their own standards to grade the grains according to physical damage, color and grain size while only <3% of the traders used East African grain standards. There was no motivation shown by the traders to follow regional/national grain quality standards, which requires further investigations.
Disclosure statement
The authors declare that they have no known competing financial interests or personal relationships that could have appeared to influence the work reported in this paper.
Data availability statement
Data will be made available on request.
Additional information
Funding
References
- Abass, A. B., Ndunguru, G., Mamiro, P., Alenkhe, B., Mlingi, N., & Bekunda, M. (2014). Postharvest food losses in a maize-based farming system of semi-arid savannah area of Tanzania. Journal of Stored Products Research, 57, 1–16. https://doi.org/10.1016/j.jspr.2013.12.004
- Aulakh, J., Regmi, A., Fulton, J. R., & Alexander, C. E. (2013). Estimating post-harvest food losses: Developing a consistent global estimation framework [Paper presentation]. 2013 Annual Meeting, August 4-6, 2013, Washington, DC, Agricultural and Applied Economics Association.
- Befikadu, D. (2014). Factors affecting quality of grain stored in Ethiopian traditional storage structures and opportunities for improvement. International Journal of Sciences: Basic and Applied Research, 18, 1–17.
- Bourne, M. C. (2014). Food security: Postharvest losses. In N. K. V. Alfen (Ed.), Encyclopedia of agriculture and food systems (pp. 338–351). Academic Press.
- Coradi, P. C., de Lacerda Filho, A. F., Chaves, J. B. P., & Mota, T. O. (2015). Loss of dry matter in grain corn stored under different conditions and effects on quality. Revista Brasileira de Tecnologia Agroindustrial, 9(1), 1757–1770. https://doi.org/10.3895/rbta.v9n1.1868
- Compton, J. A. F., Floyd, S., Magrath, P. A., Addo, S., Gbedevi, S. R., Agbo, B., Bokor, G., Amekupe, S., Motey, Z., Penni, H., & Kumi, S. (1998). Involving grain traders in determining the effect of postharvest insect damage on the price of maize in African markets. Crop Protection. 17(6), 483–489. https://doi.org/10.1016/S0261-2194(98)00041-6
- Cochran, W. G. (1977). Sampling techniques (3rd ed.). John Wiley & Sons.
- de Oliveira Carneiro, L., Coradi, P. C., Rodrigues, D. M., Lima, R. E., Teodoro, L. P. R., Santos de Moraes, R., Teodoro, P. E., Nunes, M. T., Leal, M. M., Lopes, L. R., Vendrusculo, T. A., Robattini, J. C., Soares, A. H., & dos Santos Bilhalva, N. (2023). Characterizing and predicting the quality of milled rice grains using machine learning models. AgriEngineering, 5(3), 1196–1215. https://doi.org/10.3390/agriengineering5030076
- DiVittorio, J. (2015). Pest prevention through equipment inspection and cleaning. Crops & Soils, 48(4), 34–38. https://doi.org/10.2134/cs2015-48-4-11
- De Groote, H., Muteti, F. N., & Bruce, A. Y. (2023). On-farm storage loss estimates of maize in Kenya using community survey methods. Journal of Stored Products Research, 102(2023), 102107. https://doi.org/10.1016/j.jspr.2023.102107
- Edoh Ognakossan, K., Affognon, H. D., Mutungi, C. M., Sila, D. N., Midingoyi, S. G., & Owino, W. O. (2016). On-farm maize storage systems and rodent postharvest losses in six maize growing agroecological zones of Kenya. Food Security, 8(6), 1169–1189. https://doi.org/10.1007/s12571-016-0618-2
- Garbaba, A. G., Denboba, L. G., Mendesil, E., Ocho, F. L., & Hensel, O. (2018). Actors’ post-harvest maize handling practices and allied mycoflora epidemiology in southwestern Ethiopia: Potential for mycotoxin-producing fungi management. Journal of Applied Botany and Food Quality, 91, 237–248.
- Godfray, H. C. J., Beddington, J. R., Crute, I. R., Haddad, L., Lawrence, D., Muir, J. F., Pretty, J., Robinson, S., Thomas, S. M., & Toulmin, C. (2010). Food security: The challenge of feeding 9 billion people. Science, 327(5967), 812–818. https://doi.org/10.1126/science.1185383
- Golob, P. (2009). On-farm post-harvest management of food grains: A manual for extension workers with special reference to Africa (R. Boxall & S. Gallat, Eds.). Food and Agriculture Organization of the United Nations.
- Hodges, R. J., Buzby, J. C., & Bennett, B. (2011). Postharvest losses and waste in developed and less developed countries: Opportunities to improve resource use. The Journal of Agricultural Science, 149(S1), 37–45. https://doi.org/10.1017/S0021859610000936
- Hodges, R., Bernard, M., & Rembold, F. (2014). APHLIS-postharvest cereal losses in Sub-Saharan Africa, their estimation, assessment and reduction. https://publications.jrc.ec.europa.eu/repository/bitstream/JRC92152/lbna26897enn.pdf
- Jaques, L. B. A., Coradi, P. C., Muller, A., Rodrigues, H. E., Teodoro, L. P. R., Teodoro, P. E., Teixeira, A. L., & Steinhaus, J. I. (2022). Portable-mechanical-sampler system for real-time monitoring and predicting soybean quality in the bulk transport. IEEE Transactions on Instrumentation and Measurement, 71, 1–12. https://doi.org/10.1109/TIM.2022.3204078
- Kader, A. A. (2005). Increasing food availability by reducing postharvest losses of fresh produce. Acta Horticulturae, 682(682), 2169–2176. https://doi.org/10.17660/ActaHortic.2005.682.296
- Kiaya, V. (2014). Post-harvest losses and strategies to reduce them. Technical paper on post-harvest losses. Action Contre la Faim (ACF), member of ACF International. https://www.actioncontrelafaim.org/wp-content/uploads/2018/01/technical_paper_phl__.pdf.
- Kumar, D., & Kalita, P. (2017). Reducing postharvest losses during storage of grain crops to strengthen food security in developing countries. Foods, 6(1), 8. https://doi.org/10.3390/foods6010008
- Kitinoja, L., Saran, S., Roy, S. K., & Kader, A. A. (2011). Postharvest technology for developing countries: Challenges and opportunities in research, outreach and advocacy. Journal of the Science of Food and Agriculture, 91(4), 597–603. https://doi.org/10.1002/jsfa.4295
- Leal, M. M., Rodrigues, D. M., de Moraes, R. S., Jaques, L. B. A., da Silva Timm, N., & Coradi, P. C. (2023). Monitoring of intergranular variables for predicting technical breakage of wheat grains stored in vertical silos. Journal of Stored Products Research. 102, 102115. https://doi.org/10.1016/j.jspr.2023.102115
- Lipinski, B., Hanson, C., Lomax, J., Kitinoja, L., Waite, R., & Searchinger, T. (2013). Reducing food loss and waste. Installment 2 of “Creating a Sustainable Food Future”. Working Paper. World Resources Institute, Washington, DC. http://www.unep.org/pdf/WRI-UNEP_Reducing_Food_Loss_and_Waste.pdf.
- Mwangi, J. K., Mutungi, C. M., Midingoyi, S. K. G., Faraj, A. K., & Affognon, H. D. (2017). An assessment of the magnitudes and factors associated with postharvest losses in off-farm grain stores in Kenya. Journal of Stored Products Research. 73, 7–20. https://doi.org/10.1016/j.jspr.2017.05.006
- Makinya, K. J., Wagacha, J. M., Odhiambo, J. A., Likhayo, P., Edoh-Ognakossan, K., Tefera, T., Abass, A., & Mutungi, C. M. (2021). The importance of store hygiene for reducing postharvest losses in smallholder farmers’ stores: Evidence from a maize-based farming system in Kenya. Journal of Stored Products Research. 90, 101757. https://doi.org/10.1016/j.jspr.2020.101757
- Moraes, R. S., Coradi, P. C., Nunes, M. T., Leal, M. M., Müller, E. I., Teodoro, P. E., & Flores, E. M. M. (2023). Thick layer drying and storage of rice grain cultivars in silo-dryer-aerator: Quality evaluation at low drying temperature. Heliyon, 9(7), e17962. https://doi.org/10.1016/j.heliyon.2023.e17962
- Mesele, T., Dibaba, K., Garbaba, C. A., & Mendesil, E. (2022). Effectiveness of different storage structures for the management of Mexican bean weevil, Zabrotes subfasciatus (Boheman) (Coleoptera: Bruchidae) on stored common bean, Phaseolus vulgaris L. (Fabaceae). Journal of Stored Products Research. 96(2022), 101928. https://doi.org/10.1016/j.jspr.2022.101928
- Pattanaik, B., & Tripathi, R. (2016). Grain storage research: Handling and storage of food grains in India. Indian Journal of Entomology, 78(special), 17. https://doi.org/10.5958/0974-8172.2016.00021.3
- Taddese, M., Dibaba, K., Bayissa, W., Hunde, D., Mendesil, E., Kassie, M., Mutungi, C., & Tefera, T. (2020). Assessment of quantitative and qualitative losses of stored grains due to insect infestation in Ethiopia. Journal of Stored Products Research, 89(2020), 101689. https://doi.org/10.1016/j.jspr.2020.101689
- Taruvinga, C., Mejia, D., & Alvarez, J. S. (2014). Appropriate seed and grain storage systems for small-scale farmers: Key practices for DRR implements. FAO. http://www.fao.org.br.
- Tefera, T. (2012). Post-harvest losses in African maize in the face of increasing food shortage. Food Security, 4(2), 267–277. https://doi.org/10.1007/s12571-012-0182-3
- Toews, M. D., & Subramanyam, B. H. (2002). Sanitation in grain storage and handling. In Y. H. Hiu (Ed.), Food plant sanitation (Vol. 341, pp. 481–497). Marcel Dekker Inc.
- Wilkin, D. R., & Rowlands, D. G. (1988). The biodeterioration of stored cereals. HGCA Research Review No. 3. Storage Pests Department, Agriculture Development and Advisory Service. https://projectblue.blob.core.windows.net/media/Default/Research%20Papers/Cereals%20and%20Oilseed/rr3.pdf
- World Bank. (2011). Missing food: The case of post-harvest grain loss in sub-Saharan Africa. Report No.60371-AFR.
Appendix A:
Questionnaire used for collection of survey data

Questionnaire for evaluating impact of sanitation and post-harvest management practices in grain traders’ stores on grain quality and pest proliferation in Nairobi, Machakos and Embu counties, Kenya
Demographic and socio-economic characteristics
Name of interviewee: ………………………………………………………………………….
Phone number: ………………………………………………………………………………….
Gender: (0) Male [ ] (1) Female [ ]
Age in years: ……………………………………………………………………………………
Highest level of formal education: ………………………………………………………………
How many years have you been in the grain business? ……………………………………….
Location of the store/ warehouse: ………………………………………………………………
What is the distance in kilometers from homestead to store/ warehouse? …………………….
Who owns the store/ warehouse?
(0) Government [ ]
(1) Private [ ]
(2) Rented [ ]
Storage practices and structure
Type of storage structure; (0) Traders’ store [ ] or (1) Warehouse [ ]
What type of grains and other products are in your storage facility?
(0) Maize [ ] (1) Sorghum [ ] (2) Wheat [ ] (3) Millet [ ] (4) Rice [ ] (5) Beans [ ]
(6) Cowpeas [ ] (7) Green grams [ ] (8) Groundnuts [ ] (9) Pigeon peas [ ] (10) Dolichos [ ]
Where do you source your grains?
(0) Non-contracted farmers [ ]
(1) Contracted farmers [ ]
(2) Retail brokers [ ]
(3) Farmer cooperatives [ ]
Do you sort your grains? (0) Yes [ ] (1) No [ ]
If yes, state reasons …………………………………………………………………………
………………………………………………………………………………………………
If no, state reasons …………………………………………………………………………
………………………………………………………………………………………………
Which criteria do you use when sorting grains?
(0) Colour [ ]
(1) Grain size [ ]
(2) Physical damage [ ]
(3) Others, specify ……………………………………………………………………………
How long do you store grains before stock is completely depleted? …………………………….
Which storage structure do you use for grain storage?
(0) Ordinary polypropylene bag [ ]
(1) Jute or sisal bag [ ]
(2) Both poly and sisal/jute bag [ ]
(3) Hermetic bag [ ]
(4) Concrete grain silo [ ]
(5) Plastic grain silo [ ]
Are new bags bought for each new stock or are bags from previous stock recycle or are used bags disposed for other use?
(0) Recycled bags [ ]
(1) New bags for new stock [ ]
(2) Used bags disposed for other use [ ] specify…………………………………………….
What is the actual amount spent on bags per storage period? ……………………………….
Where are bags with grains placed?
(0) On the floor [ ]
(1) On pallets/ raised platforms [ ]
What is the capacity of grains (in 90 Kg bags) can your storage structure hold? ……………………………………………………………………………………………………………………………….
Knowledge
Have you heard about sanitation and post-harvest pest management practices? (0) Yes [ ] (1) No [ ] If yes, which ones?
(0) Cleaning storage facility [ ]
(1) Inspection of grains [ ]
(2) Keeping storage structure in good condition [ ]
(3) Maintaining proper aeration in storage facility [ ]
(4) Pest management [ ] Specify ……………………………………………………….
Which post-harvest pests do you know?
(0) Insects [ ]
(1) Rodents [ ]
(2) Birds [ ]
(3) Pathogens (Fungi and bacteria) [ ]
Does stacking of bags allow adequate ventilation? (0) Yes [ ] (1) No [ ]
Give reason for the above answer………………………………………………………….
Rank in order of importance challenges you experience in your store listed below.
By use of a scale 1–5, how do you rate degree of protection within storage facility against insects, rodents, moulds, spillage and adverse weather changes?
Attitude
I think sanitation and post-harvest pest management in storage facilities is important……….
(0) Strongly disagree [ ]
(1) Disagree [ ]
(2) Neither agree nor disagree [ ]
(3) Agree [ ]
(4) Strongly agree [ ]
Post-harvest pests are a major constraint in storage facilities……….
(0) Strongly disagree [ ]
(1) Disagree [ ]
(2) Neither agree nor disagree [ ]
(3) Agree [ ]
(4) Strongly agree [ ]
Do you think sanitation can help in reducing post-harvest losses? (0) Yes [ ] (1) No [ ]
If yes, how ……………………………………………………………………………….
Do you think the surrounding and exterior condition of the storage condition influence pest proliferation? (0) Yes [ ] (1) No [ ]
Do you think sanitation and post-harvest pest management affects quality and pricing of grain commodity? (0) Yes [ ] (1) No [ ]
If yes, state reasons …………………………………………………………………………
………………………………………………………………………………………………
If no, state reasons …………………………………………………………………………
………………………………………………………………………………………………
Storage problems and management practices
Do you face storage problems? (0) Yes [ ] (1) No [ ]
If yes, what is cause of problems?
(0) Infestation by insects [ ]
(1) Infestation by rodents [ ]
(2) Infestation by molds [ ]
(3) Attack by birds [ ]
(4) Theft [ ]
(5) Others [ ] specify…………………………………………………………………………
What is the actual amount of grains (in Kgs) lost due to storage problems? ………………
What is the value of grains lost in storage? …………………………………………………
Name some types of damages observed on stored grains?
(0) Insect damage [ ]
(1) Rodent damage [ ]
(2) Molds [ ]
Which strategies are put in place to manage pest problems?
(0) Insecticides [ ]
(1) Rodenticides [ ]
(2) Fumigation [ ]
(3) None [ ]
(4) Others [ ] Specify ……………………………………………………………………….
How frequent are pest management strategies applied?
(0) Before new stock [ ]
(1) Daily [ ]
(2) Weekly [ ]
(3) Monthly [ ]
(4) After 6 months [ ]
(5) Once per year [ ]
(6) Never [ ]
What is your reason for pest management? …………………………………………….
Are all openings within the store protected against pest penetration? (0) Yes [ ] (1) No [ ]
Do you maintain your storage facility in good condition? (0) Yes [ ] (1) No [ ]
Has management of post-harvest pests been done in your store? (0) Yes [ ] (1) No [ ]
Sanitation
Do you clean storage facility before storage of new stock? (0) Yes [ ] (1) No [ ]
How do you clean your storage facility?
(0) Sweeping [ ]
(1) Vacuuming [ ]
(2) Pressure washers [ ]
(3) Hose pipes [ ]
(4) None [ ]
(5) Others [ ] Specify ……………………………………………………………………
How often do you clean your storage facility?
(0) Before new stock [ ]
(1) Daily [ ]
(2) Weekly [ ]
(3) Monthly [ ]
(4) Once per year [ ]
(5) Never [ ]
Do you clean the following surfaces?
(0) Walls (0) Yes [ ]/(1) No [ ]
(1) Corners (0) Yes [ ]/(1) No [ ]
(2) Cracks (0) Yes [ ]/(1) No [ ]
(3) Below pallets/ raised platforms (0) Yes [ ]/(1) No [ ]
How much is the cost of cleaning (Ksh) the storage facility? ………………………….
Is there a mechanism to facilitate aeration in the storage structure? (0) Yes [ ]/(1) No [ ]
If yes, what form of aeration is employed?
(0) Natural [ ]
(1) Forced [ ]
(2) Both (natural + forced) [ ]
Do you inspect your stored grains (0) Yes [ ]/(1) No [ ] if yes tick appropriately for;
(0) Insect proliferation [ ]
(1) Rodent infestation [ ]
(2) Mould contamination [ ]
(3) Spillage [ ]
(4) Others, please list …………………………………………………………………….
How often is inspection and monitoring of grains and storage structures?
(0) Daily [ ]
(1) Weekly [ ]
(2) Monthly [ ]
(3) Never [ ]
(4) Others [ ] Specify ……………………………………………………………………
Are there spilled grains on the floor? 0) Yes [ ]/(1) No [ ]
If yes, what causes the spilling?
(0) Pests [ ]
(1) Tearing of bags [ ]
(2) Mishandling of grains [ ]
(3) Others, specify………………………………………………………………………….
Pricing and grain quality
Are you aware of any grain quality standards? 0) Yes [ ]/(1) No [ ]
If yes, which quality standards are followed for your store/ warehouse?
(0) East African Community Standards [ ]
(1) Own standards [ ]
For own standards, what parameters do you use?
In your own view, does grain quality influence pricing? 0) Yes [ ]/(1) No [ ] If yes, estimate to what extent?
(0) 0–25%
(1) 25–50%
(2) 50–75%
(3) 75–100%
Where do you sell your grains?
(0) Individual consumers [ ]
(1) Local retailers [ ]
(2) Local wholesalers [ ]
(3) Millers [ ]
(4) Feed manufacturers [ ]
(5) Relief food agents [ ]
Indicate the proportion in percentage sold to each buyer.
(0) Individual consumers [ ]
(1) Local retailers [ ]
(2) Local wholesalers [ ]
(3) Millers [ ]
(4) Feed manufacturers [ ]
(5) Relief food agents [ ]
When receiving a new stock, which of the following procedures do you perform?
(0) Sampling [ ]
(1) Drying [ ]
(2) Sorting [ ]
(3) Re-bagging [ ]
(4) None [ ]
What determines the resale price of your grains?
(0) Consumer demand [ ]
(1) Government policy [ ]
(2) Contractual agreement [ ]
(3) Quality [ ]
(4) Others [ ] Specify …………………………………………………………………………
What is the grade of your grains?
(0) Grade 1 [ ]
(1) Grade 2 [ ]
(2) Grade 3 [ ]
(3) No grading [ ]
Do you engage experts in control of quality problems? 0) Yes [ ]/(1) No [ ]
Are you satisfied with the results obtained from quality control? 0) Yes [ ]/(1) No [ ]
Who performs evaluation of quality control parameters?
(0) Internally trained personnel [ ]
(1) Internally non-trained personnel [ ]
(2) External agent [ ]
How much is paid (Ksh) to the expert if engaged? …………………………………………
During purchase of grains, what happens to grains that do not meet the acceptable limits?
(0) Rejected completely [ ]
(1) Accepted at lower price [ ]
(2) Accepted for alternative use [ ] Specify ……………………………………………
How frequent is the evaluation of parameters conducted?
(0) After 1–3 months [ ]
(1) After 4–6 months [ ]
(2) After 7–9 months [ ]
(3) After 9–12 months [ ]
When you notice deteriorated grains in your storage facility, what do you do?
(0) Mix with a superior quality [ ]
(1) Sell immediately [ ]
(2) Donate [ ]
(3) Sell to animal feed manufacturers [ ]
(4) Dispose [ ]
Are you satisfied with the results obtained? 0) Yes [ ]/(1) No [ ]
Thank you for your time.