
 ?Mathematical formulae have been encoded as MathML and are displayed in this HTML version using MathJax in order to improve their display. Uncheck the box to turn MathJax off. This feature requires Javascript. Click on a formula to zoom.
Abstract
Soil erosion is the most challenging and major environmental problems in the Upper Meki Sub catchment. Therefore, this work aims to determine the relative influences of erosion governing factors and to estimate the annual soil loss in the sub catchment area using RUSLE model. The model variables including rainfall erosivity (R), soil erodibility (K), topography (LS), cover and management (C), and support practices (P) were implemented into the GIS environment and a layer of each of these factors was prepared. The estimated value of R, K, LS, C, and P for the sub catchment area ranges from 512 to 604 MJ mm ha-1 h-1 yr-1, 0.137 to 0.169 tons/ha, 0 to 59, 0.001 to 0.4 and 0.10 – 1.00 respectively. The raster values of all these factors were multiplied by using GIS calculator. Based on the results from GIS raster calculation and RUSLE model, the total annual potential soil loss from the sub catchment area is about 2,756,540 tons per year with a mean estimated soil loss rate of 28.12 + 34.77 t/ha/yr and the total actual annual soil loss is 492929 tons with an estimated erosion rate of 37.05 + 46.7 t/ha/yr. Rainfall is identified as the most sensitive factor of soil erosion in the sub catchment area. Our estimation of soil erosion provides notional basses that the area needs immediate action to sustain the soil. Nevertheless, further research on severity analysis and area prioritization, and sediment loss estimation in this watershed is highly recommended to develop practical way of conserving practices.
REVIEWING EDITOR:
1. Introduction
Soil is defined as the first top layer of the earth’s surface consisting of minerals and organic materials (reference). Its mineral components are a result of weathering processes while its organic components are a result of the decomposition of biological matters (Strahler & Strahler, Citation2013). As a key component of the earth system, soil control biogeochemical processes, hydrological cycles and offers many resources, goods, and services to the human societies (Berendse et al., Citation2015). In human interaction with the physical environment particularly for subsistence and economic reason, soil plays the most important role and occupies the core position of the interaction (Alewoye Getie et al., Citation2020). This naturally abundant resource i.e. soil is a vital input for agricultural production (Dutta et al., Citation2015). And thus the wellbeing of both the present and the future generation highly relay on the productivity of the soil particularly in a country where the livelihood of the population is agriculture (Pal & Chakrabortty, Citation2022). However, it has been alarmingly degraded since mankind began to exist on the planet earth (Adediji et al., Citation2010; Andrew et al., Citation2022; Balabathina et al., Citation2020; Yesuph & Dagnew, Citation2019).
Although land degradation put the world’s economy and ecosystem under pressure, it has become the most serious growing threat to food production, food security, and natural resource conservation particularly in Africa and Asia (Balabathina et al., Citation2020; Belayneh et al., Citation2019). Loss of production capacity of land in terms of depletion of soil fertility, soil biodiversity, and other land surface resources as a result of deterioration in the physical, chemical, and biological attributes of the soil are among the challenges that the continents have faced (Egbueri et al., Citation2022; Getu et al., Citation2022). Nowadays the potential of land to provide vital nutrients and to support the growth of plants has been adversely disturbed by different natural and human abused activities. Climate induced soil erosion remains the most threatening challenges of the 21st century affecting the health and function of the global ecosystem (Chakrabortty & Pal, Citation2023; Pal et al., Citation2021; Pal & Chakrabortty, Citation2019a). According to Hurni et al. (Citation2015), about 50% and 80% of the global pastoral land and agricultural land are harmfully affected by erosion respectively.
Although soil erosion poses overwhelming impacts across the world, the impacts are more pronounced in countries having complex terrain and high population number like India (Pal et al., Citation2022a; Pal & Chakrabortty, Citation2019b). Anthropogenic pressures including deforestation, steep slope cultivation, overgrazing, over-cultivation, and unsustainable use of land resources have also largely influenced the erosion process in most of the 3rd world countries in Africa and Asia (Pal et al., Citation2022b; Pal & Chakrabortty, Citation2019b; Roy et al., Citation2023). In Africa, the decrease in agricultural productivity due to soil erosion is estimated from 2-40%, which accounts for 8.2% of the global world soil erosion (Smaling & Oenema, Citation2020). Even though land degradation due to soil erosion is a recurrent phenomenon in the Sub-Sahara African countries as a whole, it is more severe in east African countries. For example, over 61% of the entire area of Tanzania is affected by erosion and about 15% of total arable land in Malawi and Zambia are lost (Kiptoo & Mirzabaev, Citation2014).
Ethiopia, one of the developing countries in sub-Saharan Africa, and whose more than 85% of its population depends on agriculture has been faced a serious problem for the successive decrease in agricultural production (Andualem et al., Citation2020; Tsegaye & Bharti, Citation2021). This is mainly resulting from land resource degradation induced by soil erosion. For instance, the study conducted by Fao (Citation2015), soil erosion had been estimated to cost the country 1.9 billion US$ with in the past 15 years between 1985 and 2010. According to Deressa et al. (Citation2020), about 2 billion tons of fertile topsoil are lost per year in Ethiopia, which is about 8% of the total land surface erosion. This cost the country 3% of its Agricultural Gross Domestic product (AGDP) and makes approximately 1 mm of the vertical soil depth across the country (Balabathina et al., Citation2020). Water induced soil erosion has not only effected upon decreasing tendency of agricultural production, it increased the amount of sediment yield and layering of the reservoir due to sedimentation. This made Ethiopia a country where the highest rate of soil erosion in East Africa is prevailed (Ayalew et al., Citation2020; Erol et al., Citation2015; Gessesse et al., Citation2015).
Even though the country plans to alleviate soil erosion since 1980, but it remains unsuccessful in implementing the plans due to more gaps and constraints with the implementing body and lack of community-based discussion regarding land reforms and reclamation (Legese et al., Citation2004; Getu et al., Citation2022). Poor and outdated farming style, land cover deterioration on account of mismanagement, lack of community participation, unmanageable planning units, and lack of deep knowledge and skill in the characterization of watersheds, made the problem more serious in the Ethiopian highland (Hurni et al., Citation2015). Owing to the risk of soil erosion in the Ethiopian highland, about 1billion tone of net soil is lost per year, and resulting in an annual decrease in land productivity by 2.2 % (Getu et al., Citation2022). Extensive deforestation for the expansion of agricultural land and wood demand, and grazing on steep slopes, population growth and subsequent pressure on arable lands are among the foremost accelerating factors in the Ethiopian highland (Teshome et al., Citation2021). Nowadays, some farm plots are at a stage which cannot be easily rehabilitated. Similarly, soil erosion has become one of the key challenges in upper Meki sub catchment which is resulted from the combination of the diversified topography, climatic variability, and man’s abuse action. Currently, the depletion in soil fertility and its subsequent decrease in agricultural productivity caused soil erosion a thoughtful threat to food security among smallholder farmers. Soil loss, productivity decline, soil depth decline, plot size reduction, soil color change, and gully formation are the major effects of erosion in the upper Meki sub catchment. Despite having severed soil erosion risk, objectively measured quantitative data on the magnitude of soil erosion are scarce and are still lacking in the upper Meki watershed to guide methodological decisions in conservation planning.
Even though field studies are extremely useful in characterizing the extent and magnitude of field situations, it tends to be costly, time-consuming, and complex; thus models play an important role in alleviating such constraints Aneseyee et al., Citation2020; Ghafari et al., Citation2017, Tsegaye & Bharti, Citation2021). Despite the fact that various soil erosion models have been developed since the 1970s, most of the models are limited at local levels and are difficult to expand to broad regions (Bastola et al., Citation2019). This is because the data fed into the models while emerging the models did not consider universal standard conditions. Some of the widely used soil erosion and sediment loss estimation models are Universal Soil Loss Equation (USLE) (Wischmeier & Smith, Citation1978), Revised Universal Soil Loss Equation (RUSLE) (Renard, Citation1997), Sediment Delivery Distributed Model (SEDD) (Ferro & Porto, Citation2000), Soil Water Assessment Tool (SWAT) (Piniewski et al., Citation2019) and Agricultural Non-Point Source (AGNPS) (Williams et al., Citation2008). Although the USLE is relatively a simple empirical model and robust both at the regional and national levels, it has several shortcomings. Some of these limitations as described by Tesfaye (Citation2015), are given as follow: (1) it does not consider gully and stream channel erosions, (2) the runoff throughout the catchment is assumed to be uniform, (3) it is not been designed to operate at large scale, (4) it does.t cope with undulating terrains, (5) it does not examine the relationship between rates of infiltration and intensity of runoff, (6) sediment deposition at the lowest point of concave slops is not taken in to account, (7) it was designed to predict the soil loss from agricultural fields; its application in forest land, rangeland, and disturbed areas were limited.
On the other hand, the RUSLE model is an improved version of the original USLE model (Pal & Chakrabortty, Citation2019a). As stated by (Bombino et al., Citation2004; Egbueri et al., Citation2022), the RUSLE model got several improvements in examining soil erosion governing factors and considering different Land Use Land Cover (LULC) situations including forestlands, rangelands, and disturbed areas (Ashiagbor et al., Citation2013; Colman et al., Citation2018; Thapa, Citation2020). Haile & Fetene (Citation2012), also stated that in areas where the required amount and type of data is sufficiently available, the RUSLE model is found to be cost-effective soil loss estimation model for effective conservation planning. (Belayneh et al., Citation2019) also stated that, because of its simplicity, adaptability, compatibility, and applicability with the available limited data, the RUSLE model is more capable to predict the long term average annual rate of soil erosion on-field slopes (Zanchin et al., Citation2021). The advent of GIS technology has allowed the equation of soil erosion to be computed in a spatially distributed manner as each cell in a raster image comes to represent a field-level event (Ayalew & Selassie, Citation2015). As a result many researchers have found GIS integrated RUSLE model to be cost-effective soil loss estimation model for effective conservation planning and to produce satisfactory results even for large areas. Therefore, this study aims to utilize the RUSLE model along with Arc GIS to determine the relative influences of erosion governing factors and to estimate the annual soil loss rate in the Upper Meki sub catchment.
2. The study area
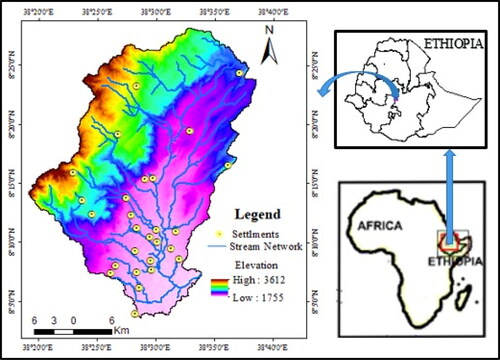
Meki River is one of the major river catchments of the Lake Ziway. It originates from the western highland areas of Gurage, Southwestern Ethiopia about 130 km south of Addis Ababa the capital city of the country. Meki River and its tributaries i.e. Aleltu 1, Gullo, Woldiya, Aleltu 2, Gerbi and Lebu travels about 100 km before interring to Lake Ziway. From DEM data and field observation, the area is characterized by diversified rugged topography mainly consisting of undulating hilly landforms, mountains, plains, steep waterfalls, well-developed dendritic drainage pattern, rills and gullies. Geographically, the catchment area is bounded by 8o 3’ 0’’ and 8o 28’ 0’’ north latitude and 380 18’ 0’’ and 38o 38’ 0’’ east longitude as indicated in . The total catchment area covers about 88,779 ha and comprises parts of Soddo (34%), Meskan ena Mareko (55%), Dugda Borra (8%) and Silti weredas (3%). The elevation of the area is fluctuating with altitudinal difference ranging from 1755 m and 3612 m above the mean sea level. The western summit of the area with an altitude exceeding 2295 m lies in the high plateau area, and the altitudes ranging from 1856 to 2294 m lies in the transitional escarpment area, while the area less than 1856 m altitude is a part of the rift floor. The gently flat and undulating nature of the major portion of its landscape made the area suitable for crop production and animal husbandry. As a result, the livelihood of most of the resident is depend on agriculture; well known for its Enset plant production and cattle breading.
Figure 1. Location map of the study area.
The variation in the topography of the area has resulted in unique climatic condition, soil characteristics and vegetation cover. As stated by Demlie et al. (Citation2008), the present landforms of the area are a result of volcanic and tectonic activities including faulting and fracturing, and external processes including weathering and erosion. The digital soil data obtained from the international soil classification system of Fao (Citation2015), show that the major soil type of the catchment area are Chromic Luvicsols, Eutric Nitisols, Chromic Vertisols, Calcic Fluvisols, Calsic Xerosols, and Vertic cambisols. The soil in the study area exhibits different colors depending on the physiographic condition, drainage pattern, erosion susceptibility of the soil, parent material, and its associated soil depth. Black cotton and reddish-brown colored soil are the most common followed by grey colored soil. The soil depth for the catchment area ranges from less than 30 cm to 120 cm because of differences in slope, climate, and LULC units (Fao, Citation2015).
Agro-ecologically, the study area, which is laying in the tropical climate, falls into two main traditional agro-climatic zones namely cool and moist mid-altitudes. The term mid-altitude is locally equivalent to Woina Dega (Dendir & Simane, Citation2019). Most of the western and northern part is characterized by having a cool mid-altitude agro-climatic condition, while the eastern part is predominantly known by its moist mid altitudinal agro-climatic condition. The sub-catchment area is characterized by receiving a bimodal rainfall system where the main rainfall season i.e. kiremt mostly spans from late May to late September whereas the small rainfall season i.e. belg spans from mid of March to mid of April. Teff, maize, sorghum, wheat, barley, pepper, pulse, and pea and haricot beans are the common rain-fed crops grown in the area. However, some smallholder farmers are engaged in small scale irrigation activities commonly yielding green cabbage, carrot, onion, sugarcane, tomato, green pepper, coffee, beetroot, lettuce, kale, and garlic by using Meki river. Analysis from 31 years’ metrological data notice that the average annual rainfall recorded in the sub catchment area varies from 801 mm to 1200 mm, and the minimum and maximum annual temperatures are 10⁰c and 25.15⁰C respectively. The mean monthly wind speed prevailing in the sub catchment area during the past 3 decades (1987–2019) is 1.7 m/s with an average of 7.7 sunshine hours per day. The mean monthly relative humidity of value about 61.2% of which, the largest percentage happens during July to August.
In the area, several studies were conducted by different researchers regarding on the geology (Tadesse et al., Citation2003) and hydrogeology (Balcha et al., Citation2022) as part of the Central Main Ethiopian Rift (CMER). (Peccerillo et al., Citation1998), stated that Precambrian crystalline rock overlaid by Mesozoic sediments out crop at the base of the Gurage escarpment near the village Kella. As publicized by Legesse et al. (Citation2004), the Mesozoic sediments are exposed at the western rift margin, east of the Gurage Mountains. Trap series basaltic units have also occurred at the western and eastern margins of the area. According to Peccerillo et al. (Citation1998), Miocene-Pliocene rift shoulder trachytic volcanic rocks and phreatomagmatic deposits are exposed over the Gurage Mountains and near Kella village respectively. Quaternary lacustrine sediments and interbedded Pyroclastic layers with associated landforms including Butajira caldera, Insano-Kela plain and fault lines oriented in WNW direction are exposed along the rift floor (Balcha et al., Citation2022; Legesse et al., Citation2004).
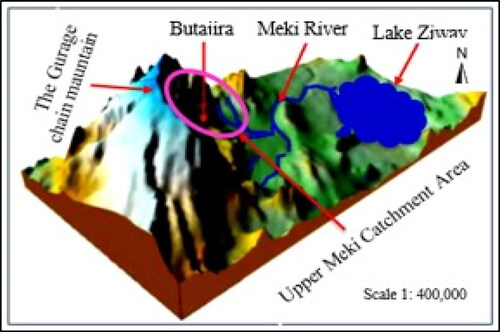
As stated by Demlie et al. (Citation2008), the high plateau parts of the catchment area comprising rock units including highly welded ignimbrites, tuff, rhyolites, and trachyte are characterized by having permeability ranging from 0.1-1.0m/day. Even though the upper weathered rock unites and soils are permeable, the underling volcanic unites are massive. A permeability value ranging from 5-10 m/day is noted in the areas including Butajira pediment, Kuntane-Inseno-Kella plain, Tora-Koshe-Dugda ridges, and some northeastern areas. The areas along the Major fault including east of Butajira possess a permeability value ranging from 10-20 m/day mainly due to the characteristics of rock units of the area including recent basalts, highly fractured ignimbrites, scoria cone, and associated joints, faults, and vesicles. The groundwater flows from the western escarpment through the Gurage Mountain towards Lack Ziway (). According to the borehole data collected by Botanie (Citation2022), aquifer depth of the study area and its surrounding ranges from 60-300 m.
Figure 2. Dimensional terrain distributions (Source, Ethiopian water technology center, 2008).
3. Materials and methods
3.2. Revised universal soil loss equation (RUSEL)
RUSLE is the most widely used model for soil erosion throughout the world. It has got several improvements over the original USLE model based on the basic empirical approach. RUSLE uses a set of mathematical equations to calculate erosion as a product of five important factors that impact soil erosion namely, rainfall erosivity (R), soil erodibility (K), topography (LS), cover and management (C), and support practice (P). The following principal equation is functional to RUSLE to estimate topsoil loss under specified weather conditions, vegetation cover and management practices for each land utilization type (Ashiagbor et al., Citation2013; Bekele et al., Citation2022; Renald et al., Citation2017; Wischmeier & Smith, Citation1978).
(1)
(1)
Where,
A is average annual soil loss (tons ha yr-1)
R is rainfall erosivity (MJ mm ha-1h-1yr-1)
K is soil erodibilty (tones ha h ha-1MJ-1mm-1)
LS is topographic factor (unit less)
C is cover and management factor (unit less)
P is the practice support factor (unit less)
The required input data for the model such as annual rainfall, soil type, slope length and steepness, crop cover and land-use type were extracted from the rainfall record, soil map, DEM, satellite imagery, and land-use map respectively. The model variables were implemented into the Arc GIS 10.7 environment and prepared a layer of each of these factors to span the watershed followed by compiling the raster values for each cell to calculate the annual soil loss rate.
3.2.1. Rainfall erosivity factor (R)
Rainfall erosivity (R) is the potential of the erosive force of rainfall and runoff to cause erosion. It takes into consideration the total rainfall and, more important, the intensity and seasonal distribution of the rain. (Fournier, Citation1962), developed a soil loss estimation model; calculates rainfall erosivity as a simple summation of the ration of the square of mean monthly rainfall to mean annual rainfall by means of the cumulative precipitation volume without considering the most relevant parameters, raindrop’s kinetic energy and intensity. (Balabathina et al., Citation2020; Cassol et al., Citation2018; Erol et al., Citation2015; Hurni, Citation1985), established a powerful erossivity model; calculating R as a product of the total energy of rainstorm (E) and the maximum 30-minute intensity (I30). But, unavailability of detailed continuous precipitation data with 30-minute time resolution to determine the intensity of individual raindrop made the model more complex. (Botanie, Citation2022; Boateng et al. Citation2008; Negese et al., Citation2021) Also proposed the power-law equation to estimate the rainfall erosivity factor over the Ethiopian region however it also involves rainfall’s kinetic energy and intensity data which were not available at all at the eight selected rainfall stations in and around the Upper Meki catchment area. Similarly, (Hurni, Citation1985), developed a model which was adapt to the Ethiopian highland condition based on the available time series rainfall data. The model was widely used by several researchers in Ethiopia and across the world. Therefore, Hurni’s erosivity model is used in the present study to estimate the erosive force (R) of rainfall in the catchment area.
(2)
(2)
Where, P is P is the mean annual rainfall distribution.
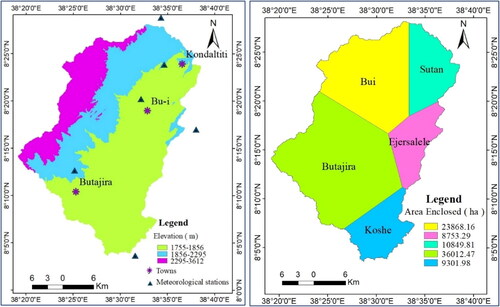
The value of R is largely variable depending on seasonal changes and altitudinal differences. Thus it is important to increase the number of meteorological stations and to use long years’ weather data as much as possible to increase the spatial and temporal distributions. In our study a minimum of 13 years (2006-2018) and a maximum of 32 years (1987-2019) daily weather data, at six stations (Bui, Ejersalele, Sutan, Lemen, Butajira, Koshe) received from the National metrological institute of Ethiopia (NMA) was analyzed to estimate R-values ().
Figure 3. Rain fall Stations (A) and their influencing area (B).
The erosive power of streams called Stream Power Index (SPI) for a catchment area is calculated as a function of slope categories and contributing area. SPI plays a great role in the process of erosion assessment and conservation; more importantly it is used to estimate the potential of flowing water to cause erosion, to locate areas where gullies are concentrated and to identify appropriate locations for conservation practices (Balabathina et al., Citation2020).
(3)
(3)
The contributing area in our case is approximated by using the Theissen polygon.
3.2.2. Soil erodibility factor (K)
Soil erodibility refers to the vulnerability of soil to erosion agents. As stated by Balabathina et al. (Citation2020), the erodibility value K integrates all effects of the different soil properties and soil profile characteristics on soil erosion rates (Almagro et al., Citation2019; Asmaranto (Citation2016); Thapa, Citation2020; Zanchin et al., Citation2021). The estimation of erodibility value involves various physical parameters such as soil texture, soil organic matter content, percent of sand, silt, and clay in the soil, soil structure code, and profile permeability. And thus it requires substantial time, cost, resource, long-lasting field surveys, and laboratory analyses (Andrew et al., Citation2022; Yesuph & Dagnew, Citation2019). However, to overcome such limits many researchers have recommended different alternative methods for estimating erodibility values based on the available data and information. For instance, (Hurni, Citation1985) used the qualitative index method to calculate K value based on the color of the soil in the Ethiopian regions. They suggested that soils having black, brown, red, yellow, grey, and white color will have a K-value of 0.15, 0.2, 0.25, 0.3, 0.35, and 0.4 respectively. Yet, soil is a complex material and its behavior is largely varying spatially (Hurni et al., Citation2015; Tsegaye & Bharti, Citation2021). Specifically, the color of soil is highly affected by mineralogy, weathering, and climatic condition, and thus using this method is more doubtful and unrealistic in ranking of soil erodiability. As a result, another empirical model which was developed by Williams et al. (Citation2008), based on textural class fields and organic matter contents was used for estimating K-value in the present study. The soil information in this study is obtained from the Harmonized World Soil Database and the United States Department of Agriculture soil textural class (Boateng et al. Citation2008).
(4)
(4)
Where, fcsand is a factor that lowers the K in soils with high coarse-sand content and higher for soils with little sand.fcl-si is gives low soil erodibility factors for soils with high clay-to-silt ratios.forgc is reduces K values in soils with high organic carbon content.fhisand is lowers K values for soils with extremely high sand content.
(5)
(5)
(6)
(6)
(7)
(7)
(8)
(8)
Where, Ms is the sand fraction content (0.05-2.00 mm diameter)
Msilt is the silt fraction content (0.002-0.05 mm diameter)
Mc– the clay fraction content (< 0.002-0.05 mm diameter)
Corgc- the organic carbon (SOC) content
3.2.3. Topographic factor (LS)
Topographic factor (LS) defines the combined effects of slope steepness and slope length on erosion. Its value largely depends on the three-dimensional characteristics of landscape. Although many researchers have recommended various methods to estimate the LS value, the approach forwarded by Moore & Wilson (Citation1992) and (Chuenchum et al., Citation2019) remains the most widely used method all over the world. This is because most of the relevant parameters namely flow direction, flow accumulation and slope are taken into account in the approach proposed by. Therefore, this approach is used in the current study however the calibrating parameters used by (Moore & Wilson, Citation1992), 0.4 and 1.4 were modified to 0.5 and 1.3 based on (Chuenchum et al., Citation2019) recommendation for topographically complex terrain. A digital elevation model from SRTM (Shuttle Radar Topography Mission) data at 30 m spatial resolution (http://srtm.usgs.gov/) was used to estimate the flow accumulation and slope.
(9)
(9)
Where, Af is the flow accumulation (pixels), C is the pixel size (m), and β is the slope angle in rad.
3.2.4. Cover and management factor (C)
The C factor is defined as the ratio of soil loss under the given vegetation cover to that which would occur under continuously bare soil. It provides the combined effect of soil cover, amount of green biomass and soil disturbing activities on the erosion process. Different researchers follow different methods to determine the C-factor value. (Renald et al. (Citation2017) estimated the C factor based on five sub-factors including prior land use, canopy cover, surface cover, surface roughness, and soil moisture. (Renared and Foster) developed a method for estimating the C-factor which was derived from the linear regression of support practice factor (P), topographic factor (LS), and soil erodibility factor (K). (Hurni, Citation1985), also assigned C value for the different land use land cover classes and it has been used by the work many researchers across the world. However, the trouble in using the above mentioned methods is that the effect of seasonality on plants’ phenology and amount of green biomass in estimating C value is not well-considered. On the other hand, (Alexandridis et al., Citation2015) applied another method of scheming C value by using time series high resolution remote sensing satellite imageries of optimum seasons designed for Normalized Difference Vegetation Index (NDVI). NDVI is positively related with the amount of green biomass and provides an indication of differences in green vegetation canopy. As suggested by Alexandridis et al. (Citation2015), Normalized Difference Vegetation Index (NDVI) from time series Landsat 8, OLI, 2022 (15 m pan merge; bands 2, 3, 4, 5) is used to estimate C factor value in our study as indicated in ().
(10)
(10)
Table 1. Satellite imageries data.
Where, are the spectral reflectance of NIR and RED bands respectively, and the equation suggested by Durigon et al. (Citation2014) for estimating C value is give as:
(11)
(11)
3.2.5. Support practice factor (P)
Conservation practices affect the rate of soil erosion in several ways. They may affect erosion by modifying the flow pattern and direction of the run off by exhausting the energy of running water and by reducing the amount of the surface runoff (Andualem et al., Citation2020; Balabathina et al., Citation2020; Bekele et al., Citation2022). The effects of the different conservation practices such as contouring, strip cropping, terracing, subsurface drainage and many others is called Support practice factor (P). However, quantifying P value directly from field observations and measurements at farmland scale for a large catchment area is very costly and takes long-lasting time. As a result, many researchers have endorsed an alternative way of determining P value largely based on slope classes and farming practices. In our study the approach suggested by Balabathina et al. (Citation2020) based on slope categories and LULC map of the study area was employed. Pixel based maximum likelihood supervised classification on SPOT, 2022 image (1.5 m pan merge; Bands- blue, green red, 450-695 nm) was carried out to generate the land use/land cover map of the studied watershed. The major LULC types identified in the studied watershed are bare land, settlement, forests and crop fields. Landsat 8 with 15 m resolution, Google earth data and ground control points were used to confirm the generated LULC types ( and ). The overall work flow of the study is indicated in ().
Figure 4. Land use and Land cover units (A) and Average Normalized Difference Vegetation Index (B) (NDVI) for upper Meki sub catchment.
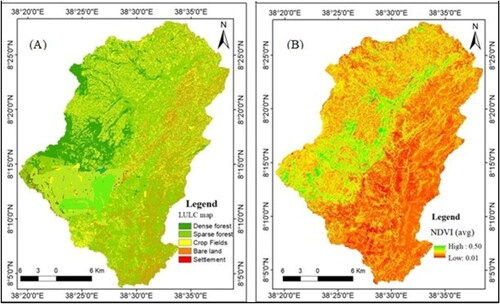
Figure 5. General work flow for the study.
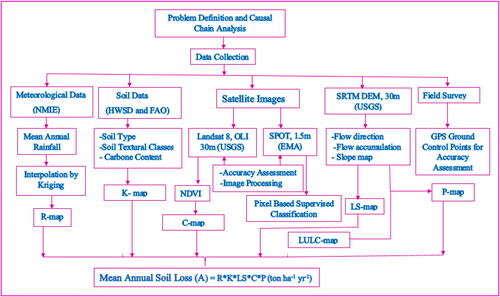
Table 2. Area of land use type.
4. Results and discussions
4.1. Rainfall erosovity factor (R)
The erosive force of rainfall for the entire catchment area was estimated by using EquationEq. (2)(2)
(2) . The distribution of R-value was found to vary consistently with annual rainfall across the catchment area. The estimated R-value in the upper Meki sub-catchment ranged from 512 to 604 MJ mm ha-1 h-1 yr-1 (, ). In a complex topographic terrain an erosivity value greater than 500 MJ mm ha-1 h-1 yr-1 can causes extreme to very extreme erosion events (Oliver’s, 1980), and thus rainfall erosivity (ranging from 512 to 604 MJ mm ha-1 h-1 yr-1) is one of the most sensitive factors of soil erosion in the catchment area. (Bekele, Citation2021) applied the same procedure to estimate the erosive power of rainfall in the Anka_Shashara catchment in the Southern Ethiopia and was found to be varied from 570 - 705 MJ mm ha-1 h-1 yr-1. The study conducted by Kebede & Fufa (Citation2023) show that the R-factor value for Finca’aa sub catchment in the Western Ethiopia ranges from 582 – 712 MJ mm ha-1 h-1 yr-1. A Similar approach is used by Hagos (Citation2020) to estimate the erosive force of rainfall in Zariema catchment in Northern Ethiopia which was found to be 635- 758 MJ mm ha-1 h-1 yr-1. All these estimated values of R factor were found to be almost similar or slightly varied to that our estimation of R for Upper Meki sub catchment. The potential of streams of the sub-catchment area to cause erosion i.e. SPI was calculated using EquationEq. (3)
(3)
(3) and thiessen polygon. According to Oliver’s, 1980 a SPI value of greater than -13 is very indicative about high soil erosion potential particularly in upstream catchment area multiplied with slope. The SPI value in the sub-catchment area ranges from -6.48 to 9.10 (). Negative value of SPI shows a positive main convergent flow of water within a catchment area (Balabathina et al., Citation2020). The SPI values in the Meki catchment indicate that the potential of the rainfall is high enough to generate net erosion on the upstream area.
Figure 6. Rain fall erosivity factor (R) (A), Soil erodibility factor (K) (B), Topographic factor (LS) (C), Cropping management factor (C,D).
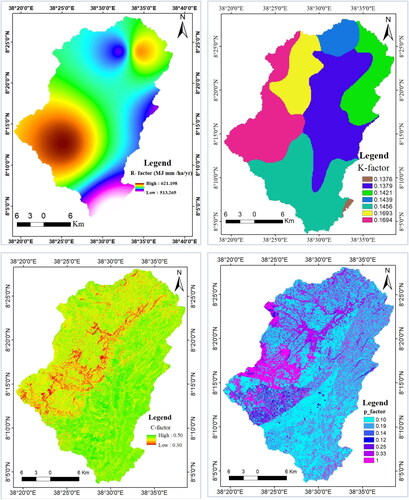
Figure 7. Support practices factor (P) (A), Stream power index (SPI) (B), Potential soil loss (C), Actual soil loss (D).
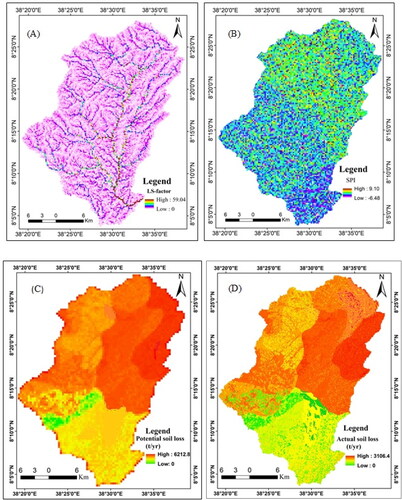
Table 3. R-values in the upper Meki catchment.
4.2. Soil erodibility factor (K)
Different soils erode at different rates when the other factors that affect erosion remain the same. Thus, K-factor provides the estimated values and hence vulnerability of each soil type. Based on the Harmonized World Soil Database (39) there are eight soil types in the Upper Meki catchment. The values of K for the catchment area were calculated based on EquationEq. (4(4)
(4) , 5, 6, 7, and 8). The values of K are slightly the same throughout the upper Meki sub catchment ranging from 0.137 to 0.169 tons/ha (, ). As recognized by Thapa (Citation2020) these values of K indicate that the soil is highly susceptibility to erosion. In the sub catchment area, the lowest K-values are concentrated in the low lands, whereas the highest K-values are concentrated in the high altitude areas (). By applying similar approach (Jothimani et al., Citation2022) calculated K factor value ranging from 0.2 – 0.36 tons/ha for Kulfo river catchment in the Southern Ethiopia. This value of K was somewhat overestimated than our estimated value of K. This was because the soils of Kulfo river catchment behave differently and are more vulnerable to erosion than that of Upper Meki sub catchment. On the other hand (Moisa et al., Citation2022) estimated the K factor value for Anger River sub-basin in the Western Ethiopia and was found to be varied from 0.05 – 0.35 tons/ha. Some of the soils such as Calcic cambisols and Dystric gleysols found in Anger River sub-basin but not in the Upper Meki sub catchment have distinct characteristics in which as Calcic cambisols are less susceptible to erosion while Dystric gleysols are very susceptible to erosion. However the study conducted by Hagos (Citation2020) show that the K factor value for Zariema catchment in Northern Ethiopia ranges from 0.12- 0.168 tons/ha which is almost similar with that of our estimated value of K for Upper Meki sub catchment. This is because these two catchment areas have closely the soil types and hence have the same erodibility nature.
Table 4. Soil types and the K-factors for upper Meki catchment.
4.3. Topographic factor (LS)
The DEM data was used to reclassify the Sub catchment area in to five slope classes as per the USAD classification. Results from the slop analyses show that 25%, 6%, and 5% of the catchment area characterized by having rolling terrain, hilly terrain, and steep dissected mountains respectively (). On the other hand, the flat and gently undulating slop classes cover 21% and 43% of the catchment area respectively ().
Table 5. Area of various degrees of slope categories in upper Meki catchment.
Particularly for the RUSLE model, LS factor represents a ratio of soil loss under a given conditions of an area with standard slope sleepiness of 9̊ and slope length 22 m (Negese et al., Citation2021). Soil erosion increases with increases in slope steepness and slope length. This is because the increase in slope steepness and slope length produces higher overland flow velocities. Although changes in both slope steepness and slope length considerably lead to higher soil erosion, the changes in slope steepness are more sensitive than the changes in slope length. In our case the combined effect of slope steepness and slope length was estimated based on EquationEq. (9)(9)
(9) . The result of EquationEq. (9)
(9)
(9) shows that the LS factor in the catchment ranges from 0 to 59 by which almost the total being below 1.0; implies that the slope is very steep and slope lengths are short (). Similarly the analysis from the DEM data shows that about 11% of the catchment area is characterized by having strong slope steeper than 9° (). This indicates that the effect of slope steepness and slope length are high enough to make the soil erosion more serious. In comparison, the central parts along the Meki river course of the study area have higher LS-factor value; resulting in more severe soil erosion, while the northern and Eastern parts have lower LS-factor values; resulting in less soil erosion. (Bekele, Citation2021) estimated LS factor value for Anka_Shashara catchment in the Southern Ethiopia and was found to be varied from 0 to 25%. It was stated that this value significantly contributes to soil erosion. In this regard, our estimated value of LS factor shows that the Upper Meki sub catchment area is topographically more complex and vulnerable to soil erosion; hence are generally suggested for appropriate landscape based and physical human conservation interventions
Table 6. LS factor in the upper Meki catchment.
4.4. Cover and management factor (C)
LULC types with in a catchment area determine the C-factor value. Commonly soil erosion on forested land is lesser than on unfrosted land because forests have better capacity to lower the energy of running water and hence keep the soil surface from erosion (Alexakis et al., Citation2013). The C-factor value ranges from 0 to 1, with a value close to 0 indicates lower soil erosion vulnerability and more effective conservation efforts while a value approaching to1 infers no conservation efforts, and that area is extremely vulnerable to soil erosion (Degife et al., Citation2021; Jothimani et al., Citation2022). Only 20% (17,871.4 ha) of the Upper Meki sub catchment area is covered by forests. The remaining 80% (70,908.56 ha) of the sub catchment area is covered by other LULC types including built up lands, settlement, bare land and crop fields. The C factor for the studied sub catchment area was calculated by using EquationEq. (11)(11)
(11) . Accordingly, the C-factor value for the upper Meki sub catchment varied between 0.001 and 0.5 (). The higher the C-factor value the more is the vulnerability of the soil to erosion. Large C factor value corresponded to areas of bare soils and crop lands whereas small C value corresponded to areas covered by scattered shrub land, natural forest, and plantation forest. The same procedure was followed by Jothimani et al. (Citation2022) to estimate the C factor value for Kulfo river catchment in the Southern Ethiopia, ranging from 0.001 to 1. This value implies that compared to the Upper Meki sub catchment less conservation measures are made in Kulfo river catchment are highly susceptible to erosion.
4.5. Support practice factor (P)
One of the factor controlling the rate of soil erosion with in a catchment area is the support practice (P) factor. Soil supporting practices including any local conservation activities established in a catchment area affects the rate of soil erosion in advance (Jothimani et al., Citation2022). Therefor the P factor value largely depends on the type of conservation practice employed on specific plot of land (Ugese et al., Citation2022). However in the case where implemented conservation measures are lacking the P facto value can be obtained by correlating the slope categories in percent and the major land use types (Girma & Gebre, Citation2020). In this regard the P factor value ranges from 0 to 1, by which a value close to 1 implies that a given catchment area is dominantly covered by grass cover, shrub land and forest land where erosion controlling practice aren’t implemented yet (Balabathina et al., Citation2020). In the current study the support practices factor (P) for the sub catchment area was calculated by taking account of the effect of the different land use types depending on slope degrees as suggested by Ugese et al. (Citation2022). About five different land use types were identified from the Pixel based supervised classification on SPOT image. The estimated P value was ranging 0.10 – 1.00 (). As there is no conservation and support practice, all non-agricultural land including dense forests and grass land was assigned to have a P value of 1.00.
Table 7. The support practice (P) values of the studied catchment area.
4.6. Estimated annual soil loss
Both the potential and the actual annual soil loss per hectare in the watershed were computed. The potential soil loss expresses the inherent susceptibility of bare soil to erosion as it would be without any support and management practices. The raster values of the three naturally occurring factors including erosivity factor, erodibility factor, and topographic factor are used as input data for the RUSLE model to compute the potential soil loss. While the actual annual soil loss of the studied watershed is computed by multiplying all the five factors including erosivity factor, erodibility factor and topographic factor, cover and management factor, and support practice factor as per EquationEq.(1)(1)
(1) . This provides the present soil vulnerability to erosion hazard by considering the contemporary land cover and management practices that modify the potential soil erosion. The total annual potential soil loss from the entire catchment area is about 2,756,540 tons per year. The estimated annual potential soil loss in the watershed ranged from 0-6120.22 t/yr with a mean estimated soil loss rate of 28.12 + 34.77 t/ha/yr (). While the total actual annual soil loss from the entire upper Meki watershed is 492929 tons with an estimated erosion rate of 37.05 + 46.7t/ha/yr () (Tesema, Citation2015). Estimated the mean soil loss rate in Cheraqe watershed, located on the southern side of the present study site, was about 24.85 t/ha/yr. It is, therefore, the mean estimated erosion rate in the current study area was little more than that of the soil erosion rate in the Cheraque watershed area. The high rate of soil erosion in the upper Meki watershea area is mainly due to the human interventions associated with intensive rainfall, erodible soil, weak jointed and fissured rocks, and steep-sloped topography with no conservation measures.
5. Conclusion and recommendation
Application of the RUSLE model to the upper Meki sub catchment using remote sensing and GIS technologies and, available data sets can produce realistic results, which would allow targeted attention towards a solution for soil conservation. This allows good circumstance for the identification of regions with high potential of soil erosion and focused attention to be paid to soil conservation initiatives. The method established in this study would be helpful for prioritizing areas to be examined and remediated where such per-existing data are lacking. This study explored the erosive forces of rainfall and its associated runoff, the erodibility nature of the soil, the effect of cover and management practices in the erosion process, the effects of topography on erosion rates and the amount of annual soil losses. The estimated annual soil loss show that soil erosion is a threatening problem for agricultural production and its sustainability in the sub catchment area. It also points out that the problem could be worsening in the future unless immediate remedial measures are taken. The findings from this work have a significant contribution for understanding the vulnerability of the sub catchment area to potential erosion risks. One can perceive the long-term sustainability of agricultural practices, the profound economic consequences including its onsite and offsite impacts and costs, and quality enhancement measures.
The important outputs of this study including thematic maps of each of the erosion governing factors and the estimated potential and actual soil loss rate can provide baseline information for the development of appropriate strategies and action plans for soil protection and for better management, directing the decision-making processes. It is also essential to know the relative strength of influence of each input variable on annual soil erosion rates. Setting priorities for treatments and allocating resources could be easier when one is aware of the relative strengths of effect of each input variable on yearly rates of soil erosion. Moreover, Results from the RUSLE model provides first-hand information for local governmental and non-governmental institutions, and land management experts to raise awareness and create programs for urgent attention and long-term soil conservation structures mainly for areas of high rates of soil erosion before turning to irreversible levels. This study is not merely helpful for the Werda’s land-managers, but also for policymakers, development planners, local land managers, concerned NGOs, and any responsible bodies particularly those who are interested to develop soil conservation programs, and sound management strategies within the sub catchment area. In essence, this study will also serve as a source of baseline data/ information for those who are intended to do similar or related researches within the country or anywhere across the world.
Overall, the study highlights the importance of applying remote sensing and GIS technologies along with the RUSLE model to establish conservation efforts for soil, provide baseline data for decision-making, and assist local institutions in managing and protecting soil. However, a great deal more attention should be given to the areas as it is at potential risk of soil erosion. Given the large scale of the watershed area, the urgency of the problem, and the lack of resources, our estimation of soil erosion provides notional basses that area needs immediate action to sustain the soil of area. However, further research on severity analysis and area prioritization, and sediment loss estimation in this watershed is highly recommended to develop practical way of conserving and managing practices.
Authors’ contributions
Degfie Teku: Design the research, data collection and writing original draft. Nega Kesete: Methodology, interpretation of data and analysis. Abebaw Abebe: literature review, data coding, writing and editing final draft.
Disclosure of interest
This research has no any conflict of interest.
Disclosure statement
The authors declare there is no Complete of Interest at this study.
Data availability statement
The data that support the findings of this study are available from the corresponding author upon reasonable request. Author address can be found from the abstract page.
Additional information
Funding
Notes on contributors
Degfie Teku
Degfie Teku obtained his BSc. degree in Geology from University of Gonder and his MSc. degree in Environmental Geology in university of Gonder. He is a lecturer and a researcher in the Department of Geology at Mekdela Amba University. He is now engaged in teaching, research and community service. His special research interests are geological hazard, climate and land degradation.
Nega Kesete
Nega Kesete obtained his MSc. degree in surface hydrology. He is now a PhD candidate at Bahir Dar university in climatology. He has worked in lecturer and researcher position at Ambo university and Mekdela Amba university in department of natural resource management. His primary research interests are land degradation, climate, environmental hazard, water resource management and GIS.
Abebaw Abebe
Abebaw Abebe obtained his BSc. degree in Agricultural economics from Jimma University and his MSc. degree in Agricultural information and communication management from Haramaya university. He is a lecturer and a researcher in the Department of Rural Development and Agricultural Extension at Mekdela Amba University. He is now engaged in teaching, research and community service. His special research interests are agricultural and environmental information analysis, risk and uncertainty analysis, socio-economic, agricultural market analysis, value chain analysis and food security.
Reference
- Adediji, A., Tukur, A. M., & Adepoju, K. A. (2010). Assessment of revised universal soil loss equation (RUSLE) in Katsina area, Katsina state of Nigeria using remote sensing (RS) and geographic information system (GIS). Iranian (Iranica) Journal of Energy & Environment, 1(3), 1–18.
- Alewoye Getie, M., Legesse, S. A., Mekonnen, M., & Aschalew, A. (2020). Soil properties and crop productivity strategies as a potential climate variability adaptation options in Adefwuha Watershed, Ethiopia. Earth Systems and Environment, 4(2), 359–368. https://doi.org/10.1007/s41748-020-00156-8
- Alexakis, D. D., Hadjimitsis, D. G., & Agapiou, A. (2013). Integrated use of remote sensing, GIS and precipitation data for the assessment of soil erosion rate in the catchment area of “Yialias” in Cyprus. Atmospheric Research, 131, 108–124. https://doi.org/10.1016/j.atmosres.2013.02.013
- Alexandridis, T. K., Sotiropoulou, A. M., Bilas, G., Karapetsas, N., & Silleos, N. G. (2015). The effects of seasonality in estimating the C-factor of soil erosion studies. Land Degradation & Development, 26(6), 596–603. https://doi.org/10.1002/ldr.2223
- Almagro, A., Thomé, T. C., Colman, C. B., Pereira, R. B., Junior, J. M., Rodrigues, D. B. B., & Oliveira, P. T. S. (2019). Improving cover and management factor (C-factor) estimation using remote sensing approaches for tropical regions. International Soil and Water Conservation Research, 7(4), 325–334. https://doi.org/10.1016/j.iswcr.2019.08.005
- Andrew, A., Ajiboye, J. O., Ibrahim, E. S., Gajere, E. N., Itse, A., & Shaba, H. A. (2022). Soil loss estimation using remote sensing and RUSLE model in Koromi-Federe catchment area of jos-east LGA, Plateau State, Nigeria.
- Andualem, T. G., Hagos, Y. G., Kefale, A., & Zelalem, B. (2020). Soil erosion-prone area identification using multi-criteria decision analysis in Ethiopian highlands. Modeling Earth Systems and Environment, 6(3), 1407–1418. https://doi.org/10.1007/s40808-020-00757-2
- Aneseyee, A. B., Elias, E., Soromessa, T., & Feyisa, G. L. (2020). Land use/land cover change effect on soil erosion and sediment delivery in the Winike watershed, Omo Gibe Basin, Ethiopia. The Science of the Total Environment, 728, 138776. https://doi.org/10.1016/j.scitotenv.2020.138776
- Ashiagbor, G., Forkuo, E. K., Laari, P., & Aabeyir, R. (2013). Modeling soil erosion using RUSLE and GIS tools. Int J Remote Sens Geosci, 2(4), 1–17.
- Ayalew, D. A., Deumlich, D., Šarapatka, B., & Doktor, D. (2020). Quantifying the sensitivity of NDVI-based C factor estimation and potential soil erosion prediction using Spaceborne earth observation data. Remote Sensing, 12(7), 1136. https://doi.org/10.3390/rs12071136
- Ayalew, G., & Selassie, Y. G. (2015). Soil loss estimation for soil conservation planning using geographic information system in Guang watershed, Blue Nile basin. J Environ Earth Sci, 5(1), 126–134.
- Balabathina, V. N., Raju, R. P., Mulualem, W., & Tadele, G. (2020). Estimation of soil loss using remote sensing and GIS-based universal soil loss equation in northern catchment of Lake Tana Sub-basin, Upper Blue Nile Basin, Northwest Ethiopia. Environmental Systems Research, 9(1), 1–32. https://doi.org/10.1186/s40068-020-00203-3
- Balcha, S. K., Awass, A. A., Hulluka, T. A., Ayele, G. T., & Bantider, A. (2022). Hydrological Simulation in a Rift-Bounded Lake System and Implication of Water Abstraction: Central Rift Valley Lakes Basin, Ethiopia. Water, 14(23), 3929. https://doi.org/10.3390/w14233929
- Bastola, S., Seong, Y. J., Lee, S. H., Shin, Y., & Jung, Y. (2019). Assessment of soil erosion loss by using RUSLE and GIS in the Bagmati basin of Nepal. Journal of the Korean GEO-Environmental Society, 20(3), 5–14.
- Bekele, D. A., Gella, G. W., & Ejigu, M. A. (2022). Erosion risk assessment: A contribution for conservation priority area identification in the sub-basin of Lake Tana, north-western Ethiopia. International Soil and Water Conservation Research, 10(1), 46–61. https://doi.org/10.1016/j.iswcr.2021.04.010
- Bekele, M. (2021). Geographic information system (GIS) based soil loss estimation using RUSLE model for soil and water conservation planning in anka_shashara watershed, southern Ethiopia. International Journal of Hydrology, 5(1), 9–27. https://doi.org/10.15406/ijh.2021.05.00260
- Belayneh, M., Yirgu, T., & Tsegaye, D. (2019). Potential soil erosion estimation and area prioritization for better conservation planning in Gumara watershed using RUSLE and GIS techniques. Environmental Systems Research, 8(1), 20. https://doi.org/10.1186/s40068-019-0149-x
- Berendse, F., van Ruijven, J., Jongejans, E., & Keesstra, S. (2015). Loss of plant species diversity reduces soil erosion resistance. Ecosystems, 18(5), 881–888. https://doi.org/10.1007/s10021-015-9869-6
- Boateng, E., Breuning-Madsen, H., Jones, R. J., King, D., Nachtergaele, F., & Montanarella, L. (2008). A proposal for the compliation of a soil profile analytical database for West Africa. West African Journal of Applied Ecology, 1(1) https://doi.org/10.4314/wajae.v1i1.40568
- Bombino, G., Porto, P., Tamburino, V., & Zimbone, S. M. (2004). Crop and management factor estimate for applying RUSLE in rangeland areas [Paper presentation]. 2004 ASAE Annual Meeting (p. 1), American Society of Agricultural and Biological Engineers.
- Botanie, D. T. (2022). Interbasin transfer of water as an option to mitigate the impact of climate variability on stream flow of Meki river watershed.
- Cassol, E. A., Silva, T. S. D., Eltz, F. L. F., & Levien, R. (2018). Soil erodibility under natural rainfall conditions as the K factor of the universal soil loss equation and application of the nomograph for a subtropical Ultisol. Revista Brasileira de Ciência Do Solo, 42(0), e0170262. https://doi.org/10.1590/18069657rbcs20170262
- Chakrabortty, R., & Pal, S. C. (2023). Modeling soil erosion susceptibility using GIS-based different machine learning algorithms in monsoon dominated diversified landscape in India. Modeling Earth Systems and Environment, 9(2), 2927–2942. https://doi.org/10.1007/s40808-022-01681-3
- Chuenchum, P., Xu, M., & Tang, W. (2019). Estimation of soil erosion and sediment yield in the Lancang–Mekong River using the modified revised universal soil loss equation and GIS techniques. Water, 12(1), 135. https://doi.org/10.3390/w12010135
- Colman, C. B., Garcia, K. M. P., Pereira, R. B., Shinma, E. A., Lima, F. E., Gomes, A. O., & Oliveira, P. T. S. (2018). Different approaches to estimate the sediment yield in a tropical watershed. RBRH, 23(0), 1–9. https://doi.org/10.1590/2318-0331.231820170178
- Degife, A., Worku, H., & Gizaw, S. (2021). Environmental implications of soil erosion and sediment yield in Lake Hawassa watershed, south-central Ethiopia. Environmental Systems Research, 10(1), 24. https://doi.org/10.1186/s40068-021-00232-6
- Demlie, M., Wohnlich, S., & Ayenew, T. (2008). Major ion hydrochemistry and environmental isotope signatures as a tool in assessing groundwater occurrence and its dynamics in a fractured volcanic aquifer system located within a heavily urbanized catchment, Central Ethiopia. Journal of Hydrology, 353(1–2), 175–188. https://doi.org/10.1016/j.jhydrol.2008.02.009
- Dendir, Z., & Simane, B. (2019). Livelihood vulnerability to climate variability and change in different agroecological zones of Gurage Administrative Zone, Ethiopia. Progress in Disaster Science, 3, 100035. https://doi.org/10.1016/j.pdisas.2019.100035
- Deressa, A., Yli-Halla, M., & Mohamed, M. (2020). Soil organic carbon stock and retention rate among land uses along Didessa toposequence in humid Western Ethiopia. Environmental Systems Research, 9(1), 1–12. https://doi.org/10.21203/rs.3.rs-75409/v1
- Durigon, V., Carvalho, D., Antunes, M., Oliveira, P., & Fernandes, M. (2014). NDVI time series for monitoring RUSLE cover management factor in a tropical watershed. International Journal of Remote Sensing, 35(2), 441–453. https://doi.org/10.1080/01431161.2013.871081
- Dutta, D., Das, S., Kundu, A., & Taj, A. (2015). Soil erosion risk assessment in Sanjal watershed, Jharkhand (India) using geo-informatics, RUSLE model and TRMM data. Modeling Earth Systems and Environment, 1(4), 1–9. https://doi.org/10.1007/s40808-015-0034-1
- Egbueri, J. C., Igwe, O., & Ifediegwu, S. I. (2022). Erosion risk mapping of Anambra State in southeastern Nigeria: Soil loss estimation by RUSLE model and geoinformatics. Bulletin of Engineering Geology and the Environment, 81(3), 91. https://doi.org/10.1007/s10064-022-02589-z
- Erol, A., Koşkan, Ö., & Başaran, M. A. (2015). Socioeconomic modifications of the universal soil loss equation. Solid Earth. 6(3), 1025–1035. https://doi.org/10.5194/se-6-1025-2015
- Fao, F. (2015). Agriculture Organization: Status of the World’s Soil Resources (SWSR)–Main Report. Food and Agriculture Organization of the United Nations and Intergovernmental Technical Panel on Soils, Rome, Italy.
- Ferro, V., & Porto, P. (2000). Sediment delivery distributed (SEDD) model. Journal of Hydrologic Engineering, 5(4), 411–422. https://doi.org/10.1061/(ASCE)1084-0699(2000)5:4(411)
- Fournier, F. (1962). Map of erosion danger in Africa south of the Sahara. Explanatory Note. EEC, Commission for Technical Cooperation in Africa.
- Gessesse, B., Bewket, W., & Bräuning, A. (2015). Model-based characterization and monitoring of runoff and soil erosion in response to land use/land cover changes in the Modjo watershed, Ethiopia. Land Degradation & Development, 26(7), 711–724. https://doi.org/10.1002/ldr.2276
- Getu, L. A., Nagy, A., & Addis, H. K. (2022). Soil loss estimation and severity mapping using the RUSLE model and GIS in Megech watershed, Ethiopia. Environmental Challenges, 8, 100560. https://doi.org/10.1016/j.envc.2022.100560
- Ghafari, H., Gorji, M., Arabkhedri, M., Roshani, G. A., Heidari, A., & Akhavan, S. (2017). Identification and prioritization of critical erosion areas based on onsite and offsite effects. CATENA, 156, 1–9. https://doi.org/10.1016/j.catena.2017.03.014
- Girma, R., & Gebre, E. (2020). Spatial modeling of erosion hotspots using GIS-RUSLE interface in Omo-Gibe river basin, Southern Ethiopia: Implication for soil and water conservation planning. Environmental Systems Research, 9(1), 1–14. https://doi.org/10.1186/s40068-020-00180-7
- Hagos, Y. (2020). Estimating landscape vulnerability to soil erosion by RUSLE model using GIS and remote sensing: A case of Zariema watershed.
- Haile, G. W., & Fetene, M. (2012). Assessment of soil erosion hazard in Kilie catchment, East Shoa, Ethiopia. Land Degradation & Development, 23(3), 293–306. https://doi.org/10.1002/ldr.1082
- Hurni, H. (1985). Erosion-productivity-conservation systems in Ethiopia. Proceedings of 4th international conference on soil conservation. Maracay, Venezuela, 3-9 Novem-ber, 654–674.
- Hurni, K., Zeleke, G., Kassie, M., Tegegne, B., Kassawmar, T., Teferi, E., Moges, A., Tadesse, D., Ahmed, M., Degu, Y., Kebebew, Z., Hodel, E., Amdihun, A., Mekuriaw, A., Debele, B., Deichert, G., & Hurni, H. (2015). The economics of land degradation. Ethiopia case study: Soil degradation and sustainable land management in the rain fed agricultural areas of Ethiopia: An assessment of the economic implications. Rep. Econ. Land Degrad.
- Jothimani, M., Getahun, E., & Abebe, A. (2022). Remote sensing, GIS, and RUSLE in soil loss estimation in the Kulfo river catchment, Rift valley, Southern Ethiopia. Journal of Degraded and Mining Lands Management, 9(2), 3307–3315. https://doi.org/10.15243/jdmlm.2022.092.3307
- Kebede, S., & Fufa, F. (2023). Estimation of average annual soil loss rates and its prioritization at sub-watershed level using RUSLE: A case of Finca’aa, Oromiya, Western Ethiopia. Environmental Health Engineering and Management, 10(1), 41–50. https://doi.org/10.34172/EHEM.2023.05
- Kiptoo, O., & Mirzabaev, A. (2014). Economics of land degradation in Eastern Africa.
- Legesse, D., Vallet-Coulomb, C., & Gasse, F. (2004). Analysis of the hydrological response of a tropical terminal lake, Lake Abiyata (Main Ethiopian Rift Valley) to changes in climate and human activities. Hydrological Processes, 18(3), 487–504. https://doi.org/10.1002/hyp.1334
- Moisa, M. B., Dejene, I. N., Merga, B. B., & Gemeda, D. O. (2022). Soil loss estimation and prioritization using geographic information systems and the RUSLE model: A case study of the Anger River sub-basin, Western Ethiopia. Journal of Water and Climate Change, 13(3), 1170–1184. https://doi.org/10.2166/wcc.2022.433
- Moore, I. D., & Wilson, J. P. (1992). Length-slope factors for the Revised Universal Soil Loss Equation: Simplified method of estimation. Journal of Soil and Water Conservation, 47(5), 423–428.
- Negese, A., Fekadu, E., & Getnet, H. (2021). Potential soil loss estimation and erosion-prone area prioritization using RUSLE, GIS, and remote sensing in Chereti Watershed, Northeastern Ethiopia. Air, Soil and Water Research, 14, 117862212098581. https://doi.org/10.1177/1178622120985814
- Pal, S. C., & Chakrabortty, R. (2019a). Modeling of water induced surface soil erosion and the potential risk zone prediction in a sub-tropical watershed of Eastern India. Modeling Earth Systems and Environment, 5(2), 369–393. https://doi.org/10.1007/s40808-018-0540-z
- Pal, S. C., & Chakrabortty, R. (2019b). Simulating the impact of climate change on soil erosion in sub-tropical monsoon dominated watershed based on RUSLE, SCS runoff and MIROC5 climatic model. Advances in Space Research, 64(2), 352–377. https://doi.org/10.1016/j.asr.2019.04.033
- Pal, S. C., & Chakrabortty, R. (2022). Soil loss estimation using different empirical and semi-empirical models. In Climate change impact on soil erosion in sub-tropical environment: Application of empirical and semi-empirical models (pp. 67–87). Springer International Publishing.
- Pal, S. C., Chakrabortty, R., Arabameri, A., Santosh, M., Saha, A., Chowdhuri, I., Roy, P., & Shit, M. (2022a). Chemical weathering and gully erosion causing land degradation in a complex river basin of Eastern India: An integrated field, analytical and artificial intelligence approach. Natural Hazards, 110(2), 847–879. https://doi.org/10.1007/s11069-021-04971-8
- Pal, S. C., Chakrabortty, R., Roy, P., Chowdhuri, I., Das, B., Saha, A., & Shit, M. (2021). Changing climate and land use of 21st century influences soil erosion in India. Gondwana Research, 94, 164–185. https://doi.org/10.1016/j.gr.2021.02.021
- Pal, S. C., Ruidas, D., Saha, A., Islam, A. R. M. T., & Chowdhuri, I. (2022b). Application of novel data-mining technique based nitrate concentration susceptibility prediction approach for coastal aquifers in India. Journal of Cleaner Production, 346, 131205. https://doi.org/10.1016/j.jclepro.2022.131205
- Peccerillo, A., Mandefro, B., Solomon, G., Bedru, H., & Tesfaye, K. (1998). The Precambrian rocks from Southern Ethiopia: Petrology, geochemistry and their interaction with the recent volcanism from the Ethiopian Rift Valley. Neues Jahrbuch für Mineralogie – Abhandlungen, 173(3), 237–262. https://doi.org/10.1127/njma/173/1998/237
- Piniewski, M., Bieger, K., & Mehdi, B. (2019). Advancements in Soil and Water Assessment Tool (SWAT) for ecohydrological modelling and application. Ecohydrology & Hydrobiology, 19(2), 179–181. https://doi.org/10.1016/j.ecohyd.2019.05.001
- Renard, K. G. (1997). Predicting soil erosion by water: A guide to conservation planning with the Revised Universal Soil Loss Equation (RUSLE). US Department of Agriculture, Agricultural Research Service.
- Renard, K. G., Laflen, J. M., Foster, G. R., & McCool, D. K. (2017). The revised universal soil loss equation. Soil Erosion Research Methods, 105–126. https://doi.org/10.1201/9780203739358-5
- Roy, P., Pal, S. C., Chakrabortty, R., Islam, A. R. M. T., Chowdhuri, I., & Saha, A. (2023). The role of indigenous plant species in controlling the erosion of top soil in sub-tropical environment: In-situ field observation and validation. Journal of Hydrology, 625, 129993. https://doi.org/10.1016/j.jhydrol.2023.129993
- Smaling, E. M. A., & Oenema, O. (2020). Estimating nutrient balances in agro-ecosystems at different spatial scales. Methods for Assessment of Soil Degradation, 229–252. https://doi.org/10.1201/9781003068716-12
- Soemitro, R. A. A., & Asmaranto, R. (2016). The effect of drying – wetting cycles to the Wischmeier soil erodibility factors. Japanese Geotechnical Society Special Publication, 2(15), 595–598. https://doi.org/10.3208/jgssp.INA-06
- Strahler, A. H., & Strahler, A. (2013). Introducing physical geography. Wiley.
- Tadesse, S., Milesi, J.-P., & Deschamps, Y. (2003). Geology and mineral potential of Ethiopia: A note on geology and mineral map of Ethiopia. Journal of African Earth Sciences, 36(4), 273–313. https://doi.org/10.1016/s0899-5362(03)00048-4
- Tesfaye, A. (2015). GIS-based time series assessment of soil erosion risk using RUSLE model: A case study of Cheraqe Watershed, Bilate River Sub-Basin, AAU, Ethiopia.
- Teshome, A., Halefom, A., Teshome, M., Ahmad, I., Taddele, Y., Dananto, M., Demisse, S., & Szucs, P. (2021). Soil erosion modelling using GIS and revised universal soil loss equation approach: A case study of Guna-Tana landscape, Northern Ethiopia. Modeling Earth Systems and Environment, 7(1), 125–134. https://doi.org/10.1007/s40808-020-00864-0
- Tesema, T. A. (2015). GIS-based time series assessment of soil erosion risk using RUSLE Model: A case study of Cheraqe watershed, Bilate river sub-basin. Thesis submitted to College of Natural Science School of Graduate Studies Center for Environmental Science [doctoral dissertation]. Addis Ababa university [Google scholar].
- Thapa, P. (2020). Spatial estimation of soil erosion using RUSLE modeling: A case study of Dolakha district, Nepal. Environmental Systems Research, 9(1), 1–10. https://doi.org/10.1186/s40068-020-00177-2
- Tsegaye, L., & Bharti, R. (2021). Soil erosion and sediment yield assessment using RUSLE and GIS-based approach in Anjeb watershed, Northwest Ethiopia. SN Applied Sciences, 3(5), 1–19. https://doi.org/10.1007/s42452-021-04564-x
- Ugese, A. A., Ajiboye, J. O., Ibrahim, E. S., Gajere, E. N., Itse, A., & Shaba, H. A. (2022). Soil loss estimation using remote sensing and RUSLE model in Koromi-Federe catchment area of Jos-East LGA, plateau state, Nigeria. Geomatics, 2(4), 499–517. https://doi.org/10.3390/geomatics2040027
- Williams, J. R., Arnold, J. G., Kiniry, J. R., Gassman, P. W., & Green, C. H. (2008). History of model development at Temple, Texas. Hydrological Sciences Journal, 53(5), 948–960. https://doi.org/10.1623/hysj.53.5.948
- Wischmeier, W. H., & Smith, D. D. (1978). Predicting rainfall erosion losses: A guide to conservation planning (No. 537). Department of Agriculture, Science and Education Administration.
- Yesuph, A. Y., & Dagnew, A. B. (2019). Soil erosion mapping and severity analysis based on RUSLE model and local perception in the Beshillo Catchment of the Blue Nile Basin, Ethiopia. Environmental Systems Research, 8(1), 1–21. https://doi.org/10.1186/s40068-019-0145-1
- Zanchin, M., Moura, M. M. D., Nunes, M. C. M., Beskow, S., Miguel, P., Lima, C. L. R. D., & Bressiani, D. D. A. (2021). Soil loss estimated by means of the RUSLE model in a subtropical climate watershed. Revista Brasileira de Ciência Do Solo, 45. https://doi.org/10.36783/18069657rbcs20210050