
 ?Mathematical formulae have been encoded as MathML and are displayed in this HTML version using MathJax in order to improve their display. Uncheck the box to turn MathJax off. This feature requires Javascript. Click on a formula to zoom.
Abstract
The rising shortage of and competition for irrigation water necessitates the adoption of novel measures that promote efficient water application methods. Deficit irrigation is becoming more popular as a means of reducing water consumption without negatively affecting output in the context of improving water use efficiency. At Haramaya University, a field experiment was conducted to investigate the effects of straw mulch levels and deficit watering on the yield components, yield, and water consumption efficiency of hot peppers (Capsicum annum L). Four levels of vetiver straw mulch (0, 3, 6, and 9 tons per ha) and three irrigation levels (100%, 75%, and 50% of ETc) were used in the factorial arrangement of a randomized complete block design with three replications. The experimental plot that got 100% ETc irrigation together with 6 t/ha of straw mulch produced the highest marketable yield (12.36 t/ha), whereas the plots that received 50% ETc irrigation and no mulch produced the lowest yield (4.66 t/ha). Plots received 50% ETc irrigation and 9 t/ha straw mulch, and 100% ETc irrigation and no mulch, respectively, exhibited the highest water consumption efficiency (3.99 kg/m3) and the lowest water consumption efficiency (1.95 kg/m3) values. Water saved, increased area to be farmed and extra yield due to conserved water attained from the plot that was treated with 75% ETc irrigation and 6 t/ha straw mulch were 1148.5 m3, 0.33 ha, and 4.02 tonnes, respectively. Thus, for successful hot pepper production in the research area and other areas with comparable agroecology, irrigating with 75% ETc mixed with 6 t/ha straw mulch may be suggested in terms of marketable hot pepper yield, economically appealing benefit, and water consumption efficiency.
Reviewing Editor:
1. Introduction
The farming sector is under increasing pressure to efficiently utilize existing water for irrigation to produce additional food to meet the growing global population due to increased water demand from factories and municipal sectors (Valipour, Citation2014). Deficit irrigation, which allows for mild stress with no influence on yield while lowering water delivery below its maximum level, is gaining popularity as a technique for enhancing water productivity (Vanuytrecht et al., Citation2014). Regulated deficit irrigation is a water conservation strategy that is relatively affordable and straightforward to employ (Webber et al., Citation2006). By increasing yield per unit of water consumed, deficit irrigation can boost water consumption efficiency in times of water stress and drought (Mardani et al., Citation2017).
Applying mulch to the soil is another technique for retaining soil moisture. By doing so, mulches may be employed to maintain moisture, boost crop development, increase plant water consumption efficiency, and enhance the quality of yield (El-Beltagi et al., Citation2022). Mulch usage has grown into an important agricultural practice across the world (McMillen, Citation2013). By promoting appropriate moisture and temperature conditions, mulch has helped producers boost crop production efficiency, and mulch has a large influence on the microclimate around the plant and the soil (Abd El-Mageed et al., Citation2018). Mulching, in combination with managed deficit watering, is likely to boost crop output. Deficit irrigation is a cost-effective and easily implementable water conservation strategy that reduces water supply to improve crop productivity and minimize negative impacts on yield during periods of water scarcity and drought (Mardani et al., Citation2017). Zhang et al. (Citation2014) found that combining managed deficit irrigation and mulching can increase crop output by decreasing soil evaporation, improving water infiltration, and preserving soil moisture. Straw mulching also conserved 30% of irrigation water and improved water usage efficiency.
The yield of hot pepper has been observed to be reliant, among other parameters, on the moisture available in soil (Voor et al., Citation2018). Farmers in the study region utilize groundwater for irrigation and extensive groundwater abstraction leads to groundwater depletion. Due to this difficulty, farmers cannot readily get irrigation water; this leads to poor production and water deficit in the research region. Deficit irrigation and straw mulches are known to individually conserve limited water however, there has not been research done to utilize surface irrigation in combination with surface covering for varied climates and crops under moisture stress in Ethiopia and in the study location. However, farmers in the research region do not have adequate knowledge and awareness of soil water conservation methods using mulch and determining acceptable deficit irrigation levels without substantial impact on output. Understanding the yield response factor of hot pepper with deficit irrigation throughout the growing seasons is critical for the effective scheduling of limited water supply and for improved crop management practices connected to soil moisture.
This study was conducted to:
Investigate the effect of deficit irrigation and straw mulch levels on yield and yield components of hot pepper.
Evaluate the effect of deficit irrigation and straw mulch levels on water use efficiency.
2. Materials and methods
2.1. Description of the study area
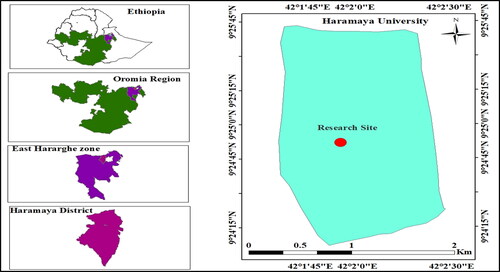
The experiment was done at Haramaya University main campus. Geographically, the experimental location is located at 90 -25’ N latitude and 420 -02’ E longitude with an altitude of 1980 meters above sea level (m a. s. l) (). Haramaya district is found in East Hararghe Zone of Oromia National Regional State at 503 kilometers from Addis Ababa towards the east.
Figure 1. Geographical location of the study area.
2.2. Treatment and experimental design
The experimental design was RCBD design with three replications. Treatments consisted of three levels of deficit irrigation treatments (100% ETc, 75% ETc, and 50% ETc; 100% ETc was the control irrigation application) and four mulch levels (0, 3, 6, and 9 t/ha) (). The experimental setup was factorial resulting in 12 treatments combination. The treatments were allocated randomly by lottery technique.
Table 1. Treatment’s combinations of the experiment.
2.2.1. Preparation of experimental plot
A tractor was used to plow the experimental field, which was then leveled and made appropriate by dividing it into 36 experimental plots, each measuring 4.2 by 4.5 meters. a plot with five rows, each measuring 4.5 meters long and 70 centimeters apart. The middle four furrows of the six-furrow plot were used as the net plot area, from which the data was collected. Plots and replications were spaced 1.5 and 2 meters apart, respectively, to lessen the effect of lateral subsurface water movement. Plants and rows were separated by 30 and 70 centimeters, respectively. Consequently, a plot could hold 70 plants, and a row could hold 14 plants. In each plot, the first plant was positioned 15 cm from the border row. Not too long after the seedlings were transplanted, straw mulch was applied. The straw mulch was dried vetiver grass (Vetiveria zizanioides L).
2.2.2. Transplanting of seedlings
Uniform, robust, and strong seedlings of the Melka Awaze variety with a height of 20 – 25 cm (EARO, 2004) were transplanted (after approximately 6 – 7 weeks in the nursery) onto the trial field on beds at the appropriate intervals in the established plots.
2.3. Agronomic operations
A seedbed was established after the nursery bed’s land was fine-tilled by plowing and harrowing. The nursery bed was seeded, and after the seed was sown, it was watered with a watering can and covered with grass mulch until the plants emerged. The water supply to the nursery seed bed was reduced one week before transplantation to help the seedlings become hardy and prevent stress during the transplant process. The seedlings were watered before transplantation to make uprooting easier and reduce root damage.
2.4. Data collection, computation and analyses
2.4.1. Soil sampling and analysis
Soil profiles were opened and composite soil samples were obtained from the experimental field prior to crop transplantation. In order to gather samples of disturbed and undisturbed soil, depths of 0–20, 20–40, 40–60, and 60–80 cm were considered, assuming that the hot pepper’s root system is 80 cm deep. An auger was used to gather the disturbed samples, while a core sampler was employed to get the undisturbed samples. The soil samples were combined, allowed to air dry on the ground, and then run through a 2 mm sieve to analyze the relevant physical and chemical properties except for total nitrogen and organic carbon. To analyze the total nitrogen and organic carbon, the samples were further crushed and put through a 0.50 mm screen.
2.4.2. Soil texture
The USDA soil textural triangle was used to define the textural class of the soil, and the Bouyoucos hydrometer technique (Bouyoucos, Citation1962) was used to assess the texture of the soil. The core approach was used to calculate bulk density (Blake, Citation1965). The bulk density was computed as the ratio of the oven-dry mass of the soil to the volume of the undisturbed samples (core samples), after which the samples were dried to constant weight in an open set at 105 °C (Webster, Citation2005):
(3.1)
(3.1)
where, ρb = bulk density (g/cm3), Ms = mass of oven-dry soil (g), Vt = total volume of the soil core (cm3), r = internal radius of the core, and h is the height of the core.
The samples were placed in a pressure plate apparatus at 0.33 and 15 bars, respectively, after being soaked for the whole day (24 hours) and water was allowed to drain from the saturated soil. Measurements were made of the moisture retention capacity at the permanent wilting point (PWP) and field capacity (FC). The samples were removed from the plates after checking that no more water was draining for about 24 hours. The equilibrium moisture content at the two suctions were determined gravimetrically. Then, the total available water-holding capacity of the soil was calculated as:
(3.2)
(3.2)
where; θFC and θPWP are in % on a volume basis calculated from the gravimetric moisture content as:
(3.3)
(3.3)
where θv and θm are volumetric and gravimetric moisture contents, respectively, and ρw is the density of water (1 g/cm3) and TAW is total available water (mm/m)
Before irrigating the plot from the middle furrow of each plot, soil samples were obtained using an auger from depths of 0 to 20, 20 to 40, 40 to 60, and 60 to 80 cm in order to measure the initial soil moisture content. The moist soil samples were put in an oven and dried until they reached a consistent weight at 105 °C. The following relationships were used to establish its percent gravimetric water content:
(3.4)
(3.4)
where θm is the gravimetric soil moisture content at the time of sampling (%), Mw is mass of water, Ms is mass of oven dry soil, and Mt is mass of the wet soil (g).
Total nitrogen was calculated using the micro Kjeldahl method (Sahrawat & Prasad, Citation1975), whereas available P was determined by using the technique described by Olsen (Citation1954). The organic carbon content was ascertained by employing the wet Walkley and Black oxidation technique (Walkley & Black, Citation1934). Using a pH meter in the supernatant solution of a 1:2.5 soil-to-water ratio that has a glass electrode, the soil’s reaction pH was determined potentiometrically, following Jackson’s 1958 specifications. Van Reeuwijk (Citation1992) used a conductivity meter to measure the soil’s electrical conductivity (ECe).
2.4.3. Water sampling and analysis
Using a sample bottle and the appropriate sampling equipment, one litter of water was obtained from the water source at a typical sampling location. The water was then sent to a soil laboratory for measurements of pH, Mg, Ca, Na, and electrical conductivity of water (ECiw) for irrigation water quality evaluation. Following sample extraction with a 1 N NH4OAc solution at pH 7.0, the exchangeable cations (Ca, Mg, and Na) were identified. Atomic absorption spectrophotometers (AAS) were used to evaluate the extract’s exchangeable Ca and Mg, while flame photometers were used to assess the extract’s Na (Rowell, Citation2014).
(3.5)
(3.5)
Where:
Na, Ca and Mg represent the concentrations in meq/L of the respective ions in water (or solution).
Calcium and Mg were determined directly from the water sample using AAS while K and Na were determined by a flame photometer (Chapman, Citation1965).
2.4.4. Determination of crop water requirement
2.4.4.1. Reference evapotranspiration (ETo)
ETo was calculated using daily meteorological data that was gathered over an extended period (1990–2020). The meteorological parameters that were used were wind speed at two meters, relative humidity (H), hours of sunshine (hrs), maximum temperature (Tmax), and lowest temperature (Tmin). The FAO CROPWAT software version 8.0 was used to calculate the ETo using the FAO Penman-Monteith approach (Allen et al., Citation1998). The basic equation used for the calculation of crop evapotranspiration was as follows:
(3.6)
(3.6)
where, ETcr is crop evapotranspiration in (mm/day), Kc is factor in fraction called crop coefficient, and ETo is reference crop evapotranspiration in (mm/day).
The following relationship was used to determine the net irrigation water requirement:
(3.7)
(3.7)
where NIR is net irrigation requirement (mm), ETcr is crop water requirement (crop evapotranspiration in mm), Peff is effective precipitation (mm)
(3.8)
(3.8)
where, RAW is readily available water, TAW is total available water and p is depletion fraction.
The gross irrigation requirement was obtained from the following equation:
(3.9)
(3.9)
where GIR= gross irrigation requirement (mm), NIR = Net irrigation requirement (mm), Ea = application efficiency (%). Furrow irrigation application efficiency of 60% (Allen et al., Citation1998) was used in this study.
The following formula was used to determine how long it would take to provide each plot with the appropriate level of water:
(3.10)
(3.10)
where d = gross irrigation depth of water to be applied (mm), A = area of the experimental plot (m2), T = application time (min) and q = flow rate of discharge (l/s).
2.5. Phenology and growth parameters
In order to prevent border effects, the two outside rows were left uncollected during the three center rows’ data collection. In order to capture observations on growth and yield metrics, ten randomly selected and tagged plants were collected from each of the three center rows in the experimental plot.
Days to flowering: Days to flowering were measured when half of each experimental plot’s plants flowered.
Days to maturity: When 50% of the plants at each treatment were physiologically mature enough to be harvested, the number of days to maturity was noted.
Plant height (cm): Plant height was calculated as the distance, expressed in centimeters, between the topmost point of the sample plants at full maturity and the soil’s surface.
Number of branches per plant: For the sample plants, the average number of main branches per plant was recorded.
2.5.1. Yield and yield components
Number of fruits per plant: number of fruits per plant was recorded as the total number of physiologically mature fruits per plant counted over the harvest period.
Total fruit yield: total fruit yield was recorded as the sum of fresh fruit weight of each successive harvesting.
Marketable yield: marketable yield was recorded as the weight of marketable fruits.
Unmarketable yield: unmarketable yield is diseased fruit, discolored, cracked, damaged by insect, birds and sunburn and shrunken shape.
2.6. Water use efficiency
Water use efficiency was determined by dividing the harvested fruit yield (total yield) per unit volume of water used and expressed in kg/ha/mm. EquationEquation 3.16(3.1)
(3.1) water used:
(3.11)
(3.11)
where, WUE is water use efficiency (kg/ha/mm), Ya is actual yield (kg/ha) from each treatment, CWU (depth of irrigation water under different treatments) and is crop water use (mm).
Additional area to be cultivated due to saved water: was calculated from water saved and gross irrigation requirement for each treatment.
Saved irrigation water: was calculated from gross irrigation and water used by the crop for each treatment.
Saved irrigation water = Gross irrigation (m3) – Crop water use (m3) (3.12)
(3.13)
(3.13)
where, kg is Kilogram, and ha is hectare.
Additional yield due to additional area: was calculated from additional area to be cultivated due to saved water and total yield.
(3.14)
(3.14)
where, kg is kilogram, ha is hectare, AAC is additional area to be cultivated and TY is total yield.
2.7. Yield response factor
The Ky is defined as the decrease in yield per unit decrease in ET. This relationship is expressed by the following equation (Doorenbos & Kassam, Citation1979):
(3.15)
(3.15)
where the actual yields from deficit irrigation treatments are represented by Ya (kg/ha) and the maximum yields from fully irrigated treatments are represented by Ym (kg/ha). The maximum evapotranspiration (from a fully irrigated treatment) and actual evapotranspiration (from deficit irrigation treatments) are, respectively, ETm (m3/ha) and ETa (m3/ha), and the yield response factor is Ky.
2.8. Statistical analysis
The data for the RCBD design were subjected to an appropriate Analysis of Variance (ANOVA) using R software 4.0.3. The least significant difference (LSD) was used in the mean comparison to compare the differences between treatment means where there was a significant difference between treatments.
3. Results and discussion
3.1. Soil physical properties
summarizes the findings of the laboratory examination of the physical characteristics of the soils at the experimental location.
Table 2. Selected physical properties of the experimental soil.
The percentages of sand, silt, and clay varied with soil depth, according to the results of a laboratory study of the particle size distribution. As a result, the amount of sand decreased as soil depth rose, while the amount of clay grew. There was no consistent pattern seen between soil depth and silt concentration. The eluvation of the top layers and subsequent deposition in the lower layers may be the cause of the rise in clay content with soil depth. The textural class of all the layers is sandy clay loam, suggesting the dominance of the sand particles in terms of abundance in the soil, although minor differences in the % of the separates seen.
Consistent fluctuation in bulk density with soil depth was observed at the experimental location (). The top surface soil layer (0–20 cm) had a lower bulk density (1.22 g cm−3) than the subsurface soil, which might be because of the topsoil’s comparatively greater organic matter content. It fluctuated between 1.22-1.34 g/cm3. According to Hunt and Gilkes (Citation1992), the bulk density values were generally within the ideal range for the best possible air and water flow in the soil to support crop root development. shows that the water content at FC (32.4 – 38.12 (%)w/w), PWP (17.50-21.10 (%)w/w), and TAW (181.78–228.07 mm/m) also varied with soil depth, all of them increasing with soil depth. According to Moore et al. (Citation1998), the total available water values found in this research are within the typical range for a sandy clay loam soil.
3.1.1. Soil and water chemical properties
The soil’s pH varied from 7.37 to 7.59, according to the results of the chemical analysis of the soil (). Based on the soil response (pH) assessment (FAO, Citation2008), the research area’s soil is categorized as moderately alkaline (7.1–8.5). The pH readings exhibited an increasing trend with soil depth up to 60 cm. indicates that the electrical conductivity of the soil is non-saline, ranging from 0.11 to 0.16 dS/m. This suggests that the soil is appropriate for growing crops (FAO., Citation1985). It is discovered to be appropriate for irrigation as well.
Table 3. Some chemical properties of the experimental soil and irrigation water.
shows that the organic carbon (OC) ranged from 0.59 to 1.08 percent. The top soil layer had the highest amount of organic carbon, whereas the bottom layer had the lowest amount. Consequently, it was discovered that the site’s soil had relatively little organic carbon (OC), necessitating ongoing amendment with different organic inputs. Throughout the sample depths, the total nitrogen measured from the experimental field varied from 0.01 to 0.10% (). According to Tadesse et al. (Citation1991) rating system for soil TN, the experimental soil had a low level of total N (0.05–0.12%), suggesting that the nutrient is a limiting factor for the best possible crop development. The available phosporous measured from the experimental field varied from 7.12 to 16.44 (mg/kg) (). The pH of the irrigation water was within the normal range for water to be used for irrigation purpose (). The measured values of electrical conductivity of the irrigation water indicate salinity level that varies from slight to moderate (FAO., Citation1985). Furthermore, the SAR value of the irrigation water indicate that the water is safe (SAR < 10) to use for irrigation purpose (Richards, Citation1954).
3.2. Effect of deficit irrigation and straw mulch levels on hot pepper growth parameters
3.2.1. Days to 50% flowering
The main and interaction effects of the treatments had a very significant (p < 0.05) impact on the number of days till 50% flowering. The plot that got 100% ETc with 9 t/ha mulch had the longest days to 50% flowering (62.33 days), whereas the treatment that received 50% ETc with no mulch had the fewest days to flowering (43.00 days) (). Days to 50% flowering often reduced as deficit irrigation levels increased. The variation in the number of days till flowering among the various irrigation and straw mulch levels may be caused by variations in the amount of water provided at different depths and the impact of the mulch on evaporation in the individual treatments. The maximum quantity of straw mulch may have decreased evaporation from the wet soil surface, while the 100% ETc treatment has increased the amount of irrigation water applied. These two occurrences may have acted in concert to encourage vegetative development and postpone the onset of the reproductive phase. In response to higher mulch and watering levels, hot pepper plants showed a delay in the reproductive cycle and quick vegetative development. Lowering the amount of water and mulching the hot pepper plants pushed back their blooming dates.
Table 4. Interaction effects of deficit irrigation by straw mulch levels on days to 50% flowering and days to maturity of hot pepper.
The current investigation’s findings are consistent with those of Anjum et al. (Citation2011), who observed that plants attempt to escape adverse stress situations by terminating their life cycle a few days sooner than those that would occur under normal soil moisture levels. Plots treated with 50% ETc without mulch had the earliest duration to 50% blooming date, followed by those treated with 75% ETc without mulch and 50% ETc with 3 t/ha mulch. Al-Suhaibani (Citation2009) noted that plants often finish their life cycle as soon as feasible in an effort to evade the difficult circumstances and guarantee the survival of their species when they are subjected to water deficiency stress.
3.2.2. Days to maturity
The primary effects of mulch levels and deficit watering, as well as their interaction, on days to maturity were shown to be significant (p < 0.05) by analysis of variance. As a result, the treatment with the greatest irrigation (100%ETc) and mulch (9 t/ha) levels combined had the longest days to maturity (115.33 days), but treatments with 50% ETc alone did not grow as quickly as most of the other treatments (). The longer days to maturity under higher irrigation and mulch rates may be due to the fact that optimal irrigation and higher mulch rates contributed to the creation of a more favorable soil micro-environment with respect to moisture availability for the long-term vegetative growth of hot peppers. The more water used and the higher the level of straw mulch, the longer the days till maturity. This outcome demonstrated the impact of complete application and higher mulch levels in extending the hot pepper phenological periods, as shown by the treatment that got 100% ETc with 9 t/ha of straw mulch. As the amount of water applied rose, the number of days it took for the pepper to reach maturity also increased. Conversely, plants that reach maturity early in a water deficit environment are more likely to finish their life cycle a few days earlier than plants in normal or high soil moisture levels, allowing them to escape the adverse conditions and ensure the species’ continuation. This result is consistent with that of Gebrtsadkan et al. (Citation2018), who found that under various drip irrigation regimes, the pepper growth season lasted 103.5 days total after transplanting under full crop water requirements.
3.2.3. Plant height
The results of the analysis of variance showed that either the main and interaction effects of the two treatments were very significant (p < 0.05) or that the main effects of the two treatments and their interaction had a very substantial influence on plant height. The experimental plots that got 50% ETc without mulch had the shortest plants (48.38 cm), whereas the plot that received 100% ETc with 9 t/ha straw mulch had the tallest plants (81.30 cm) (). This might be due to the adequate availability of moisture from the full irrigation application and its conservation by the applied mulch through reduction of water loss by evaporation. The maximum plant height may have resulted from vegetative growth that was encouraged by sufficient moisture and its conservation. All deficit irrigation treatments with mulch, when it came to plant height, often resulted in higher plants than the corresponding deficit irrigation treatments without mulch. The mean value of plant height has demonstrated a declining trend in plant height with decreasing water application. The growing plant height with proper depth of irrigation and straw mulching also reflects the positive effects of water in sustaining the turgor pressure of the cell which is the key prerequisite for growth (Ramada & Ramanathan, Citation2017). On the contrary, the shortening of plant height under soil moisture stress can be attributed to stomata closure and lower CO2 and nutrient absorption by the plants, which in turn impair photosynthesis and other biochemical activities, impacting plant development. This study concludes that the plant height of pepper reduced with lower irrigation levels. Similarly, Karasu et al. (Citation2015) expected plant height to be greater with full irrigation (100% ETc) and lower with deficit irrigation applied throughout the crop growing season. Similar findings on pepper plant height under mulched and unmulched treatments were also reported by Choudhary et al. (Citation2012).
Table 5. Interaction effect of deficit irrigation and straw mulch levels on plant height and number of branches per plant of hot pepper.
3.2.4. Number of branches per plant
The amount of straw mulching and deficit watering had a significant (P < 0.01) effect on the number of pepper branches per plant. The number of pepper branches per plant was significantly (P < 0.01) impacted by the interaction between the two factors, as demonstrates. The experimental plots treated with 100% ETc and 9 t/ha of straw mulching produced the highest number of branches (22.00) per plant; nevertheless, there was no statistically significant difference between these plots and the plots treated with 100% ETc and 6 t/ha. Plots treated with 50% ETc and no straw mulch, on the other hand, had the fewest branches per plant (11) and showed no statistically significant difference when compared to 50% ETc plus 3 t/ha of mulch and 75% ETc plus no straw mulch. Better soil moisture availability, which enhances plant vegetative development by promoting cell division and elongation, may be the primary cause of the increase in branches per plant seen with increased irrigation water (Ahmadi & Bahrani, Citation2009).
In general, the tallest plants tended to have a higher number of branches per plant which was partially related to the increased growth points in taller plants. The decreasing irrigation level from full irrigation decreased the number of primary and secondary branches of pepper per plant. For each deficit irrigation level, the maximum number of branches per plant was reported from plots treated with the highest level of mulch than lower levels and no mulch.
3.2.5. Number of leaves per plant
The quantity of straw mulch and deficit watering had a substantial (P < 0.01) impact on the number of leaves per plant. Furthermore, the interaction between the amount of straw mulching and deficit watering had a significant (P < 0.01) effect on the number of leaves per plant. The experimental plots treated with 100% ETc and 9 t/ha straw mulch had the greatest number of leaves per plant (875.61) (). Nevertheless, there was no discernible difference between 6 t/ha and 100% ETc, or 9 t/ha and 75% ETc straw mulch. With 50% ETc and no mulch, the plants produced the fewest leaves per plant (403.28) (). This conclusion is consistent with that of Aklilu (Citation2009), who found that reducing irrigation levels from 100% ETc to 75% ETc and then 50% ETc led to a drop in the mean number of hot pepper leaves per plant by 360, 294, and 143, respectively.
Table 6. Interaction effect of deficit irrigation and straw mulch levels on number of leaves per plant of hot pepper.
As the level of straw mulch grows independent of increased watering level the number of leaves per plant increases. During water deficit, stomata close to save water and then limit the exchange of water, carbon dioxide, and oxygen resulting in reduced leaf area and decrease in photosynthesis. This indicates that light interception is lessened, carbon absorption is reduced and consequently, the rate of leaf growth is slowed. It has been demonstrated that the decrease in available water during moisture stress initially influences leaf expansion and later stomata conductance and gas exchange (Sadras & Milroy, Citation1996). The number of leaves per plant decreased with decreasing watering and straw mulch levels. This might be because plants respond to water stress by closing their stomata to cut down water loss by transpiration, gas exchange inside the leaf is decreased, correspondingly, and photosynthesis and growth are slowed down.
3.3. Yield and yield components
3.3.1. Fruit length
The main and interaction effects of mulch levels and deficit watering were found to substantially (p < 0.01) impact fruit length. But there was no statistically significant (p < 0.05) difference between the plots treated with 9 t/ha of 75% ETc, 6 t/ha of 100% ETc, and 6 t/ha of 75% ETc. In the experimental plots treated with 100% ETc and 9 t/ha mulch, the largest fruit length (10.70) was measured; in contrast, the smallest fruit length (5.06) was recorded from the treatment of 50% ETc without mulch (). As deficit watering has increased and straw mulch levels have decreased, there has been a tendency toward a decrease in fruit length. The present findings are consistent with the findings of Alvino et al. (Citation1994), who observed that pepper leaves exhibit enhanced photosynthetic efficiency under situations of ample water, leading to a greater proportion of big fruits.
Table 7. Interaction effect of deficit irrigation and straw mulch levels on fruit length and number of fruits per plant of hot pepper.
The negative reaction of fruit length observed on varied deficit irrigation levels may probably be related to the negative effect of water deficit stress on vegetative development (leaf), which would have resulted in the loss of photosynthesis and inadequate absorption of nutrients. The considerable difference identified among deficit irrigation and straw mulch levels on fruit length in the current study is, therefore, a reflection of the change in the depth of water and straw mulch applied in the various treatments. The lowest fruit length in deficit irrigation levels with the lower straw mulch levels that created the largest deficit levels (50% with no mulch) suggests that a little imbalance in soil-water supply can cause severe decreases in fruit growth. The average quantity of water contained in soil and its energy condition are crucial elements impacting the development of plants. Lack of water limits the development of new shoots and leaves. This means that there is less sugar to be used for fruit development, therefore lower fruit sizes. Furthermore, the current conclusion is also in keeping with the study of Sezen et al. (Citation2019) who observed that irrigation and mulching levels greatly impacted pepper fruit length.
3.3.2. Number of fruits per plant
The main and interaction effects of deficit watering and straw mulch levels were shown to have a substantial (p < 0.01) impact on the quantity of fruits per plant, according to an analysis of variance. Plots treated with 50% ETc and no mulch produced the fewest fruits per plant (30.22), while experimental plots treated with 100% ETc and 6 t/ha straw mulch produced the greatest number of fruits per plant (79.57) (). Conversely, compared to plots treated with 100% ETc with 9 t/ha and 75% ETc with 9 t/ha, the ones treated with 75% ETc with 6 t/ha yielded more fruits per plant. This is a sign that a bigger number of fruits per plant may be produced with the application of water at an optimum level and its protection from needless loss via evaporation by covering the soil surface with mulch.
The outcome suggested that the crop may have produced less fruits as a consequence of the decreased irrigation depth since there was less transpiration, photosynthesis, and assimilate available for crop development. This result is consistent with the study of Sezen et al. (Citation2006), which found that the quantity of pepper fruit produced per plant rose with higher irrigation levels. For each mulch level except for 9 t/ha, the number of fruits per plant increased with an increase in irrigation levels. The number of fruits per plant significantly increased with an increase in irrigation levels from 50% ETc to 100% ETc within each mulch level (). This result indicates the deferential response of the Malka Awaze variety to different deficit irrigation levels and straw mulch levels in the production of fruits per plant.
3.3.3. Marketable yield
The results of the analysis of variance indicated that there was a significant (P < 0.01) interaction impact between the amounts of straw mulch and deficit irrigation on marketable yield. Although it was statistically comparable to the yield from the combined application of 75% ETc and 6 t/ha straw mulch, the maximum marketable yield of hot pepper (12.36 t/ha) was achieved from the combination of 100% ETc and 6 t/ha straw mulch (). Treatment with 50% ETc and no mulch produced the lowest marketable yield (4.66 t/ha). Among the deficit irrigation and straw mulch levels, the combined application of 75% ETc irrigation water and 6 t/ha mulch yielded the second-greatest marketable yield (11.64t/ha), saving 25% (68.92 mm) of the water applied in the 100% ETc with 6 t/ha straw mulch. From the 68.92 mm water conserved, 0.25 ha of land would be watered from which 3.09 t/ha of commercial yield of pepper may be generated, Thus, if water is scarce and acreage is available, deficit irrigation provides an alternate option to boost productivity per unit of water applied.
Table 8. Interaction effect of deficit irrigation and straw mulch levels on marketable and unmarketable yield of hot pepper.
The yield decline was connected with an increase in soil moisture tension which when allowed to persist resulted in loss of turgidity, suspension of growth, and subsequently yield reduction. Moreover, the increment in marketable hot pepper yields due to the application of straw mulch and irrigation water could be attributed to the increment in vegetative growth and increased production of assimilates, which is associated with an increment in the branch of pepper, pod length, and average pepper plants weight.
It’s possible that the maximum commercial output of hot peppers results from quicker photosynthate transfer from source to sink and increased growth parameter development. This outcome also agrees with the results of Gadissa and Chemeda (Citation2009), who found that the marketable yield of pepper rose with increasing irrigation and mulch levels.
3.3.4. Unmarketable yield
The interaction between mulch levels and deficit watering had a very significant (p < 0.01) impact on the unmarketable output of hot peppers, according to statistical analysis. The experimental plots treated with 100% ETc and 9 t/ha produced the highest unmarketable yield (0.45 t/ha), while the plot treated with 50% ETc and no mulch produced the lowest unmarketable yield (0.15 t/ha). Plots treated with 50% ETc and 3 t/ha and 75% ETc with no mulch did not significantly differ from each other (). Because the dry vetiver grass may have encouraged the occurrence of insects, pests, and diseases that may cause pod decay, resulting in a high unmarketable fresh fruit yield in hot peppers, the present study’s findings show that as the level of straw mulch increased, the value of unmarketable yield also increased.
3.3.5. Total yield
The interaction effects of deficit irrigation and straw mulch levels resulted in a significant variation (P < 0.01) in the overall production of hot peppers, according to analysis of variance. As a result, the experimental plots growing with 100% ETc and 6 t/ha straw mulch produced the highest total yield (12.81 t/ha), followed by the plots growing with 75% ETc and 6 t/ha straw mulch (12.05 t/ha) (). The combination of 50% ETc and no mulch resulted in the lowest overall hot pepper output (4.81 t/ha). As the quantities of mulch and deficit watering increased, the overall output dropped. Bosland and Peppers (Citation2000) reported that treatments receiving reduced water depth each season had an overall yield decrease. Floral abortion, flower drop, immature fruit drop, and a decrease in the quantity of fruits per plant might all be responsible for this decline in output. The increase in plant height, branch count, and fruit number per plant were mostly responsible for the production increments brought about by the reduction in the deficit irrigation level, which in turn enhanced the overall yield.
Table 9. Interaction effect of deficit irrigation and straw mulch levels on total yield of hot pepper.
The observed substantial loss in total fruit output owing to irrigating at 50% ETc validated the susceptibility of hot pepper to water stress. Similarly, significant floral abortion and partial root drying were detected in a deficit irrigation revealing the mechanism of fruit production loss due to water deficiency stress. The impacts of water stress at blooming and reproductive phases yielded considerably lower yields as compared to appropriate irrigation and mulch levels. the water stress that occurs at the reproductive stage, especially flowering and pod formation, affected yield more severely than that occurs at other stages. High total pepper yield produced due to straw mulch application and higher irrigation water depth is associated with an increase in the amount of assimilate that could be partitioned to the storage organs (increased pod length and mean fruit weight) which consequently increases total hot pepper yield. As noted from this result the production of hot pepper rose with increasing watering and mulch level.
3.4. Effects of deficit irrigation and straw mulch levels on water use efficiency
The main effect of deficit irrigation and straw mulch levels on the water use efficiency of hot pepper was found to be highly significant (P < 0.01). The treatment that got 50% ETc and no mulch showed the largest yield drop (62.30%), whereas the treatment that received 100% ETc and 6 t/ha showed the lowest yield reduction. When compared to other treatments that were treated with mulch, the treatments that received 50, 75, and 100% ETc without mulch exhibited the greatest yield drop. According to the results, the crop that had the highest rate of mulch treatment had a smaller production drop; as a consequence, mulch plays a significant role in boosting hot pepper output by slowing the rate of evaporation. The present research’s findings are consistent with a study by Sadek et al. (Citation2019), which shown that organic mulches outperformed the control in terms of evaporation reduction and yield increase.
The plot treated with 100% ETc and no mulch (1.95 kg/m3) had the lowest water usage efficiency, whereas the treatments with the largest deficit irrigations and 9 t/ha straw mulch (3.99 kg/m3) had the greatest. The average data on water use efficiency showed that the highest percentage of straw mulching led to significantly greater water usage efficiency at all irrigation levels. Mulch has the ability to both reduce evaporation rate and boost water use efficiency, which accounts for its maximum water use efficiency. This result is consistent with the findings of Ngouajio et al. (Citation2007), who found that pepper plants used water more efficiently when they received more deficit watering and mulch. This implies that any yield loss brought on by deficit irrigation may be offset by expanding the irrigated areas using the water that is conserved. Here, the crop’s average water needs under 100% ETc was around 4594.3 m3, but at 50% ETc, it was approximately 2297.2 m3 (). This finding is inline with the study of Mubarak (Citation2020), who observed that water consumption efficiency was much larger for mulched than un-mulched treatments even at full irrigation (100% ETc). This shows that extending the irrigated areas with the conserved water might compensate for any yield loss due to deficit irrigation.
3.5. Effect of deficit irrigation and straw mulch levels on yield response factor
The Ky varied from 0.24 to 1.83, with the application of 75% ETc with 6 t/ha straw mulch yielding the lowest value and the greatest value obtained from 75% ETc with no mulch. This finding suggests that the experiment’s deficit irrigation level (75% ETc with 6 t/ha straw mulch) is helpful in conserving irrigation water. When the crop’s water needs are not satisfied, the crop will lose more yield, according to the higher Ky values. According to Doorenbos and Kassam (Citation1979), the pepper yield response factor (Ky), would be larger than 1. The yield response factor is used to quantify the yield’s responsiveness to the water supply. Water scarcity often causes a relatively moderate yield decline during the vegetative and ripening stages, but a significant yield reduction during the blooming and yield production stages. Compared to the crop with (Ky <1), the yield response factor (Ky > 1) will experience a larger yield decrease loss. The experiment’s findings suggested that the amount of deficit watering and the amount of straw mulch had an impact on pepper.
Table 10. Water use efficiency, irrigation water saved, and relative yield reduction due to imposition of deficit irrigation and application of straw mulch at different levels on hot pepper.
When Ky > 1, the crop response is highly susceptible to water deficit with correspondingly higher yield reductions; Ky < 1 implies that the crop is more tolerant to water deficit, and recovers partially from the stress, exhibiting less than a proportional reduction in yield with reduced water use; Ky = 1 implies that the yield reduction is directly related to the reduced water use (Doorenbos & Kassam, Citation1979). Therefore, the application of 75% ETc with no mulch resulted in a considerable loss in yield (Ky = 1.83) compared to the other deficit irrigation and straw mulch levels ().
Table 11. Effect of deficit irrigation and straw mulch levels on yield response factor of hot pepper.
4. Conclusion
The purpose of the research was to determine how hot pepper yield components, yield, and water usage efficiency were affected by deficit watering and straw mulch levels. Four levels of vetiver grass straw mulch (0, 3, 6, and 9 t/ha) and three levels of deficit irrigation (100%, 75%, and 50% ETc) were applied in a factorial randomized complete block design with three replications. With the help of the CROPWAT (8.0 Version) software, the quantity of irrigation water applied were calculated for the three levels of irrigations. The results of the analysis of variance showed that the days to 50% flowering, days to maturity, plant height, number of branches per plant, number of leaves per plant, number of fruits per plant, fruit length, marketable yield, unmarketable yield, total yield, and crop water use efficiency were all significantly (p < 0.05) impacted by the interaction effect of deficit irrigation and mulch levels.
The following suggestions for further findings and enhancement of hot pepper production and water usage efficiency in the research region specifically and water challenged areas generally may be made based on the aforementioned results. Because it is the greatest option for improving hot pepper production in the research region, adopting the 75% ETc with a 6 t/ha straw mulch application is advised due to its greater marketable pepper output, economic attractiveness, and improved water use efficiency. However, as the experiment was only carried out in one place with a single cultivar, it would be pertinent to carry out comparable studies in other places and during other seasons with other cultivars in order to get definitive results and the best advice.
Author’s contributions
Addis Hailu was responsible for the conception and design, or analysis and interpretation of the data; the drafting of the paper, and Dr. Kibebew Kibret was responsible for the drafting of the paper, revising it critically for intellectual content, and the final approval of the version to be published.
Acknowledgments
We would like to thank Haramaya University for providing financial support to cover the expenses incurred for this research work. Our appreciation and gratitude also extend to the School of Natural Resources Management and Environmental Sciences, Haramaya University for their valuable technical and material support starting from the research proposal up to the completion of the manuscript. The Ministry of Education is also highly acknowledged for the study sponsorship.
Disclosure statement
The authors state that they have no known conflicting financial interests or personal ties that may have seemed to affect the work presented in this study.
Data availability statement
The data that support the findings of this study are available from the corresponding author, [Addis Hailu], upon reasonable request.
Additional information
Funding
Notes on contributors
Addis Hailu Demo
Addis Hailu Demo is a Lecturer and Researcher in the School of Natural Resources Management and Environmental Science, at Haramaya University, Ethiopia. He is specialized in Irrigation Agronomy (MSc) from Haramaya University. His research interest is Agricultural Water Management, Integrated nutrient management, Soil salinity, irrigation water quality management, and climate-smart agronomic practices.
Kibebew Kibret Tsehai
Dr. Kibebew Kibret Tsehai is an associate professor at the School of Natural Resources Management and Environmental Science, Haramaya University, Ethiopia. His research interests are Soil hydrology, irrigation agronomy, land suitability evaluation, modeling climate change impacts on soil properties and soil health, and vice versa.
References
- Abd El-Mageed, T. A., El-Samnoudi, I. M., Ibrahim, A. E.-A M., & Abd El Tawwab, A. R. (2018). Compost and mulching modulates morphological, physiological responses and water use efficiency in sorghum (bicolor L. Moench) under low moisture regime. Agricultural Water Management, 208, 1–15. https://doi.org/10.1016/j.agwat.2018.06.042
- Ahmadi, M., & Bahrani, M. J. (2009). Yield and yield components of rapeseed as influenced by water stress at different growth stages and nitrogen levels. American-Eurasian Journal of Agricultural and Environmental Sciences, 5(6), 755–761.
- Aklilu, M. (2009). Effects of mulching and depth of irrigation application on water use efficiency and productivity of pepper under gravity drip irrigation [MSc. Thesis]. Department of Irrigation Engineering, Haramaya University.
- Al-Suhaibani, N. A. (2009). Influence of early water deficit on seed yield and quality of faba bean under arid environment of Saudi Arabia. American-Eurasian Journal of Agricultural & Environmental Sciences, 5(5), 649–654.
- Allen, R. G., Pereira, L. S., Raes, D., & Smith, M. (1998). Crop evapotranspiration-Guidelines for computing crop water requirements-FAO Irrigation and drainage paper 56. Fao, Rome, 300(9), D05109.
- Alvino, A., Centritto, M., & Lorenzi, F. D. (1994). Photosynthesis response of sunlit and shade pepper (Capsicum annuum) leaves at different positions in the canopy under two water regimes. Functional Plant Biology, 21(3), 377–391. https://doi.org/10.1071/PP9940377
- Anjum, S. A., Xie, X., Wang, L., Saleem, M. F., Man, C., & Lei, W. (2011). Morphological, physiological and biochemical responses of plants to drought stress. African Journal of Agricultural Research, 6(9), 2026–2032.
- Blake, G. R. (1965). Particle density. Methods of Soil Analysis: Part 1 Physical and Mineralogical Properties. Including Statistics of Measurement and Sampling, 9, 371–373.
- Bosland, P. W., & Peppers, V. E. J. (2000). Vegetable and spice capsicums. Cabi Bookshop, 2, 14–39.
- Bouyoucos, G. J. (1962). Hydrometer method improved for making particle size analyses of soils 1. Agronomy Journal, 54(5), 464–465. https://doi.org/10.2134/agronj1962.00021962005400050028x
- Chapman, H. D. (1965). Cation-exchange capacity. Methods of Soil Analysis: Part 2 Chemical and Microbiological Properties, 9, 891–901.
- Choudhary, V. K., Bhambri, M. C., Pandey, N., & Sharma, H. G. (2012). Effect of drip irrigation and mulches on physiological parameters, soil temperature, picking patterns and yield in capsicum (Capsicum annuum L.)Archives of Agronomy and Soil Science, 58(3), 277–292. https://doi.org/10.1080/03650340.2010.517197
- Doorenbos, J., & Kassam, A. H. (1979). Yield response to water. Irrigation and Drainage Paper, 33, 257.
- El-Beltagi, H. S., Basit, A., Mohamed, H. I., Ali, I., Ullah, S., Kamel, E. A., Shalaby, T. A., Ramadan, K. M., Alkhateeb, A. A., & Ghazzawy, H. S. (2022). Mulching as a sustainable water and soil saving practice in agriculture: A review. Agronomy, 12(8), 1881. https://doi.org/10.3390/agronomy12081881
- FAO. (1985). Water quality for agriculture. Food and Agriculture Organization of the United Nations Rome.
- FAO (2008). Food and agriculture organisation of the United Nations.
- Gadissa, T., & Chemeda, D. (2009). Effects of drip irrigation levels and planting methods on yield and yield components of green pepper (Capsicum annuum, L.) in Bako, Ethiopia. Agricultural Water Management, 96(11), 1673–1678. https://doi.org/10.1016/j.agwat.2009.07.004
- Gebrtsadkan, G., Tsehaye, Y., Libanos, W. G., Asgele, K., Micael, Y. G., Hagos, H., & Abreha, E. (2018). Enhancing productivity of Pepper (Capsicum annuum L.) by using improved varieties. Journal of Agricultural Science and Botany, 02(02), 6–9. https://doi.org/10.35841/2591-7897.2.2.6-9
- Hunt, N., & Gilkes, R. (1992). Farm monitoring handbook.
- Karasu, A., Kuşcu, H., Öz, M., & Bayram, G. (2015). The effect of different irrigation water levels on grain yield, yield components, and some quality parameters of silage maize (Zea mays indentata Sturt.) in Marmara Region of Turkey.
- Mardani, S., Tabatabaei, S. H., Pessarakli, M., & Zareabyaneh, H. (2017). Physiological responses of pepper plant (Capsicum annuum L.) to drought stress. Journal of Plant Nutrition, 40(10), 1453–1464. https://doi.org/10.1080/01904167.2016.1269342
- McMillen, M. (2013). The effect of mulch type and thickness on the soil surface evaporation rate.
- Moore, G., Hall, D., & Russell, J. (1998). Soil water. In G Moore (Ed.), Soilguide. A Handbook for Understanding and Managing Agricultural Soils (pp. 80–93). Perth: Agriculture Western Australia.
- Mubarak, I. (2020). Improving water productivity and yield of onion crop by combining early planting and straw mulch under different irrigation levels in dry Mediterranean region. Advances in Horticultural Science, 34(1), 49–60.
- Ngouajio, M., Wang, G., & Goldy, R. (2007). Withholding of drip irrigation between transplanting and flowering increases the yield of field-grown tomato under plastic mulch. Agricultural Water Management, 87(3), 285–291. https://doi.org/10.1016/j.agwat.2006.07.007
- Olsen, S. R. (1954). Estimation of available phosphorus in soils by extraction with sodium bicarbonate (Issue 939). US Department of Agriculture.
- Ramada, S., & Ramanathan, S. P. (2017). Evaluation of drip fertigation in aerobic rice-onion cropping system. International Journal of Current Microbiology and Applied Sciences, 6(4), 2623–2628.
- Richards, L. A. (1954). Diagnosis and improvement of saline and alkali soils (Vol. 78). LWW.
- Rowell, D. L. (2014). Soil science: Methods\& applications. Routledge.
- Sadek, I. I., Youssef, M. A., Solieman, N. Y., & Alyafei, M. A. M. (2019). Response of soil properties, growth, yield and fruit quality of cantaloupe plants (Cucumis melo L.) to organic mulch. Merit Res. J. Agric. Sci. Soil Sci, 7(9), 106–122.
- Sadras, V. O., & Milroy, S. P. (1996). Soil-water thresholds for the responses of leaf expansion and gas exchange: A review. Field Crops Research, 47(2-3), 253–266. https://doi.org/10.1016/0378-4290(96)00014-7
- Sahrawat, K. L., & Prasad, R. (1975). A rapid method for determination of nitrate, nitrite, and ammoniacal nitrogen in soils. Plant and Soil, 42(1), 305–308. https://doi.org/10.1007/BF02186992
- Sezen, S. M., Yazar, A., & Eker, S. (2006). Effect of drip irrigation regimes on yield and quality of field grown bell pepper. Agricultural Water Management, 81(1-2), 115–131. https://doi.org/10.1016/j.agwat.2005.04.002
- Sezen, S. M., Yazar, A., & Tekin, S. (2019). Physiological response of red pepper to different irrigation regimes under drip irrigation in the Mediterranean region of Turkey. Scientia Horticulturae, 245, 280–288. https://doi.org/10.1016/j.scienta.2018.10.037
- Tadesse, T., Haque, I., & Aduayi, E. A. (1991). Soil, plant, water, fertilizer, animal manure\& compost analysis manual.
- Valipour, M. (2014). Handbook of irrigation engineering problems. OMICS Group International.
- Van Reeuwijk, L. P. (1992). Procedures for soil analysis (3rd ed.). ISRIC.
- Vanuytrecht, E., Raes, D., Steduto, P., Hsiao, T. C., Fereres, E., Heng, L. K., Vila, M. G., & Moreno, P. M. (2014). AquaCrop: FAO’s crop water productivity and yield response model. Environmental Modelling & Software, 62, 351–360. https://doi.org/10.1016/j.envsoft.2014.08.005
- Voor, V. M., Nkansah, G. O., Smith, M. S., Page, Z. C., & Luther, Z. (2018). Effects of different water regimes and poultry manure on growth, development and yield of hot pepper (Capsicum annum L.). American Scientific Research Journal for Engineering, Technology, and Sciences (ASRJETS), 44(1), 32–57.
- Walkley, A., & Black, I. A. (1934). An examination of the Degtjareff method for determining soil organic matter, and a proposed modification of the chromic acid titration method. Soil Science, 37(1), 29–38. https://doi.org/10.1097/00010694-193401000-00003
- Webber, H. A., Madramootoo, C. A., Bourgault, M., Horst, M. G., Stulina, G., & Smith, D. L. (2006). Water use efficiency of common bean and green gram grown using alternate furrow and deficit irrigation. Agricultural Water Management, 86(3), 259–268. https://doi.org/10.1016/j.agwat.2006.05.012
- Webster, R. (2005). Hillel, D. Introduction to Environmental Soil Physics. Elsevier Academic Press.
- Zhang, Q., Wang, S., Li, L., Inoue, M., Xiang, J., Qiu, G., & Jin, W. (2014). Effects of mulching and sub-surface irrigation on vine growth, berry sugar content and water use of grapevines. Agricultural Water Management, 143, 1–8. https://doi.org/10.1016/j.agwat.2014.05.015