
 ?Mathematical formulae have been encoded as MathML and are displayed in this HTML version using MathJax in order to improve their display. Uncheck the box to turn MathJax off. This feature requires Javascript. Click on a formula to zoom.
Abstract
This study estimates value-at-risk (VaR) to measure foreign exchange risk in Indonesia’s banking industry using quantile regression (QR) approach. Four large banks whose capital and assets were the biggest were observed, and their selection was based on their market share in the industry. To compute VaR, data on each bank’s day-to-day gain/loss between 1 January 2016 and 9 February 2021 were examined, and they involved records of all transactions involving six foreign currencies. According to results of a backtesting analysis using dynamic quantile (DQ) test at a 95% confidence level performed in this study, VaR estimation of each bank’s gain/loss on foreign currency transactions generated using QR regression approach demonstrates an excellent predictive performance, with an average of 95% accuracy level. The contribution of this article lies in the development of an internal model that produces better risk measurements, a model that has not yet gained widespread usage in empirical research within the context of Indonesia.
REVIEWING EDITOR:
1. Introduction
Global financial integration arising along with the rapid advancement of information technology has promoted integration of the banking industry into regional and global economies. With that being said, banks’ foreign exchange transactions—either to meet customers’ needs or to fulfill their needs for hedging as well as asset and liability management—rise. Al Janabi (Citation2007) found a rapid increase in derivative (forex) trading along with an increase in international linkages among companies. More varied activities and increasingly complex foreign exchange products in the financial market have increased exposure to risks as a result of changes in exchange rates, making precise measure and sound management of banks’ foreign exchange risks crucial. More specifically, the 2007–2009 global financial crisis has highlighted the importance of developing methods to measure market risks (Bautista & Mora, Citation2021).
Amendments to the Basel II allow banks to use value-at-risk (VaR) in the measurement of market risks, particularly if banks adopt an internal model approach. VaR is an estimate of potential loss for an investment as a result of market risk factors in certain period of time and with certain confidence level. When using internal models, banks possess discretions and flexibility in their use of VaR models. Nevertheless, there is a critical issue in market risks, namely inaccuracy of the risk estimation (Bautista & Mora, Citation2021). This inaccuracy stems from the use of various VaR models that leads to different risk sizes.
A study by Hermsen (Citation2010) demonstrated how different banks implemented different VaR models, particularly in how cautious they were in accommodating some stylized facts in typical return time series. Numerous study results demonstrating unconditional return distribution of exchange rate revealed non-normal distribution of stylized facts and their tendency for volatility clustering. To date, VaR estimates using all types of GARCH models and various error distribution patterns remain one of the most successful methods used to measure market risks based on return distribution patterns (see, for example, Berger & Gençay, Citation2018; Dimitrakopoulos et al., Citation2010; Emenogu et al., Citation2020; Hansen & Lunde, Citation2005; Hermsen, Citation2010; Jiang et al., Citation2020; Smolović et al., Citation2017).
However, Kuester et al. (Citation2005) stated that estimating VaR using parametric GARCH model requires valid distributional assumptions and volatility structure, which are often unknown. Selection of GARCH model is highly influenced by conditional volatility output (Khan et al., Citation2019; Naqvi et al., Citation2019). When selecting a model to use, the use of likelihood-based method such as Akaike Information Criterion (AIC) or Bayesian Information Criterion (BIC) is solely based on the fitting of distributional assumptions to the data that may cause overfitting. On the other hand, Quantile Regression (QR) approach is a method developed to measure VaR without any unconditional return distribution assumptions. Since the development of Conditional Autoregressive Value-at-Risk (CaViaR) by Engle and Manganelli (Citation2004), the quantile approach has been widely used in numerous empirical studies to estimate VaR. Numerous studies exhibited that the performance of quantile regression in predicting VaR was better than that of GARCH models (see, for example, Adrian & Brunnermeier, Citation2016; Chen et al., Citation2012; De Lange et al., Citation2022; Dumitrescu et al., Citation2012; Rubia & Sanchis-marco, Citation2013; Wu, Citation2020; Xiao et al., Citation2015).
According to Xiao et al. (Citation2015), quantile regression (QR) demonstrates special properties including its robustness in non-Gaussian distribution and insensitivity to outliers, making it a suitable VaR estimation method in the measurement of market risks. However, this particular model has not gained widespread usage in empirical research within the context of Indonesia. Therefore, this aspect constitutes a contribution of this paper. To demonstrate how crucial QR method for estimating VaR is, this study aims to test suitability of QR for measuring foreign exchange risks in Indonesia’s banking industry. The objects under investigation are the four banks with the largest capital, assets, credit exposure and third-party funds in Indonesia. In their study, McKinsey predicted that Indonesia’s economy will be the seventh biggest economy in the world in 2030 and is currently the biggest economy in southeast Asia. Economic turmoil in the country potentially affect the economy of other countries within the region. Risk management in Indonesia’s banking industry is both important and interesting to discuss given Indonesia’s bank-based financing system. Banks that are resilient to external shocks make a great support for the country’s economic stability.
The use of each bank’s individual data on gains and losses incurred from its trading activities makes this study even more compelling. Individual data is critical given the rapid advancement as well as greater variety and complexity of commercial banks’ trading account.
In the following section of this paper, or in Section 2, a literature review is presented, while in Section 3, dynamic QR specification and backtesting procedure are detailed. In Section 4, results of the estimate model as well as VaR forecasting and backtesting results are presented, followed by a conclusion in Section 5.
2. Literature review
VaR estimation has been a standard measure of market risks since the passing of Basle II Agreement in 2004. However, one key issue in market risk management is now lying at its measurement. Availability of various VaR models has resulted in different risk sizes. In a survey, Boothe and Glassman (Citation1987) found that, in numerous empirical studies, the foreign exchange returns tended to be heavy tails, asymmetry and volatility clustering in the distribution. In response to the situation, a number of methods have been developed and implemented. One of the most popular VaR estimates is the GARCH model under various distributional assumptions.
Smolović et al. (Citation2017) investigated numerous GARCH models to estimate VaR in Montenegrin emerging market and found that (ARMA (1, 2)–TS GARCH (1), ARMA (1, 2)–T GARCH(1,1) with Student-t distribution and ARMA (1, 2)–EGARCH(1,1) with reparameterized unbounded Johnson distribution [JSU] passed the Christoffersen test at a 95% confidence level. Berger and Gençay (Citation2018) adopted GARCH, GJR-GARCH and FIGARCH by classifying conditional volatility into different components, namely short, mid and long-run to improve accuracy of daily VaR forecast. This empirical study involved data on stock returns in DJIA index. Emenogu et al. (Citation2020) applied nine GARCH models to estimate VaR of Total Nigeria Plc’s daily stock returns and concluded that eGARCH dan sGARCH were the best models for normal innovations while NGARCH was more suitable for student-t innovations.
Another highly popular method used to estimate VaR in numerous financial markets in developed countries is quantile regression. Following the development of CaViaR model by Engle and Manganelli (Citation2004), numerous empirical studies adopted a quantile-based approach to measure VaR. Xiao et al. (Citation2015) applied QR approach to estimate VaR in the International Equity Markets, and results showed that QR was a robust method of estimate. Similarly, Wu (Citation2020) adopted CaViaR to estimate VaR in three different stock market indices in China and found suitability of the model for Shanghai Security Composite index (SSEC), Shanghai Stock Exchange B Share index (SHBSHR) and Shenzhen Security Component index (SZSC). While conducting a study into the emerging market, Bautista and Mora (Citation2021) found empirical evidence showing how robust the CaViaR model was in estimating VaR in Market Integrated Latin America (MILA) and ASEAN-5 stock markets. De Lange et al. (Citation2022), on the other hand, used QR to develop VaR forecasting model by incorporating implied volatility as an explanatory variable into the model and made the model forward-looking, ensuring the ability of VaR estimates to reflect all relevant information concerning risk factors. In this study, QR approach was found to be a better model for EUR/USD compared to other traditional models.
After comparing QR method with other traditional distributional-assumption-based methods such as GARCH, Xiao et al. (Citation2015) stated that QR was robust for non-Gaussian distributions. Unlike GARCH that requires presence of assumptions about return distribution pattern, QR mainly focuses on local behavior of conditional return distribution in certain quantiles. As a result, QR estimation is insensitive to outliers often found in financial return data series. This study aims to apply QR method to estimate VaR in Indonesia’s banking industry. The QR method, along with the comparison between QR’s predictive performance and that of GARCH specifications, has been widely studied. However, studies that specifically address the emerging markets, particularly Indonesia’s banking industry, remain non-existent. Although Bautista and Mora (Citation2021) implemented the CaViaR model in ASEAN-5 and Market Integrated Latin America (MILA), both of which are emerging markets, their study focused on foreign exchange risk in the stock market and not in the banking industry.
3. Methodology
Estimation of VaR using GARCH approach is able to capture the special characteristics of financial data namely heavy tails, asymmetry and volatility clustering. However, Kuester et al. (Citation2005) claimed that obtaining optimal estimation results using volatility dynamics specification is impossible and proposed the use of QR approach in VaR estimation instead. This study estimates VaR for foreign exchange risk in Indonesia’s banking industry by adopting the QR approach.
Four banks with the largest capital and assets were selected based on their total market share in the industry to represent the entire industry. Banks with the greatest capital and assets are also highly complex and, therefore, exposed to higher foreign exchange risks. The four sample banks in this study are classified under the BUKU 4 business group. BUKU 4 refers to Commercial Banks for Business Activities with a core capital equal to or greater than 30 trillion Indonesian rupiah (IDR). These banks dominate the market share in terms of assets and credit, accounting for 67.5% of the total banking assets and credit in Indonesia in 2020.The banking structure in Indonesia is highly oligopolistic, dominated by the market share of four major banks (which are the subjects of our research). Therefore, the four banks we study can accurately represent the condition of the banking industry in Indonesia. In other words, these four major banks serve as a representative sample for the industry.
Quantile Regression model (Davino et al., Citation2014; Koenker, Citation2005):
(1)
(1)
with quantile
. Coefficient Quantile Regression
of q-quantile is to determine the value
in such a way that minimizes the objective function:
(2)
(2)
with
. Different quantile q will result in different quantile regression coefficient
. In VaR analysis, q values are normally 0.01 or 0.05.
According to Adrian and Brunnermeier (Citation2016), VaR can be estimated using quantile regression equation, with being a dependent variable and
being independent variables, and where
are macroeconomy variables:
(3)
(3)
VaR is generated using the above quantile regression equation:
(4)
(4)
Conditional q-quantiles of the gains/losses resulting from bank transactions were estimated using predictor variables of macroeconomy, including inflation rate, IDX Composite, yield from three-month Surat Berharga Negara (SBN) and foreign exchange volatility. To estimate VaR using QR approach, data on gains/losses from all bank transactions related to the six foreign currencies were collected from each bank’s internal sources. Therefore, the data used in this study consists of bank-level data, specifically the gain-loss data from daily foreign exchange trading activities of each bank.
This paper uses the CoVaR model, which employs quantile regression, for the purpose of calculating the conditional quantile value per observation. It focuses on the method of calculation rather than the type of its input data. Quantile regression models do not require the input to be return data (Koenker, Citation2005). This is similar to the VaR model, which also does not require its input data to be returns; instead, the VaR model commonly uses gains/losses expressed in currency values, such as USD/IDR. The use of gain/loss data is an advantage of our research. With this data, the VaR estimation we obtain depicts the maximum potential loss that a bank can experience in nominal terms. This nominal amount information is crucial for banks in establishing the minimum reserves needed to cover market risks arising from exchange rate movements. Such critical information would be unattainable if we relied solely on exchange rate return data.
Numerous VaR estimation methods have been developed; therefore, evaluation of VaR’s predictive ability is crucial. In this study, backtesting procedure was used to evaluate accuracy of VaR prediction results, and dynamic quantile (DQ) test by Engle and Manganelli (Citation2004) was performed.
4. Results
4.1. Data and descriptive statistics
VaR estimation to measure foreign exchange risk in this study was performed using data on daily gain/loss from transactions of six foreign currencies carried out by each of the four banks namely Bank_A, Bank_B, Bank_C and Bank_D between 1 January 2016 and 9 February 2021. Data were collected from internal data sources of each bank.
The descriptive statistics for daily gain/loss data within the period is presented in . Panel A, Panel B, Panel C and Panel D are for Bank_A, Bank_B, Bank_C and Bank_D respectively.
Table 1. Descriptive statistics for daily gain/loss (in IDR).
The skewness values presented in demonstrate asymmetrical distribution in gain/loss dataset in the study, with kurtosis values showing presence of excess kurtosis (leptokurtic), an indicator of heavy tail in the data distribution. The magnitude of skewness and kurtosis indicates that the use of the QR model for the data in this study is appropriate because QR is a robust approach for non-Gaussian distributions, as stated by Xiao et al. (Citation2015).
Conditional q-quantiles of the gains/losses resulting from bank transactions were estimated using predictor variables of macroeconomy, including inflation rate, IDX Composite, yield from three-month Surat Berharga Negara (SBN) and foreign exchange volatility. The descriptive statistics are shown on .
Table 2. Descriptive statistics for predictor variables of macroeconomy.
4.2. Results of VaR estimation using quantile regression
To estimate the one-day-ahead Value at Risk (VaR), the research data is divided into two parts. The in-sample data covers the period from 1 January 2016 to 27 January 2019, and the out-of-sample data starts from 28 January 2019. The in-sample data is used to estimate the Quantile Regression (QR) model, while the out-of-sample data is used to forecast VaR from the QR modeling, resulting in 595 VaR forecasts. Results of VaR estimate involving 4 banks and 6 foreign currencies (USD, EUR, AUD, SGD, JPY and GBP) are presented in . It is apparent that, within the period, VaR of almost all banks increased in early 2020 when the first Covid-19 cases was reported. VaR was the highest in the second quarter of 2020, during the first wave of the Covid-19 pandemic in Indonesia.
Figure 1. VaR estimation results for Bank A.
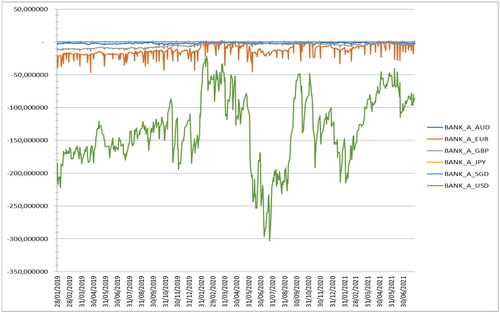
Figure 2. VaR estimation results for Bank B.
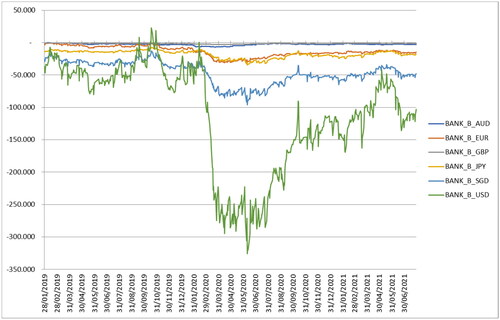
Figure 3. VaR estimation results for Bank C.
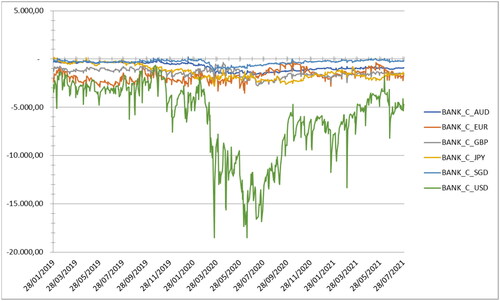
Figure 4. VaR estimation results for Bank D.
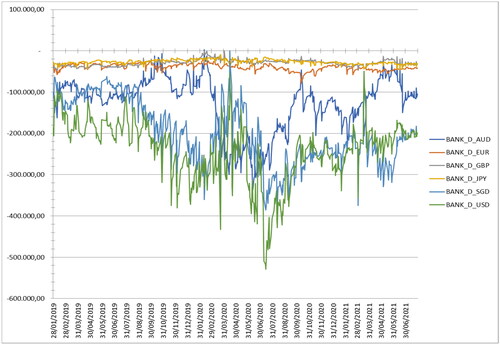
The descriptive statistics of VaR estimates are presented in . It is can be seen that the greatest possible losses incurred from daily USD transactions carried out by the banks studied, ranging from −18,491.5997 million to −528,517.2131 million. As can be seen in , the greatest loss was between early and mid-gggg2020, beginning from Covid-19 cases in Indonesia were first confirmed to the first wave of the Covid-19 pandemic in the country.
Table 3. Descriptive statistics of VaR estimation results.
4.3. Evaluation of VaR-QR
To assess performance of VaR using QR approach, backtesting using Dynamic Quantile (DQ) test from Engle and Manganelli (Citation2004) was performed. The DQ test operates by examining whether the violations (or ‘hits’) of the VaR threshold are independent and identically distributed over time. A violation or hit occurs when the actual loss exceeds the VaR estimate. The DQ test is considered an enhancement over traditional backtesting methods because it not only checks the frequency of VaR violations but also their independence over time, as detailed in Section 5 of their article. Backtesting is performed to validate accuracy of VaR generated as well as its consistency with data. Results of backtesting with a 95% level of confidence are presented in .
Table 4. Dynamic quantile backtesting results.
H0: The actual number of exceedances of VaR matches the expected number based on the specified confidence level (valid QR model)
The last line of each Panel shows accuracy of VaR estimation results measured using percentage of gain/loss of 6 forex transaction activities successfully passing the backtest, significant at the 5%. As to Panel A, backtesting results with a 95% confidence level show that VaR generated using QR estimation displays an excellent performance with 80% accuracy. Meanwhile, in Panel B, Panel C and Panel D, VaR’s performance is even better with 100% accuracy.
We also present the results of VaR backtesting with the Kupiec model benchmark, using alpha 5%. Generally, the results of the DQ test backtest with the Kupiec test are comparable, as shown in the .
Table 5. Backtesting results with benchmark model.
Of all backtest results, VaR estimation using QR approach demonstrates an excellent performance (95% accurate) in all backtests. VaR’s excellent performance in this study can be attributed to two main factors. Firstly, incorporating economic and financial predictors as explanatory variables in the QR model of the study makes the model forward-looking, similar to results of the study conducted by De Lange et al. (Citation2022), ensuring VaR’s ability to provide all relevant information on risk factors. Secondly, QR mainly focuses on local behavior, not on the distribution of conditional return within specific quantile. When studying emerging stock markets namely ASEAN-5 and Market Integrated Latin America (MILA), Bautista and Mora (Citation2021) found that quantile regression approach is a model that generates the highest accuracy rate when predicting VaR in Southeast Asia and MILA emerging stock markets within their study period.
5. Discussion and conclusions
VaR estimation has become the standard for measuring market risks in banking industry since the establishment of Basel II Agreement. Basel II gives banks discretion and flexibility to determine the best VaR model in the calculation of minimum capital requirements for market risk. Selecting a suitable VaR model is critical given how different models generate different VaR estimates and therefore different minimum capital requirements for market risk. This study examines whether or not QR is the right method to generate an accurate VaR estimate to measure foreign exchange risk in Indonesia’s banking industry. Hermsen (Citation2010) stated that the use of bad simple VaR model which disregards the characteristics of return data apparently results in lower capital requirements compared to a calculation using better VaR model based on realistic assumptions about return data. In this regard, the use of the appropriate model for estimating VaR becomes crucial as it determines the accurate calculation of the minimum capital requirement to cover the risks arising from exchange rate volatility. Inaccurate calculation of the minimum capital requirement poses a potential threat to the financial system stability. Banks with insufficient minimum reserves will be unable to mitigate their risks, which can have systemic effects on other banks through the domino effect it creates.
In this study, the QR method was adopted to estimate VaR because, according to Xiao et al. (Citation2015), the QR method is robust in non-Gaussian distributions and mainly focuses on local behavior of the conditional return distributions in specific quantile, making it insensitive to outliers that are common in time series financial data. To validate the accuracy and consistency of VaR estimated in this study with data, a backtesting using Dynamic Quantile (DQ) test procedure was performed. Based on the results of the test, VaR estimation using QR test on banks’ individual data on gain/loss performed in this study demonstrates an excellent predictive performance with an average accuracy level of 95%. High VaR accuracy is the key to accurate calculation of minimum capital requirement for market risk in banking industry. Lower minimum capital than the actual minimum requirement will threaten the banking industry, putting it at systemic risk.
The use of internal models in measuring market risk, as conducted in this study, results in better risk measurements compared to standard models. Unfortunately, in practice, the banking industry in Indonesia has not widely adopted internal models due to the complexity of the measurement methods.
A suggestion for further research is to continue using data at the individual bank level, as done in this study, but it could be expanded by including foreign exchange banks that represent the BUKU 3 group (commercial banks for business activities with a core capital of 5 – 30 trillion Indonesian Rupiah).
Disclosure statement
No potential conflict of interest was reported by the author(s).
Data availability statement
The data used in this study (gain/loss data) is internal bank data that cannot be shared with the public.
Additional information
Funding
Notes on contributors
Siti Saadah
Siti Saadah is an associate professor of finance, banking, and investment at Atma Jaya Catholic University of Indonesia. He holds a Doctoral Degree in Finance from Department of Management University of Indonesia. Her research interests areas are finance, banking, and investment. She has published her papers in in Gadjah Mada International Journal of Business, International Journal of Financial Research.
Yohanes B. Suhartoko
Stanislaus S. Uyanto is a professor of statistics at Atma Jaya Catholic University of Indonesia. He holds a Ph.D. in statistics from the School of Mathematics and Statistics at the University of Melbourne, Australia. His research interests areas are simulations, computational statistics, heavy-tailed distributions. He has published his papers in Communications in Statistics - Theory and Methods, Communications in Statistics - Simulation and Computation, Pakistan Journal of Statistics and Operation Research, Austrian Journal of Statistics.
Stanislaus S. Uyanto
Yohanes B. Suhartoko is an assistant professor of macroeconomics at Atma Jaya Catholic University of Indonesia. He holds a Doctoral Degree in Fiscal Policy from Department of Economics Gadjah Mada University, Indonesia. His research interests areas are public policy, and financial system stability.
Inka B. Yusgiantoro
Inka B. Yusgiantoro is Head of the Supervisory Board of The Purnomo Yusgiantoro Center (P YC). He received his doctoral (Ph.D.) from Cornell University and Master of Science in Financial Engineering (M.S.E.) from The University of Michigan at Ann Arbor. He has worked in the Indonesia Financial Services Authority (OJK) since 2013 and is currently Head of the Research Department.
References
- Adrian, T., & Brunnermeier, M. K. (2016). CoVaR. American Economic Review, 106(7), 1–11. https://doi.org/10.1257/aer.20120555
- Al Janabi, M. A. (2007). On the use of value-at-risk for managing foreign-exchange exposure in large portfolios. The Journal of Risk Finance, 8(3), 260–287. https://doi.org/10.1108/15265940710750503
- Bautista, R. S., & Mora, N. (2021). Value-at-risk predictive performance: a comparison between the CaViaR and GARCH models for the MILA and ASEAN-5 stock market. Journal of Economics, Finance and Administrative Science, 26(52), 197–221. https://doi.org/10.1108/JEFAS-03-2021-0009
- Berger, T., & Gençay, R. (2018). Improving daily value-at-risk forecasts: The relevance of short-run volatility for regulatory quality assessment. Journal of Economic Dynamics and Control, 92, 30–46. https://doi.org/10.1016/j.jedc.2018.03.016
- Boothe, P., & Glassman, D. (1987). The statistical distribution of exchange rates: Empirical evidence and economic implications. Journal of International Economics, 22(3-4), 297–319. https://doi.org/10.1016/S0022-1996(87)80025-9
- Chen, C. W. S., Gerlach, R., Hwang, B. B. K., & McAleer, M. (2012). Forecasting value-at-risk using nonlinear regression quantiles and the intra-day range. International Journal of Forecasting, 28(3), 557–574. https://doi.org/10.1016/j.ijforecast.2011.12.004
- Davino, C., Furno, M., & Dan Vistocco, D. (2014). Quantile regression: Theory and applications. John Wiley.
- De Lange, P. E., Risstad, M., & Westgaard, S. (2022). Estimating value-at-risk using quantile regression and implied volatilities. Journal of Risk Model Validation, 16(1), 53–76.
- Dimitrakopoulos, D. N., Kavussanos, M. G., & Spyrou, S. I. (2010). Value at risk models for volatile emerging markets equity portfolios. The Quarterly Review of Economics and Finance, 50(4), 515–526. https://doi.org/10.1016/j.qref.2010.06.006
- Dumitrescu, E.-I., Hurlin, C., & Pham, V. (2012). Backtesting value-at-risk: from dynamic quantile to dynamic binary tests. Finance, 33(1), 79–112. https://doi.org/10.3917/fina.331.0079
- Emenogu, N. G., Adenomon, M. O., & Nweze, N. O. (2020). On the volatility of daily stock returns of Total Nigeria Plc: Evidence from GARCH models, value-at-risk and backtesting. Financial Innovation, 6(1), 1–25. https://doi.org/10.1186/s40854-020-00178-1
- Engle, R. F., & Manganelli, S. (2004). CAViaR: Conditional autoregressive value at risk by regression quantiles. Journal of Business & Economic Statistics, 22(4), 367–381. https://doi.org/10.1198/073500104000000370
- Hansen, P. R., & Lunde, A. (2005). A forecast comparison of volatility models: Does anything beat a GARCH(1,1)? Journal of Applied Econometrics, 20(7), 873–889. https://doi.org/10.1002/jae.800
- Hermsen, O. (2010). The impact of the choice of VaR models on the level of regulatory capital according to Basel II. Quantitative Finance, 10(10), 1215–1224. https://doi.org/10.1080/14697680903419701
- Jiang, C., Ding, X., Xu, Q., & Tong, Y. (2020). A TVM-copula-MIDAS-GARCH model with applications to VaR-based portfolio selection. The North American Journal of Economics and Finance, 51, 101074. https://doi.org/10.1016/j.najef.2019.101074
- Khan, M. S., Khan, K. I., Mahmood, S., & Sheeraz, M. (2019). Symmetric and asymmetric volatility clustering Via GARCH family models: An evidence from religion dominant countries. Paradigms, 13(1), 20–25.
- Koenker, R. (2005). Quantile regression. Cambridge University Press.
- Kuester, K., Mittnik, S., & Paolella, M. S. (2005). Value-at-risk prediction: a comparison of alternative strategies. Journal of Financial Econometrics, 4(1), 53–89. https://doi.org/10.1093/jjfinec/nbj002
- Naqvi, S. M. W. A., Khan, K. I., Ghafoor, M. M., & Rizvi, S. K. A. (2019). Evidence of volatility clustering and asymmetric behavior of returns in Asian emerging stock markets. Pakistan Economic and Social Review, 57(2), 163–197.
- Rubia, A., & Sanchis-Marco, L. (2013). On downside risk predictability through liquidity and trading activity: a dynamic quantile approach. International Journal of Forecasting, 29(1), 202–219. https://doi.org/10.1016/j.ijforecast.2012.09.001
- Smolović, J. C., Lipovina-Božović, M., & Vujošević, S. (2017). GARCH models in value at risk estimation: Empirical evidence from the Montenegrin stock exchange. Economic Research-Ekonomska Istraživanja, 30(1), 477–498. https://doi.org/10.1080/1331677X.2017.1305773
- Wu, D. (2020). CAViaR and the empirical study on China’s stock market. Journal of Physics: Conference Series, 1634(1), 012096. https://doi.org/10.1088/1742-6596/1634/1/012096
- Xiao, Z., Guo, H., & Lam, M. S. (2015). Quantile regression and value at risk. In C. F. Lee & J. Lee (Eds.), Handbook of financial econometrics and statistics (pp. 1143-1167). Springer. https://doi.org/10.1007/978-1-4614-7750-1_41