
 ?Mathematical formulae have been encoded as MathML and are displayed in this HTML version using MathJax in order to improve their display. Uncheck the box to turn MathJax off. This feature requires Javascript. Click on a formula to zoom.
Abstract
Literature on marketing has been extensive, with attention given mostly to measuring performance. This article extends the body of knowledge by focusing on the evolution of marketing measurement and the emerging trends. The novelty lies in the involvement of developing-country SMEs, with the goal of developing a model for measuring SMEs’ marketing performance. A simple random sampling was used to survey 101 SMEs in Malang, Indonesia. The data was analyzed using SEM PLS. The findings show six dimensions to measure marketing performance in SMEs: product market level, marketing effectiveness, customers, financial performance, marketing efficiency, and adaptability. This study contributes to the existing literature on marketing performance and fills a gap by exploring the financial, market-related, and internal aspects from an SME’s perspective. The practical implication is that SMEs need to encourage business activities and adapt the measurement based on these marketing performance dimensions. In addition, the findings can help SMEs with self-learning processes. They can measure marketing performance, identify the weaknesses and strengths of their business, and understand their business positioning. For researchers and policymakers, this study provides insight into the current state of SMEs and their level of maturity.
IMPACT STATEMENT
Resanti Lestari
Research Description
SME growth has numerous challenges despite being a sector that significantly boosts Indonesia’s GDP. SMEs struggle with a number of issues, including their inability to carry out comprehensive, logical analyses based on data.This research can assist to giving understanding about how SMEs measure their Marketing Performance. Marketing performance measurement is a form of corporate control in management and the form is an instrument used to assess the overall performance of marketing. This research examines the search for a form of marketing measurement that is suitable for the SME sector. Purpose of this study, is to construct a marketing performance measurement model with dimensions and measurements that are only needed by the SME sector. This research provides implications in the form of a marketing measurement guidance model needed for SMEs.
Subjects:
Introduction
The Ministry of Indonesia classifies micro, small, and medium enterprises (MSMEs) based on two criteria: headcount and turnover value. Based on the headcount, SMEs are classified into three: (1) micro businesses employ fewer than five people, (2) small businesses employ fewer than twenty people, and (3) medium businesses employ fewer than 100 people (Dewi & Mahendrawathi, Citation2019). The SME sector is the key to economic growth and acceleration in East Java, Indonesia. Data shows that SMEs absorb about 98% of the workforce and contribute 54.98% of GDP or IDR 1,1689.88 trillion, making East Java a province with the highest population of SMEs in the country (Tobing et al., Citation2018). SMEs stimulate the economy by creating jobs, fostering social cohesion, providing a financial source for the community, and buffering a country’s economic stability. As such, research on SMEs is crucial as it can help advance the measures to alleviate poverty, particularly in emerging countries (Bruce et al., Citation2023).
Defining small and medium enterprises (SMEs) is important as it aids the statistical analyses and monitoring of the sector’s health, comparing countries as well as regions within an economy. It also establishes arbitrary standards for imposing taxes or other regulations. The term SMEs indicates their sizes, and their categorization is based on quantifiable indicators, with the most common categorization being the headcount (Smith & Brown, Citation2021). Past research in Indonesia has shown that the informal sector employs between 61% and 70% of the entire labor force (Rothenberg et al., Citation2016), which is often linked to SMEs. Nonetheless, there are constraints in supporting these businesses as many of them have not registered their operations due to expenses, knowledge, and tax evasion. The government has attempted to address this issue using a digitalized licensing service program called the One Single Submission (OSS). This service includes the provision of business licenses and Business Identification Numbers (NIB) and troubleshooting SME problems, which can be accessed across regions in Indonesia. This service is designed entirely online to ease the monitoring.
Addressing the challenges and limitations SMEs face necessitates the involvement and engagement of multiple stakeholders. Given SMEs’ fundamental role in the national economy, the first step toward progress is to acknowledge their contribution to economic growth. The next step is to identify the challenges and limitations. Similar to other emerging economies, SMEs in Indonesia have limitations in promotional and marketing activities, (Jaidan, Citation2010). One solution to enhance their competitiveness in the global market in the digital age is capitalizing on the advancements in Information and Communication Technology (ICT). Effective implementation of ICT and digitalization can help SMEs enhance their capabilities and progress and enable them to participate in global competition.
Other barriers to the development of SMEs are the limited ability to measure success in marketing operations and the low willingness to seek feedback on marketing activities. A study by Page and Io (Citation2017) involving 1009 SME actors has provided empirical evidence of these barriers. This research investigates the challenges faced by SMEs in developing countries, resulting in three conclusions: (1) many small business owners are not prepared for a digital environment, (2) CEOs of small businesses double up as chief marketing officers, (3) most small business owners lack marketing efforts and measurement of marketing activities (Page & Io, Citation2017). The survey also shows that nearly half of small business owners do not use any marketing tools. Less than half of SMEs utilize apps to help with social media management, website administration, customer relationship management, and other tasks to build their digital presence. Another study by Page and Io (Citation2017) found that SMEs do not actively assess how the company performs in marketing.
Many of them focus solely on how to sell their products and services. The main focus is on how many goods are sold, without considering the effectiveness of the efforts to bring in customers and approach the target market, the efficiency of the business operations, the company’s internal procedures, and the consumers’ preferences (whether they are already in sync with the company’s growth, brand, and how these have impacted the rivals). shows the results of the survey capturing SMEs’ perspectives on their marketing performance in business statistics.
Figure 1. SME perspectives on marketing performance in business statistics.
Source: Pre-Survey, 2022.
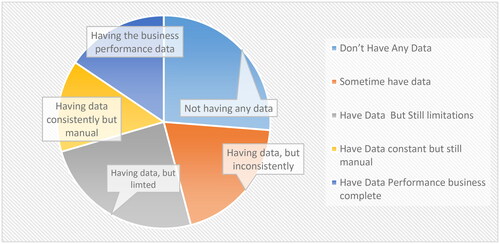
Unlike SMEs, which often lack data and rely on traditional methods for computation, more established companies usually have all the data concerning marketing performance. This disparity makes SMEs fall behind in the competitive market. In other words, making marketing performance measurement accessible to SMEs is critical, as well as how marketing performance measurement is carried out. Therefore, this study aims to fill in the gap by examining the case of SMEs in Malang City, East Java, Indonesia.
In Indonesia, an SME is defined as a productive entity owned by an individual or a business unit that excludes a subsidiary firm or branch office directly or indirectly owned and/or controlled by or is a component of a bigger firm. The SME categorization uses the following criteria ().
Table 1. The MSME criteria in Indonesia.
In East Java, Malang City is the second largest city after Surabaya. In Indonesia, it is the 12th largest city, with a population of 866,118 in 2021 and many higher education institutions, as well as natural and artificial tourism attractions. This potential encourages the growth of SMEs. Data on the number of enterprises and merchants in Malang Municipality from 2018 to 2020 by Statistics Indonesia (BPS) is shown in (Malang Kota.bps.go.id)
Table 2. Number of businesses and traders in Malang municipality in 2018–2020.
illustrates the number of business enterprises and traders in Malang City prior to the pandemic in 2018–2020. This number declined during the pandemic, similar to what happened in all Indonesian regions and around the world. Nonetheless, ministries and government agencies have fostered collaboration to support the development of Indonesian SMEs. Multiple programs have been implemented, such as initiatives that involve various stakeholders in different sectors. For example, the government offers the People’s Business Credit (KUR) program through government-owned financial institutions. The interest subsidies and guarantees have greatly aided SMEs in terms of capital, but many believe that this program could be more effective and accelerated through cooperatives and other microfinance institutions.
Aside from funding, other constraints SMEs face include marketing and company operations, which the government has not specifically addressed. In this study, we present a model for assessing an SME’s marketing performance. We developed this model on the premise that SMEs, as business actors, must be able to analyze and evaluate their work and business results to ensure sustainability. The critical business growth measurement may include (1) indicators of growth, efficiency, and effectiveness, (2) evaluation of whether the business meets the market demands, (3) identification of potential business gap, and (4) awareness and ability of business to pivot to remain resilient (Saad et al., Citation2021). Measuring marketing performance correctly is crucial for SMEs to move forward.
This study aims to examine the evolution of marketing performance measurement as well as the most recent themes, develop a model for the SME sector, and determine the most appropriate dimensions for measuring marketing performance for the SME sector. The model was tested in real cases involving SMEs in Malang City, Indonesia. The model is expected to fill the gap between the contradiction perspective notion and measuring marketing activities, financial results, and market size. The proposed model is built upon previous studies by Ortiz-Rendon et al. (Citation2022), Morgan (Citation2012), Klinčeková and Šalgovičová (Citation2014), Morgan et al. (Citation2002), Lau et al. (Citation1999), Lamberti and Noci (Citation2010), and Wu et al. (Citation2015).
Literature review
Marketing performance measurement is a business process that evaluates marketing efforts to provide feedback for business operations (Liang et al., Citation2018), aligned with the definition by Clark et al. (Citation2006) and B. Clark (Citation2007). Marketing performance has been studied since 1959, with a total of 907 articles in the Scopus database from 1959 to 2022. Based on the bibliometric study of the Scopus database, run on R software on 19 October 2022, at 14:31, marketing performance research was absent or neglected before finally resurfacing in 1975, when studies on this topic proliferated. The author reprocessed the bibliometrics data into the graphic visualization in .
Figure 2. Annual scientific production.
Source: Bibliometric Analysis with Scopus Data (1959–2022), R Program.
Retrieved 19 October 2022, at 14:31.
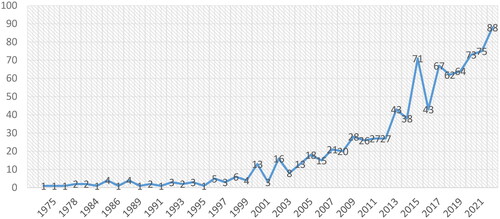
Based on the statistics presented above, the urgency and trend for further studies of marketing performance remains strong, with several prospects for advancement. According to Liang et al. (Citation2018), due to the increased demand for greater marketing accountability, companies have invested significant resources in developing and improving their marketing performance assessment, taking into account changes in business patterns that have shifted due to digitalization and changes in business patterns during the COVID-19 pandemic. However, model development for marketing performance analysis is still in its early stages, particularly for SMEs in developing nations where marketing support is limited.
The review of the literature in this study includes a bibliometric study and systematic investigation (Donthu et al., Citation2021) to assess the existing reading material. Aside from the Scopus scientific data from 1959 to 2022, we also used metadata processing using the R Program. The bibliometric analysis shows that there are 489 sources, 1847 writers with 2133 writers’ keywords (DE), 493 Sources, 37922 References, and a 2.55% annual growth rate between 1959 and 2022. This can be interpreted as a constant increase in marketing performance analysis. With the expansion of studies in this area, developing novelty is highly feasible to add to the body of knowledge.
The metadata on marketing performance above can help understand the history and evolution of marketing performance thinking. One of the studies by Bruce H. Clark (Citation1999) analyzes the history of marketing performance, offering an understanding of changes in the concentration of marketing performance measurement. We investigated and tracked definitions in order to understand how marketing performance was conceptualized and operationalized in each study. The findings show that we need to bridge the varying opinions and provide a unified, holistic concept. This also indicates a gap in the literature, leading to fragmented interpretations of the concept. Bruce H. Clark (Citation1999) divided marketing performance assessment into three approaches: (1) financial to non-financial output measures, (2) output to input measures, and (3) one-dimensional to multidimensional measures. The modifications of the approach measuring marketing performance are presented in .
Table 3. The expanding domain of marketing performance measurement.
Based on the history of marketing performance, it is clear that measurement varies over time as business patterns change. With evidence on the historical trends in marketing performance measures, the most suitable marketing performance measurement can be developed based on the business’s internal conditions, markets, competitors, consumers, changing environments, or in the context of business digitalization. According to Bruce H. Clark (Citation1999) and Wu et al. (Citation2015), marketing performance is formed from two aspects: financial and non-financial. Following this, Inam Bhutta et al. (Citation2021) did a study on the elements that influence corporate success in emerging countries. Accounting metrics (financial elements) and market aspects were employed to gauge the performance. The results show that the skill of company managers was a key factor in enhancing corporate success. However, the performance studied here was that of publicly traded enterprises. Therefore, metrics of business performance, such as profits and stock prices, were also considered. Meanwhile, the non-financial aspect is extremely broad. It encompasses the internal and external environment, company growth, innovation, internal procedures, the consumer side, and the shareholder as the company’s owner.
Good and measurable company growth directly impacts stakeholders, so the importance of precise and accurate measurements of the company’s state becomes a control tool that must be accessible. Past studies have identified the dimensions to measure performance marketing and business performance, as presented in .
Table 4. Dimensions of marketing performance.
Multiple studies contribute directly to the literature and the industry by enriching the measurement of marketing performance. In relation to this, a thematic map of marketing performance from 1847 writers is drawn based on the bibliometric analysis, as shown in
Figure 3. Thematic map.
Source: Bibliometric analysis with scopus data (1959–2022).
Retrieved 19 October 2022, at 14.31.
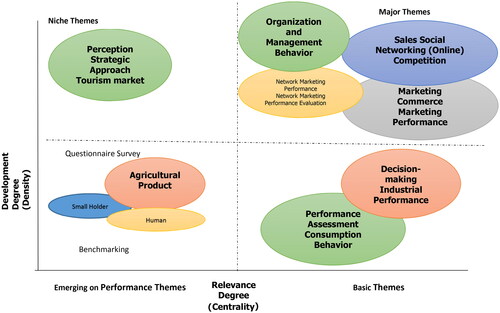
According to the thematic map of marketing performance, one theme in the lower right quadrant is performance assessment. This theme emerged and became of concern to business research to search for appropriate dimensions and measures for performance assessment in SMEs. The creation of the marketing performance model, as proposed in this study, serves as the foundation for an assessment at the marketing functional level. The model we built examines a previously tested model, specifically the model produced by Yamani et al. (Citation2019), which aims to capitalize on information technology in the SME sector to boost SMEs’ performance and profits. Another related measurement of marketing performance in SMEs is by Hasibuan (Citation2015), which uses SWOT analysis to determine the strengths, weaknesses, opportunities, and threats of business actors. In this case, the measurement uses IPA with several indicators, including materials, production process, production environment, equipment, production control, facilities, activities, quality standards, business growth, distribution, market, capital, business management, product strategy, and promotion (Hasibuan, Citation2015).
Another model was developed by Bolisani and Scarso (Citation2012), proposing eight dimensions: (1) the management’s understanding of a competitive environment, (2) commercial strategy, (3) the image that top management wishes to project, (4) the first encounter with clients, (5) the understanding the demands of stakeholders, (6) the complexity of services centered on client solutions, (7) the after-sales service, and (8) feedback formulation.
Based on the roadmap of marketing performance in the bibliometric analysis above, past studies have collated and modeled the assessment of marketing performance. The current study identified 1847 Scopus articles from various disciplines, backgrounds, themes, and places. The current analysis discovered no research has developed a reliable marketing performance measurement, especially for SMEs. Therefore, this study aims to develop a marketing performance measurement exclusively for SMEs that consider their characteristics. We propose a model to become a practical assessment tool that SMEs can use to quantify their marketing performance. This model is built upon the extensive existing studies mentioned above, with showing the most cited authors globally.
Figure 4. Most globally cited articles.
Source: Bibliometric Analysis with Scopus Data (1959–2022), R Program.
Retrieved: 19 October 2022, at 14.31.
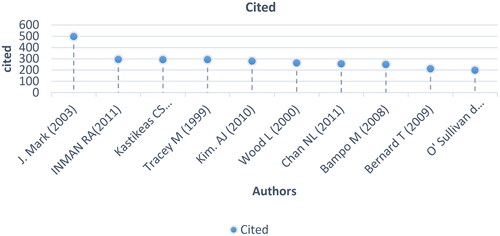
These past studies assist us in mapping the concept of marketing measurement. Some instances that can be used as a guide for modeling include selecting articles that are tested and most cited. As shown in the data, writers rank in the top ten in terms of worldwide citations. Meanwhile, the three most important journals reviewing this topic are Developments in Marketing Science, the Journal of Business Research, which has 15 papers, and the European Journal of Marketing, which has 13 publications.
The most relevant writer in the study of marketing performance is Julian CC. These results are obtained based on metadata in relevance and frequency. The second writer is Ambler T., followed by Aryanto VDW. Meanwhile, Morgan, widely cited and used as a reference in the metadata, ranked eighth. The most globally cited articles were by J Marks and Kastikeas, which we also use as a reference in measuring marketing performance for SMEs. Some other authors this study refers to in measuring marketing performance are Morgan et al. (Citation2002), Clark (Citation1999), Ambler et al. (Citation2004), Ortiz-Rendon et al. (Citation2022), Katsikeas et al. (Citation2016), and Lamberti and Noci (Citation2010).
This study constructs a measurement model based on the model promoted by Ortiz-Rendon et al. (Citation2022), where marketing performance is measured by strategy execution, effectiveness, user satisfaction, and organizational and learning dimensions of the company. Morgan (Citation2012) measures marketing performance from two dimensions: market performance (sales, satisfaction, and retention) and share indicators. The second dimension is the financial performance with indicators of cash flow, costs, margin, profit, ROI, market value, and stock risk. Another adoption that enriches the construct of marketing performance analysis is the marketing performance measurement proposed by Klinčeková and Šalgovičová (Citation2014), which extended the performance measures proposed by Kotler (Citation1977) called a marketing audit. This includes the audit of the marketing environment, strategy, organizations, systems, productivity, and functions.
Morgan et al. (Citation2002) modeled marketing performance through three dimensions, namely marketing productivity analysis, which adopted an efficiency perspective, where input (marketing expenses, investment level, quality) was compared with output (profit or sales). This view was developed when non-financial aspects of measuring output began to be adopted, such as quality of service (Bucklin, 1978). Meanwhile, the traditional view of marketing department activities (Lau et al., Citation1999) examines marketing efficiency performances through intra-functional processes, such as the costs and turnover resulting from promotional, selling, pricing, and distributional activities. Subsequent developments in marketing performance measurement include engagement with consumers, where marketing activities are measured by customer lifetime value, loyalty, and satisfaction. The next dimension of marketing performance measurement is marketing audit, which measures the effective side, carried out by the AMA, following Kotler (Citation1977). Next is the adaptive dimension, which refers to the size of the company’s resources and capabilities.
Previous studies (e.g. Lamberti & Noci, Citation2010) also measured marketing performance in seven companies with qualitative methods. However, it should be noted that the various marketing performance measurement models above have their advantages and disadvantages. If they are adapted to the SME sector, where the organization is simple and informal, unlike that of a corporation. Therefore, some marketing performance measures, such as stock risks or financial measures for corporations, cannot be used in this construct. In other words, differences in the measurement model vary depending on the form of business, time span, and organizational level, the level of business complexity, technological advances, and the use of digitalization. Past studies such as by Nuryakin and Maryati (Citation2022) have also examined green marketing performance in SMEs, testing whether marketing performance can be supported by company innovativeness, competitive advantage and marketing orientation.
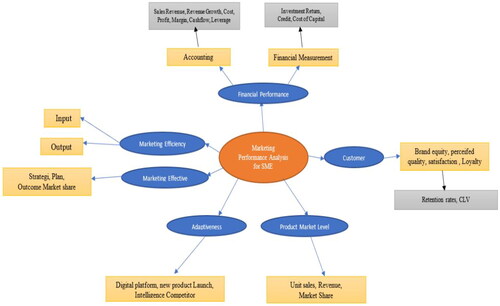
Based on the past research outlined above, the following is the model construct to be tested in this study ().
Figure 5. Marketing performance for SME model.
Adaptation construct from Morgan et al. (Citation2002), Lamberti and Noci (Citation2010), Katsikeas et al. (Citation2016), Bruce H. Clark (Citation1999), Ambler et al. (Citation2004).
Research methodology
This research is quantitative. The method used in this research is a survey using a questionnaire, where data is taken from a sample that is a member of the population. The steps taken in this study are: (1) developing a hypothesis with six latent variables and 66 indicators; (2) designing questionnaires and conducting surveys of selected MSME respondents and distributing them by random sampling, (3) analysis and interpretation of model results, (4) testing the validity of the model and evaluate the model, (5) using six variables that explain their respective indicators, as follows:
H1. Marketing efficiency is proven valid as a marketing performance measure.
H2. Marketing effectiveness is proven valid as a marketing performance measure.
H3. Adaptability is proven valid as a marketing performance measure.
H4. Product market level is proven valid as a marketing performance measure.
H5. Customers are proven valid as a marketing performance measure.
H6. Financial performance is proven valid as a marketing performance measure.
The population in this study was SMEs in Malang City with the criteria for joining the target group, both from the Department of Industry and Trade and the Cooperatives and SMEs Service in Malang City and Malang Regency. There are seven SME groups with 273 members. Based on the population, the sample in this study is calculated using the Slovin formula as follows:
where: n = Number of samples; N = Total population; e = Percentage slack of non-attachment due to sampling error, which is still desirable
The data sources in this study are primary data in the form of opinions, attitudes, justifications, and perceptions of respondents, who were SME business actors in Malang City and Malang Regency. The surveys were conducted in September until October 2022. Data collection was carried out using an online questionnaire with an assessment process through a Likert scale of 1-5. The instrument was sent to 101 SMEs, and data was examined using confirmatory factor analysis. Validity is tested by seeing the score Kaiser-Meyer-Olkin measure of sampling (KMO) and measures of sampling adequacy (MSA).
This analysis method is carried out in line with the research objective, which is to see the factors that can reflect the measurement of marketing performance. The measurement uses six indicators based on the previous studies by Lamberti and Noci (Citation2010) and Katsikeas et al. (Citation2016). Efficiency and effectiveness measurement factors in marketing are adapted from Morgan et al. (Citation2002). Financial performance dimensions and customer indicators were adapted from Katsikeas et al. (Citation2016), as well as the market product fit. The total number of indicators is 66, with all existing indicators tested for validity and reliability.
CFA testing in this study is to confirm or test the model. This study tests the suitability of the marketing performance analysis measurement model based on the model construct by Morgan et al. (Citation2002), Lamberti and Noci (Citation2010), and Katsikeas et al. (Citation2016). The construct concept in this research is multidimensional with Second Order Confirmatory Factor Analysis (CFA Second Order). The testing cannot be done directly, but in two stages: the latent construct to its six dimensions in the first stage and testing the dimensions of the indicators in the second stage.
This study was approved by the Universitas Merdeka Malang Ethical Clearance Committee (Ket.586.a/FEB/UM/IX/2022). A consent letter was provided to all respondents. The written consent to participate was acquired from respondents through the instrument. The respondents had provided their consent without any coercion. Subsequently, to protect the rights and privacy of the respondents, all forms of data acquired are kept confidential.
Results and discussion
This study examines variable indicators in measuring marketing performance in SMEs in Malang City. There are six latent variables studied, namely marketing efficiency, marketing effectiveness, adaptive, product market level, customer, and financial performance, with a total indicator for all variables amounting to 66 question items. The validity of this study is tested using CFA analysis.
In this study, there are six variables to use in the marketing performance analysis of SMEs in Malang City, with a total of 66 question items (indicators). At the factor analysis testing stage, the 66 questions were analyzed to test the feasibility of each variable. The result was that 36 indicators were declared valid. The test results using SPSS.26 software are presented in .
Table 5. KMO-MSA test.
KMO and Bartlett’s Test.
Based on the Kaiser-Meyer-Olkin Measure of Sampling Adequacy (KMO-MSA) value, a value of 0.838 is greater than 0.50, and Bartlett’s Test significance value is less than 0.05, so factor analysis can be continued.
Based on above, the anti-image correlation value for all indicators is greater than 0.50, meaning that the Measure of Sampling Adequacy (MSA) assumption is met.
Table 6. Anti-image correlation.
Based on , the extraction value for all indicators is more than 0.50, so the assumption of commonality is met.
Table 7. Communalities.
Based on , it is known that of the 66 indicators, 11 factors were formed with an Eigenvalue of more than 1. While in this study the construct variables studied were six. Therefore, it is necessary to further test the validity of the items/indicators by looking at the factor loading value. For a sample size of 100, the factor loading requirement is more than 0.55 and clustered on one factor.
Table 8. Total variance explained.
The results of the analysis show that the KMO and MSA values are above 0.5, which is 0.838, and the score on Bartlett’s Test is lower than 0.05. Then, the analysis factor could be done. The next test is to meet the assumption of Measure of Sampling Adequacy (MSA). The results show that the anti-image correlation value for all indicators is greater than 0.50, meaning that the assumption MSA is met. Based on the extraction for all indicators with a value of more than 0.50, the assumption of commonality is met (see Appendix). The next test is the Total Variance Explained. The result shows that 66 indicators formed and 11 factors show an Eigenvalue of more than 1. In this study, there were six loading factors. For a sample of 101, the factor loading provisions are more than 0.55 and clustered on 1 factor to make the selection. Notably, only valid indicators are used in subsequent analysis, and the invalid indicators are excluded. As such, the indicators that used in the subsequent analysis for each variable are as follows ().
Table 9. Variable indicators.
Next, the CFA step is repeated with all valid indicators, and the results of the value are obtained. Kaiser-Meyer-Olkin Measure of Sampling Adequacy (KMO-MSA) obtained a score of 0.874, which is higher than 0.50. Meanwhile, the score on Bartlett’s Test is lower than 0.05. Then the next analysis factor could done.
The anti-image correlation value for all indicators is greater than 0.50, meaning that the assumption of MSA is met. The second test of these 36 indicators produces extraction values for all indicators which is higher than 0.50. Therefore, the assumption of commonality is met. It is known that 36 indicators formed as many as six factors with an Eigenvalue of more than 1. This means that it follows the number of construct variables studied. The next is the calculation of the loading factor value. It can be seen that each indicator has a loading factor greater than 0.55 and is clustered on the same 1 factor. Therefore, it can be concluded that the indicators used are consistent in these variables and are feasible to use.
Based on the loading factor results, it was also found that the financial performance indicator (X6) entered into factor 1, customer (X5) entered into factor 2, product market level (X4) entered into factor 3, marketing effectiveness (X2) entered into factor 4, marketing efficiency (X1) entered into factor 5, and adaptability (X3) entered into factor 6. The reliability test uses Cronbach Alpha. If the reliability coefficient is greater than 0.60, then all of the questions are reliable. shows the results of the reliability test for each variable.
Table 10. Reliability test.
shows that the Cronbach’s Alpha value of all variables is higher than 0.6, so it can be said that all indicators are reliable.
Confirmatory factor analysis: Second-order
Next, a second-order CFA was carried out to find out whether the six variables with each indicator describe a constructed variable in measuring marketing performance in SMEs in Malang City. The results are presented in .
Figure 6. CFA diagram of the marketing performance.
Source: Questionnaire results processed by the Author (2022).
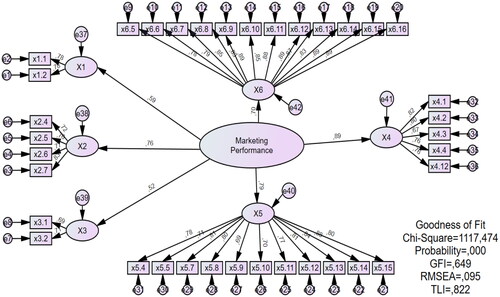
shows that for all indicators in each variable, as many as 36 indicators have a factor loading with a value higher than 0.55. Therefore, it can be said that all indicators in each construct variable are feasible to use. Likewise, the factor loading on each variable has a value of more than 0.55, except for the X3 (the adaptability variable).
For the goodness of fit from the above model, it can be said that the model is not fit because the Chi-Square, probability, GFI, RMSEA, and TLI values do not meet the criteria. So, it is necessary to make modifications to increase the goodness of fit by using modification indices of errors with high covariance values. The modified CFA model is shown in .
Figure 7. Modified CFA diagram of the marketing performance.
Source: Questionnaire results processed by the Author (2022).
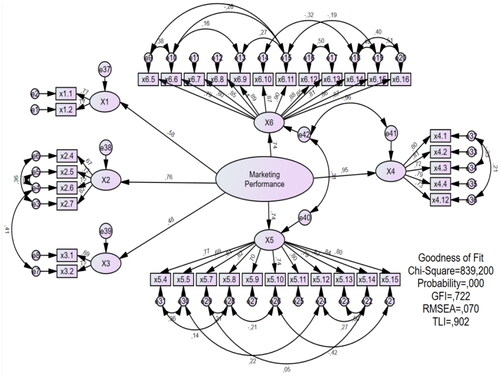
From the CFA model, it can be seen that the Chi-Square value is still high but lower than the previous model. Meanwhile, the probability value is still 0.000. This is because the sample used is large (n = 101). Therefore, the probability results tend to be significant. However, the RMSEA is smaller than 0.08 (0.07 < 0.08), and the TLI is greater than 0.90 (0.902 > 0.90), so it can be said that the model is fit.
The second goal of this study is to determine which dimensions most accurately reflect marketing performance. This can be demonstrated by displaying the loading factor values in descending order, beginning with the largest, namely product market level (X4), marketing effectiveness (X2), customers (X5), financial performance (X6), marketing efficiency (X1), and adaptability (X3).
Hypothesis testing
This study analyzes the relationship between variables and their dimensions and indicators. The data accuracy is ensured through the loading factor values between latent variables and their indicators. The CFA test results on latent variables, namely marketing efficiency, marketing effectiveness, adaptability, product market level, customers, and financial performance, as seen from the factor loading aspect, prove the six variables valid to represent their indicators. Thus, all six existing hypotheses are accepted.
The factor loading results have met the minimum standard of 0.5. Therefore, 36 questions asked based on the indicators can explain the variables. The RMSEA is smaller than 0.08 (0.07 < 0.08), and TLI is greater than 0.90 (0.902 > 0.90), so the model is fit. The results of this CFA conclude that the six variables in measuring marketing performance in SMEs in Malang City are appropriate and feasible to use. The 36 indicators have loading factor values of more than 0.55, so all indicators on each construct variable are feasible to use. Factor Loading values in order starting from the largest are product market level (X4), marketing effectiveness (X2), customers (X5), financial performance (X6), marketing efficiency (X1), and adaptability (X3).
Discussion
The study results confirmed that all dimensions reflect the measurement of marketing performance. The dimensions are based on the results of research by Lamberti and Noci (Citation2010) and Katsikeas et al. (Citation2016), consisting of both financial and non-financial performance, accommodating the initial idea of Bruce H. Clark (Citation1999), stating that there is a perspective of measuring financial to non-financial, output to input, and one dimensional to multidimensional aspects. The initial test contained 66 indicators, but some of them were invalid, so they were eliminated from the study. The next test used 36 valid indicators to measure marketing performance. Most indicators that reflect the measurement of marketing performance are from the dimensions of financial performance, customer, and product market level.
The result of this study supports that financial factors play an essential role in shaping the measurement of marketing performance proposed in previous studies by Bruce H. Clark (Citation1999), Goodman, Sam R (1970), Feder, Robert A. (1965), and Buzzell, Robert D. and Gale, Bradley T. (1987). The customer dimension refers to the study by Lamberti and Noci (Citation2010) and O'Sullivan and Abela (Citation2007), while the product market level is an adaptation of the dimensions. The marketing efficiency dimension refers to the measurement of productivity analysis, which adopts an efficiency perspective, where the input size (marketing expenses, investment level, quality) is compared with the output (profit or sales). Marketing effectiveness (Ortiz-Rendon et al., Citation2022) is where marketing performance is measured by the dimensions of strategy execution, effectiveness, user satisfaction, and organizational and learning dimensions of the company.
The adaptability dimension (Morgan et al., Citation2002) measures the organization’s ability to sense and respond to changes in customer needs and hence lead to adaptive marketing. The product market level dimension measures how successful the product is based on the size of the target market, whether the company can identify customer needs, the value proposition of the impact of the product on the customer, and whether the product works properly. Expectations and feedback measure the product launched and whether it is received by the market. The business operations, in terms of growth rate, measure growth when the market accepts the business. As for the customer dimension, it measures a company’s success from the consumer side based on perceived quality, satisfaction, and loyalty. Lastly, financial performance measures sales revenue, revenue growth, costs, profits, margin, cash flow, and leverage.
Our theoretical discussion suggested that the marketing performance assessment consists of categories of items to measure marketing performance. In the case of SMEs in Malang City, these are product market level (X4), marketing effectiveness (X2), customers (X5), financial performance (X6), marketing efficiency (X1), and adaptability (X3).
For the adaptive dimension, the result is in line with Onyinyi and Kaberuka (Citation2019), stating that transformation capability is needed to be adaptive in supporting the performance of SMEs. The customer dimension in marketing performance measurement is in line with a study involving SMEs in Indonesia (Udayana et al., Citation2021), stating that the ability to influence customers can improve marketing performance.
According to the study’s findings, the six dimensions that assess marketing performance that have the highest value in order are product market level (X4), marketing effectiveness (X2), customers (X5), financial performance (X6), marketing efficiency (X1), and adaptability (X3). The maximum value is at the product market level, adapted from Katsikeas et al. (Citation2016). Measurement items from this dimension include measuring the target market, identifying customer needs, value proposition, product impact on customers, whether the product works as expected, feedback from customers about the product launched, the average profit metrics obtained from customers, and whether a product is in accordance with the market and the business operations, and the growth rate, which indicates the market’s acceptance.
Based on the characteristics of respondents who filled out the questionnaire, 71% of respondents have a business license. This means that SMEs with a business license contribute to the formation and suitability of measurements at the product market level. The second highest value that describes the measurement of marketing performance is from the marketing effectiveness dimension, measured by strategy execution, effectiveness, user satisfaction, organization, and learning by the company. Effectiveness is considered a determinant of marketing performance based on a survey conducted in Malang, Indonesia, which is in line with a previous study by Ortiz-Rendon et al. (Citation2022).
Based on the characteristics of the city, Malang can be said as a productive city, with a population of 866,118 people in 2021 and many higher education institutions, as well as natural and artificial tourism spots. It should also be noted that the sample in this study focuses on MSMEs in the culinary, agribusiness, creative business, fashion, and a small portion in other business fields. Based on the city characteristics, Malang is a tourism city and a city of education, so food businesses thrive with a percentage of 61%, fashion at 18%, and agribusiness or food processing at 12%. The characteristics of this line of business can represent the measurement of marketing performance in general, although this study is limited in terms of regional coverage. The large number of MSMEs in the food sector in this research sample is most likely due to the strong traditional culinary characteristics of the city and the openness to new types of food. This is because there are a lot of migrants in Malang City, both students and tourists. Therefore, this study shows that the highest marketing performance measurement is the product market level dimension, which measures the target market and identifies customer needs, business special characteristics based on capabilities, special features based on market demand, and suitability of the product for the market.
We modeled the measurement of these six dimensions that are suitable for SMEs, although there are still many other marketing performance measurement studies, including dimensions that measure the innovativeness of SMEs in the marketing performance (Bamfo & Kraa, Citation2019; Makate et al., Citation2019). In this study, we limit the scope to these dimensions, assuming that further measurements are needed, such as innovation. SMEs tend to lack the capital to innovate, so the innovation dimension is not included in the measurement.
In addition to comparing the results of this study with previous research, we also elaborate on the results of this study based on the SME performance research in other developing countries. The results of this study provide academic and practical implications for marketing measurement practices, especially in the context of a business world experiencing high dynamics in terms of marketing technology, the existence of social media, online marketing patterns, and the changing marketing measurement. A study by Qalati et al. (Citation2022) on the challenges of SME change in an environment where digital technology and social media are required found that social media adoption has a significant effect on SME performance. This suggests that social media can be an effective tool for SMEs in developing countries to improve their performance. However, SMEs in developing countries face problems and challenges, such as rapid changes in market demand, uncertainty, and lack of resources. The marketing measurement from this research can be a practical solution the dimensions include digital marketing and social media.
This is the innovative aspect of this study. The integrated measurement categories for SMEs’ marketing performance are based on SMEs’ characteristics. This finding supports previous research (Ortiz-Rendon et al., Citation2022; Morgan, Citation2012; Klinčeková & Šalgovičová, Citation2014; Morgan et al., Citation2002; Lau et al., Citation1999; Lamberti & Noci, Citation2010; Wu et al., Citation2015, Morgan et al., Citation2002; Lamberti & Noci, Citation2010; Katsikeas et al., Citation2016; Bruce H. Clark, Citation1999; Ambler et al., Citation2004). The difference in this study lies in the specificity of marketing performance measurements that are in accordance with SMEs.
This study’s findings have two significant implications. The first is for SMEs, where marketing performance measurement can provide chances for self-learning procedures. SMEs can assess their marketing performance, identify their shortcomings and strengths, and comprehend their commercial positioning. The second implication is for academics and policymakers. The findings of this study can provide insight into the current status of SMEs, the level of maturity, whether SME players are stable, and market preparedness. Another implication is that this research provides support to the "MSMEs go upmarket" program by the Indonesian government. Appropriate and easily replicable performance measurement in MSMEs provides practical benefits in performance evaluation and facilitates MSMEs to determine the right strategy for their business.
The coverage area becomes the limitation of this study, i.e. Malang City and Regency, which limits the generalizability of the findings. It cannot be employed at the national level as the quantity of samples and representativs from various regions in Indonesia is not sufficient.
Nonetheless, the results of the confirmatory analysis in this study provide opportunities for further research, including further exploring the adaptability dimension because it has the lowest value. The dimension has two indicators, namely evaluating competitors and monitoring the progress of business competitor’s efforts. Past studies have examined the innovativeness of SMEs in developing countries that support marketing performance (Majali et al., Citation2022), which is relevant to the adaptability dimension of this study. Further research opportunities based on transformational leadership also have the opportunity to enrich further studies, such as a study by Asad et al. (Citation2022), as well as examine Islamic financing factors for SME performance, such as a study by Bilal and Sulaiman (Citation2021).
Conclusion
This study has shown six characteristics that describe the marketing performance of SMEs in Malang, including product market level (X4), marketing effectiveness (X2), customers (X5), financial performance (X6), marketing efficiency (X1), and adaptability (X3). The 66 indicators were measured during the first model testing. However, only 36 could be used for subsequent research as a measure of marketing performance in SMEs. The second goal was to identify the most powerful factors in measuring marketing performance. According to the findings of this study, the most influential factors that reflect marketing performance for SMEs are product market level, marketing effectiveness, and customers.
Future research
From our study of marketing performance, future research can test the six variables and 36 indicators that determine SMEs’ marketing performance. The research can also apply this model to start-up businesses that are familiar with digital technology or SMEs in the middle category. Furthermore, this measurement of marketing performance can also be enriched with measurements from the branding side (as a separate variable) because brand measurement as part of the customer dimension shows invalid results and has been eliminated from this model. In addition, past studies have tried to examine what factors leverage the performance of SMEs. For example, Sari et al. (Citation2023) prove that innovation capability is a determinant of performance in SMEs even during a pandemic. This study examines SMEs in Indonesia in the West Java region, which can be a reference for further research by including elements of innovative capability.
Public Interest Statement Cogent.docx
Download MS Word (12.5 KB)Appendix_For_Cogent_BM_2024.docx
Download MS Word (1.1 MB)Disclosure statement
No potential conflict of interest was reported by the author(s).
Data availability statement
Underlying Data:
This project contains the raw data of respondent responses
10.6084/m9.figshare.21786074
This project contains data Results that analyzed using Confirmatory Analysis
10.6084/m9.figshare.21805065
Extended data
Questionnaire for SMEs to confirm the model
10.6084/m9.figshare.21805035
Ethics clearance
10.6084/m9.figshare.21820083
Additional information
Notes on contributors

Resanti Lestari
Resanti Lestari is lecturer at University of Merdeka Malang. She was the visiting research at Research Center for Cooperative, Corporation, and People’s Economy at BRIN. Her research interests in Branding, Marketing Performance and its focused to development of SMEs.
Syahyuti
Syahyuti and Sahat Aditua Fandhitya Silalahi currently Senior Researcher at Indonesia National Research and Innovation Agency.
Berto Mulia Wibawa
Berto Mulia Wibawa is lecturer at Department of Business Management, Institut Teknologi Sepuluh Nopember.
Fatmasari Endayani
Fatmasari Endayani and Dyah Setyawati is lecturer at University of Merdeka Malang.
Dyah Setyawati
Fatmasari Endayani and Dyah Setyawati is lecturer at University of Merdeka Malang.
Sahat Aditua Fandhitya Silalahi
Syahyuti and Sahat Aditua Fandhitya Silalahi currently Senior Researcher at Indonesia National Research and Innovation Agency.
References
- Ambler, T., Kokkinaki, F., & Puntoni, S. (2004). Assessing marketing performance: Reasons for metrics selection. Journal of Marketing Management, 20(3–4), 1–25. https://doi.org/10.1362/026725704323080506
- Asad, M., Kashif, M., Sheikh, U. A., Asif, M. U., George, S., Khan, G., & Ul, H. (2022). Synergetic effect of safety culture and safety climate on safety performance in SMEs: does transformation leadership have a moderating role? International Journal of Occupational Safety and Ergonomics: JOSE, 28(3), 1858–1864. https://doi.org/10.1080/10803548.2021.1942657
- Bamfo, B. A., & Kraa, J. J. (2019). Market orientation and performance of small and medium enterprises in Ghana: The mediating role of innovation. Cogent Business & Management, 6(1), 1–16. https://doi.org/10.1080/23311975.2019.1605703
- Bilal, Z. O., & Sulaiman, M. A. B. A. (2021). Factors persuading customers to adopt Islamic banks and windows of commercial banks services in sultanate of Oman. Review of International Geographical Education Online, 11(4), 651–660. https://doi.org/10.33403/rigeo.800679
- Bolisani, E., & Scarso, E. (2012). Marketing audit for knowledge intensive business services. Electronic Journal of Knowledge Maangement, 12(1), 3–14.
- Bruce, E., Keelson, S., Amoah, J., & Bankuoru Egala, S. (2023). Social media integration: An opportunity for SMEs sustainability. Cogent Business & Management, 10(1), 1–20. https://doi.org/10.1080/23311975.2023.2173859
- Clark, B. (2007). Measuring marketing performance: Research, practice and challenges. In Business performance measurement: Unifying theories and integrating practice (2nd ed., pp. 36–63). Cambridge University Press. https://doi.org/10.1017/CBO9780511805097.004
- Clark, B. H. (1999). Marketing performance measures: History and interrelationships. Journal of Marketing Management, 15(8), 711–732. https://doi.org/10.1362/026725799784772594
- Clark, B. H., Abela, A. V., & Ambler, T. (2006). An information processing model of marketing performance measurement. Journal of Marketing Theory and Practice, 14(3), 191–208. https://doi.org/10.2753/MTP1069-6679140302
- Dewi, F., & Mahendrawathi, E. R. (2019). Business process maturity level of MSMEs in East Java, Indonesia. Procedia Computer Science, 161, 1098–1105. https://doi.org/10.1016/j.procs.2019.11.221
- Donthu, N., Kumar, S., Mukherjee, D., Pandey, N., & Lim, W. M. (2021). How to conduct a bibliometric analysis: An overview and guidelines. Journal of Business Research, 133(March), 285–296. https://doi.org/10.1016/j.jbusres.2021.04.070
- Hasibuan, S. (2015). SMEs development strategy for competitive and sustainable typical local snacks of Banten Province. International Journal on Advanced Science, Engineering and Information Technology, 5(6), 410–414. https://doi.org/10.18517/ijaseit.5.6.602
- Inam Bhutta, A., Sheikh, M. F., Munir, A., Naz, A., & Saif, I. (2021). Managerial ability and firm performance: Evidence from an emerging market. Cogent Business and Management [Internet], 8(1). https://doi.org/10.1080/23311975.2021.1879449
- Jaidan, J. (2010). Upaya Pengembangan Usaha Kecil Menengah (UKM) Dengan Memanfaatkan E-commerce. Jurnal Sistem Informasi, 2(1), 159–168.
- Jaworski, B. J. (1988). Toward a theory of marketing control: Environmental context, control types, and consequences. Journal of Marketing, 52(3), 23–39. https://doi.org/10.1177/002224298805200303
- Jaworski, B. J., Stathakopoulos, V., & Krishnan, H. S. (1993). Control combinations in marketing: Conceptual framework and empirical evidence. Journal of Marketing, 57(1), 57–69. https://doi.org/10.1177/002224299305700104
- Katsikeas, C. S., Morgan, N. A., Leonidou, L. C., & Hult, G. T. M. (2016). Assessing performance outcomes in marketing. Journal of Marketing, 80(2), 1–20. https://doi.org/10.1509/jm.15.0287
- Kim, J., Suh, E., & Hwang, H. (2003). A model for evaluating the effectiveness of crm using the balanced scorecard. Journal of Interactive Marketing, 17(2), 5–19. https://doi.org/10.1002/dir.10051
- Klinčeková, S., & Šalgovičová, J. (2014). The role of marketing audit and value of information. International Journal for Innovation Education and Research, 2(1), 8–13. https://doi.org/10.31686/ijier.vol2.iss1.132
- Kotler. (1977). The marketing audit comes of age. Sloan Management Review, 3(34), 25–46.
- Lamberti, L., & Noci, G. (2010). Marketing strategy and marketing performance measurement system: Exploring the relationship. European Management Journal, 28(2), 139–152. https://doi.org/10.1016/j.emj.2009.04.007
- Lau, K., Hart, S., & Tzokas, N. (1999). The impact of marketing research activity on SME export performance: Evidence from the UK. Journal of Small Business Management [Internet], 37(2), 63–75. https://www.scopus.com/inward/record.uri?eid=2-s2.0-0033246617&partnerID=40&md5=5706ea826aa3ce0bcba87bd89b47af8a
- Liang, X., Gao, Y., & Ding, Q. S. (2018). “What you measure is what you will get”?:Exploring the effectiveness of marketing performance measurement practices. Cogent Business & Management, 5(1), 1503221. https://doi.org/10.1080/23311975.2018.1503221
- Majali, T., Alkaraki, M., Asad, M., Aladwan, N., & Aledeinat, M. (2022). Green transformational leadership, green entrepreneurial orientation and performance of SMEs: The mediating role of green product innovation. Journal of Open Innovation: Technology, Market, and Complexity, 8(4), 191. https://doi.org/10.3390/joitmc8040191
- Makate, C., Makate, M., Siziba, S., & Sadomba, Z. (2019). The impact of innovation on the performance of small-to-medium informal metal-trade enterprises in Zimbabwe. Cogent Business & Management, 6(1), 1–18. https://doi.org/10.1080/23311975.2019.1625095
- Morgan, N. A. (2012). Marketing and business performance. Journal of the Academy of Marketing Science, 40(1), 102–119. https://doi.org/10.1007/s11747-011-0279-9
- Morgan, N. A., Clark, B. H., & Gooner, R. (2002). Marketing productivity, marketing audits, and systems for marketing performance assessment: Integrating multiple perspectives. Journal of Business Research, 55(5), 363–375. https://doi.org/10.1016/S0148-2963(00)00162-4
- Nuryakin, N., & Maryati, T. (2022). Do green innovation and green competitive advantage mediate the effect of green marketing orientation on SMEs’ green marketing performance? Cogent Business & Management, 9(1), 1–19. https://doi.org/10.1080/23311975.2022.2065948
- Onyinyi, B., & Kaberuka, W. (2019). ICT fusion on the relationship between resource transformation capabilities and quality management practices among SMEs in Uganda. Cogent Business & Management, 6(1), 1-17. https://doi.org/10.1080/23311975.2019.1586063
- Ortiz-Rendon, P. A., Munuera-Aleman, J. L., & Montoya-Restrepo, L. A. (2022). Exploring marketing control mechanisms from a strategy perspective. Marketing Intelligence & Planning, 40(5), 639–655. https://doi.org/10.1108/MIP-06-2021-0192
- O’Sullivan, D., & Abela, A. V. (2007). Marketing performance measurement ability and firm performance. Journal of Marketing, 71(2), 79–93. https://doi.org/10.1509/jmkg.71.2.79
- Page, L. E. A. D., & Io, N. (2017). 2017 small business marketing trends report.
- Qalati, S. A., Ostic, D., Sulaiman, M. A. B. A., Gopang, A. A., & Khan, A. (2022). Social media and SMEs’ performance in developing countries: Effects of technological-organizational-environmental factors on the adoption of social media. SAGE Open, 12(2), 215824402210945. https://doi.org/10.1177/21582440221094594
- Rothenberg, A. D., Gaduh, A., Burger, N. E., Chazali, C., Tjandraningsih, I., Radikun, R., Sutera, C., & Weilant, S. (2016). Rethinking Indonesia’s informal sector. World Development, 80, 96–113. https://doi.org/10.1016/j.worlddev.2015.11.005
- Saad, M. H., Hagelaar, G., van der Velde, G., & Omta, S. W. F. (2021). Conceptualization of SMEs’ business resilience: A systematic literature review. Cogent Business & Management, 8(1), 1–33. https://doi.org/10.1080/23311975.2021.1938347
- Sari, D., Kusuma, B. A., Sihotang, J., Febrianti, T., Sari, D., Kusuma, B. A., et al. (2023). The role of entrepreneurial marketing & innovation capability in the performance of SMEs during covid-19 pandemic: Evidence of MSMEs in West Java The role of entrepreneurial marketing & innovation capability in the performance of SMEs during covid-19 pan. Cogent Business and Management [Internet], 10(1). https://doi.org/10.1080/23311975.2023.2194091
- Shah, D., Rust, R. T., Parasuraman, A., Staelin, R., & Day, G. S. (2006). The path to customer centricity. Journal of Service Research, 9(2), 113–124. https://doi.org/10.1177/1094670506294666
- Sheth, J. N., Sisodia, R. S., & Sharma, A. (2000). The antecedents and consequences of. Journal of the Academy of Marketing Science, 28(1), 55–66. https://doi.org/10.1177/0092070300281006
- Smith, J. A., & Brown, R. B. (2021). Defining small and medium enterprises: A literature review. Journal of Business Research, 78(March), 271–282.
- Srivastava, R. K., Shervani, T. A., & Fahey, L. (1999). Marketing, business processes, and shareholder value: An organizationally embedded view of marketing activities and the discipline of marketing. Journal of Marketing, 63(4_suppl1), 168–179. https://doi.org/10.1177/00222429990634s116
- Tobing, D. S. K., Fathorazz, M., & Wulandari, G. A. (2018). Mapping the competitive advantage of SMEs in East Java, Indonesia. Jurnal Dinamika Manajemen, 9(1), 23–32. https://doi.org/10.15294/jdm.v9i1.14649
- Udayana, I. B. N., Farida, N., Lukitaningsih, A., Tjahjono, H. K., & Nuryakin. (2021). The important role of customer bonding capability to increase marketing performance in small and medium enterprises. Cogent Business and Management, 8(1), 1–20. https://doi.org/10.1080/23311975.2021.1932239
- Wu, W., Chen, H., & Huang, Y. (2015). Asia Pacific management review antecedents and consequences of marketing audits: Empirical evidence from Taiwanese firms. Asia Pacific Management Review, 20(3), 156–164. https://doi.org/10.1016/j.apmrv.2014.09.001
- Yamani, A. Z., Muhammad, A. W., & Faiz, M. N. (2019). Penguatan Ekonomi Lokal Pada Pelaku UMKM Berbasis Digital Di Desa Winduaji Kabupaten Brebes. Madani: Indonesian Journal of Civil Society, 1(1), 24–28. https://doi.org/10.35970/madani.v1i1.29
Appendix.
CFA result
Validity Test
6 Variable with 66 Indicator
Marketing Efficiency (X1) consists of 5 indicators,
Marketing Effective (X2) consists of 10 indicators,
Adaptiveness (X3) consists of 6 indicators,
Product Market Level (X4) consists of 14 indicators,
Customer (X5) consists of 15 indicators, and
Financial Performance (X6) consists of 16 indicators.
KMO-MSA Test
Anti-Image Correlation
Communalities
Total Variance Explained
Validity Test
Indicator Variable
KMO-MSA TEST
Anti-Image Correlation
Communalities
List of Total Variance Explained
Factor Loading Indicator
Reliability Test
Reliability Test
Confirmatory Factor Analysis Second Order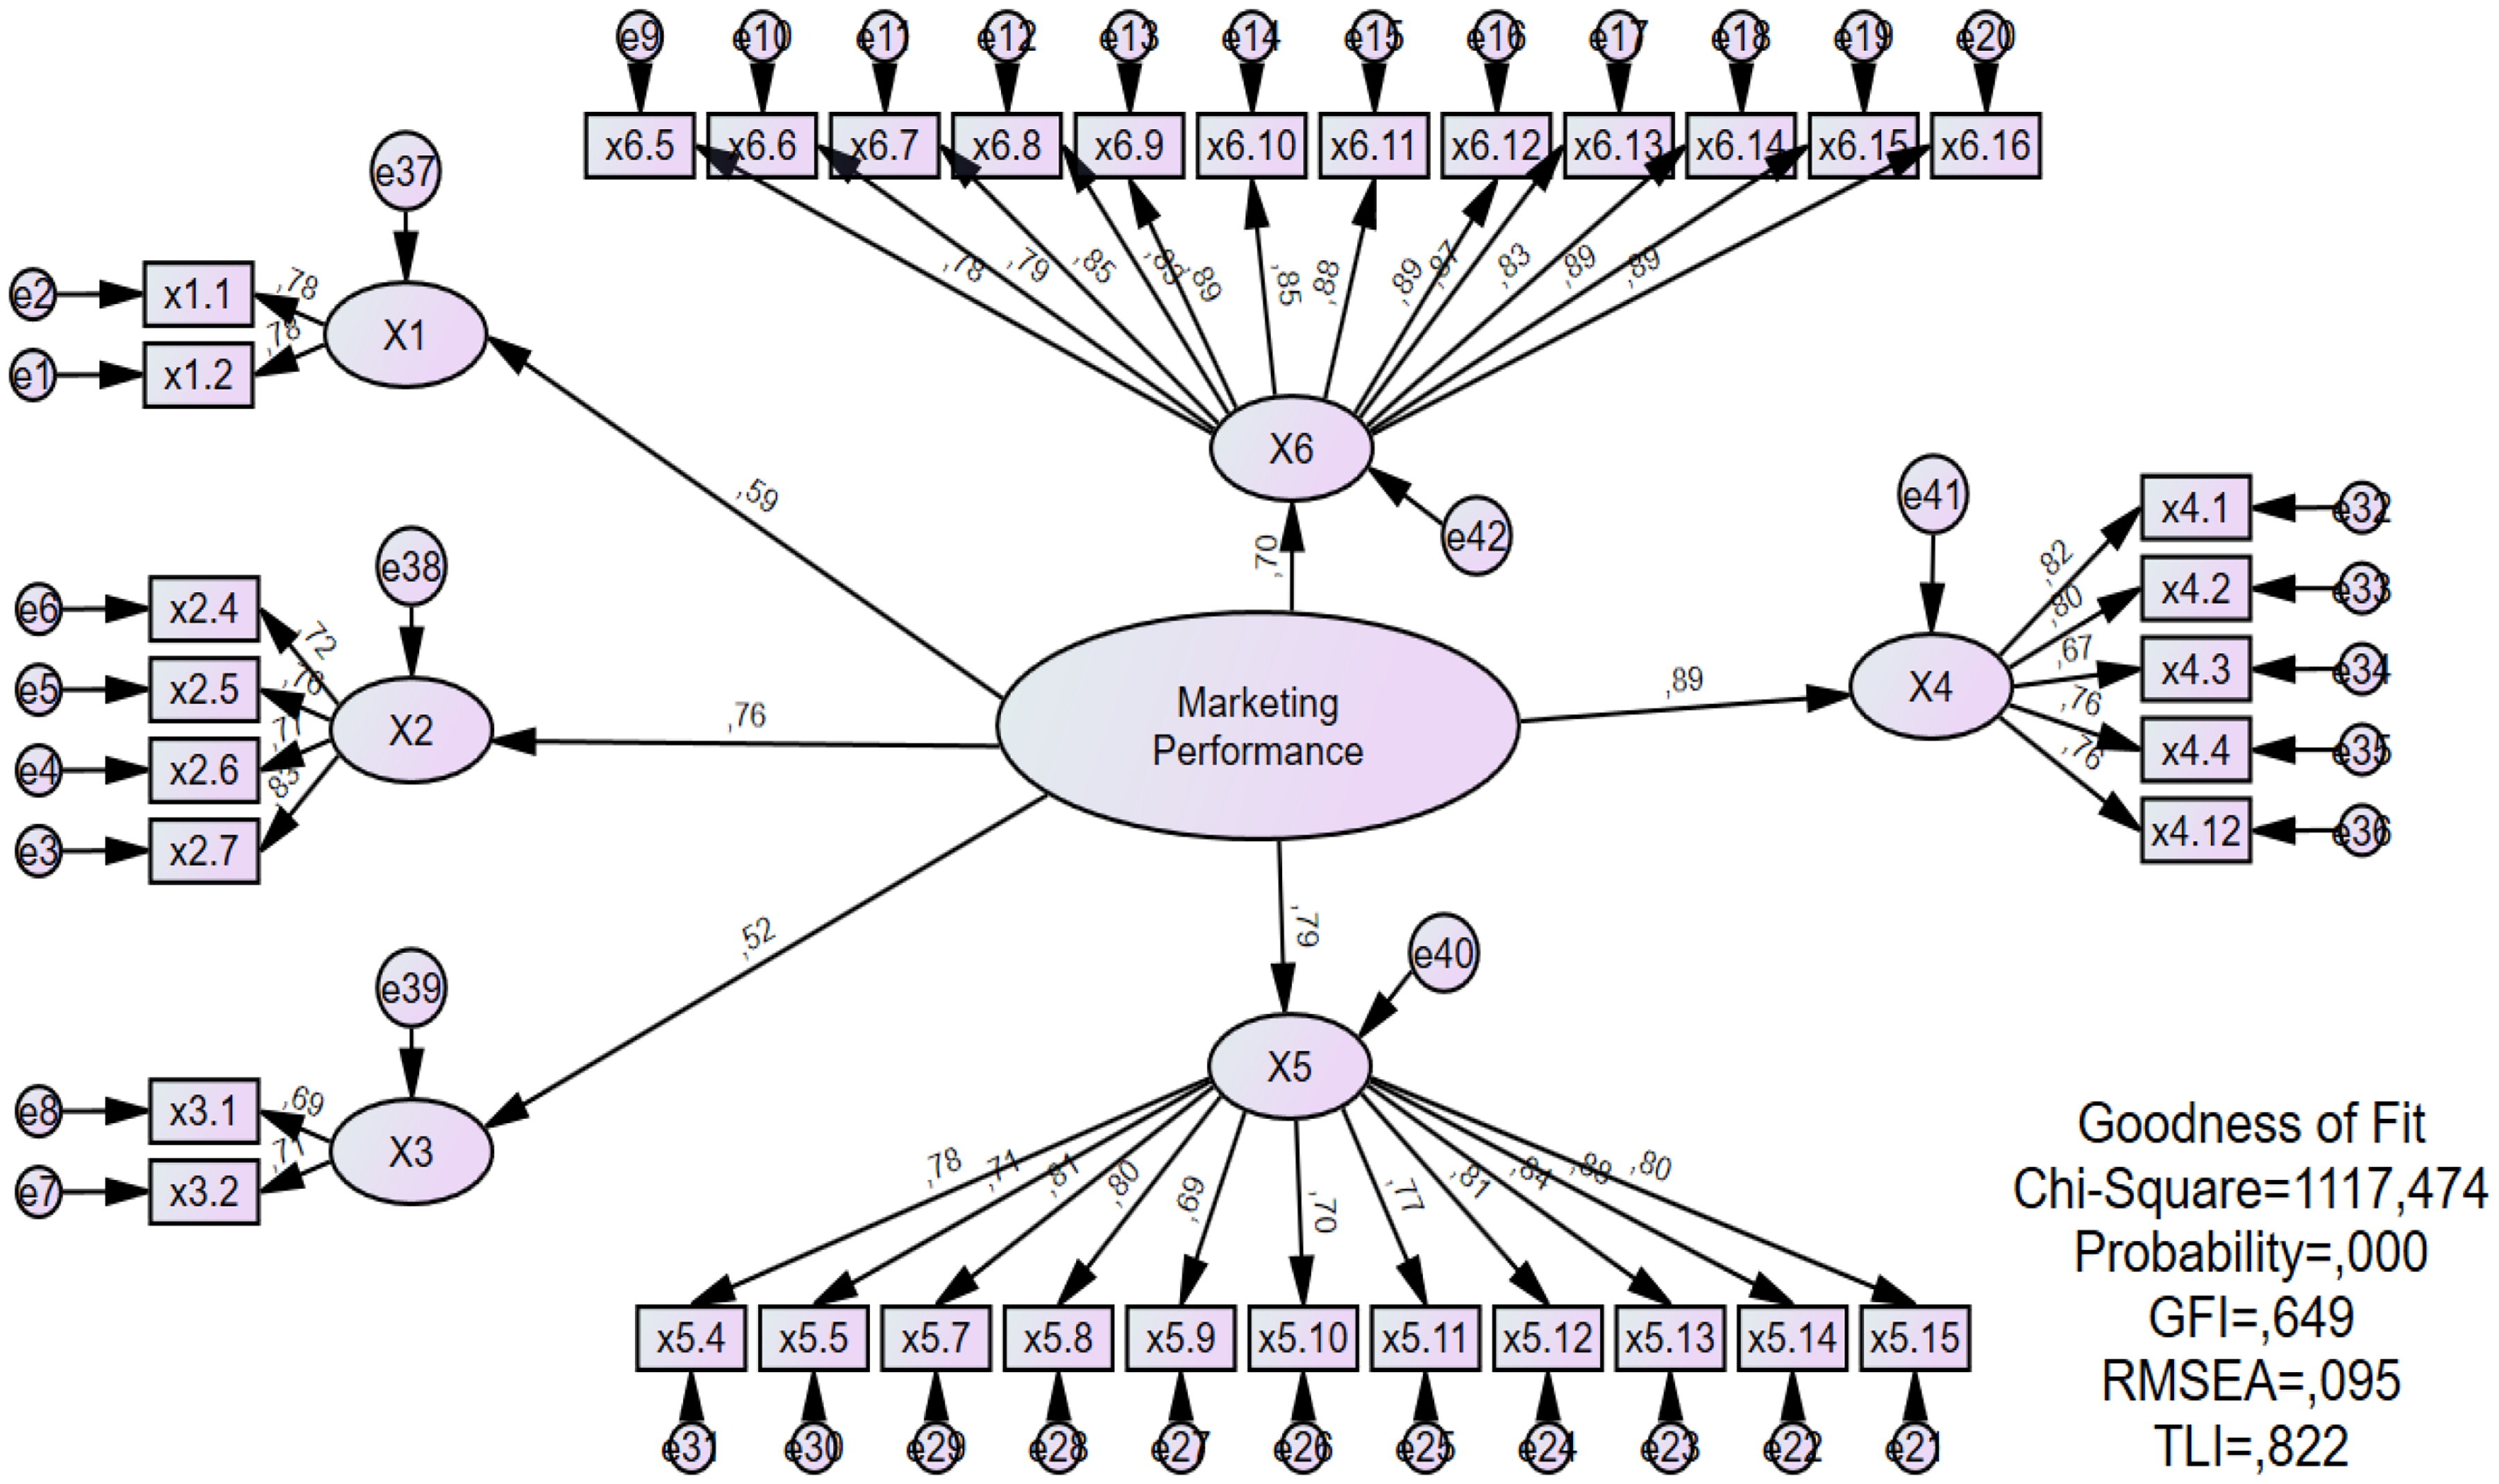
CFA Marketing Performance Diagram
CFA modified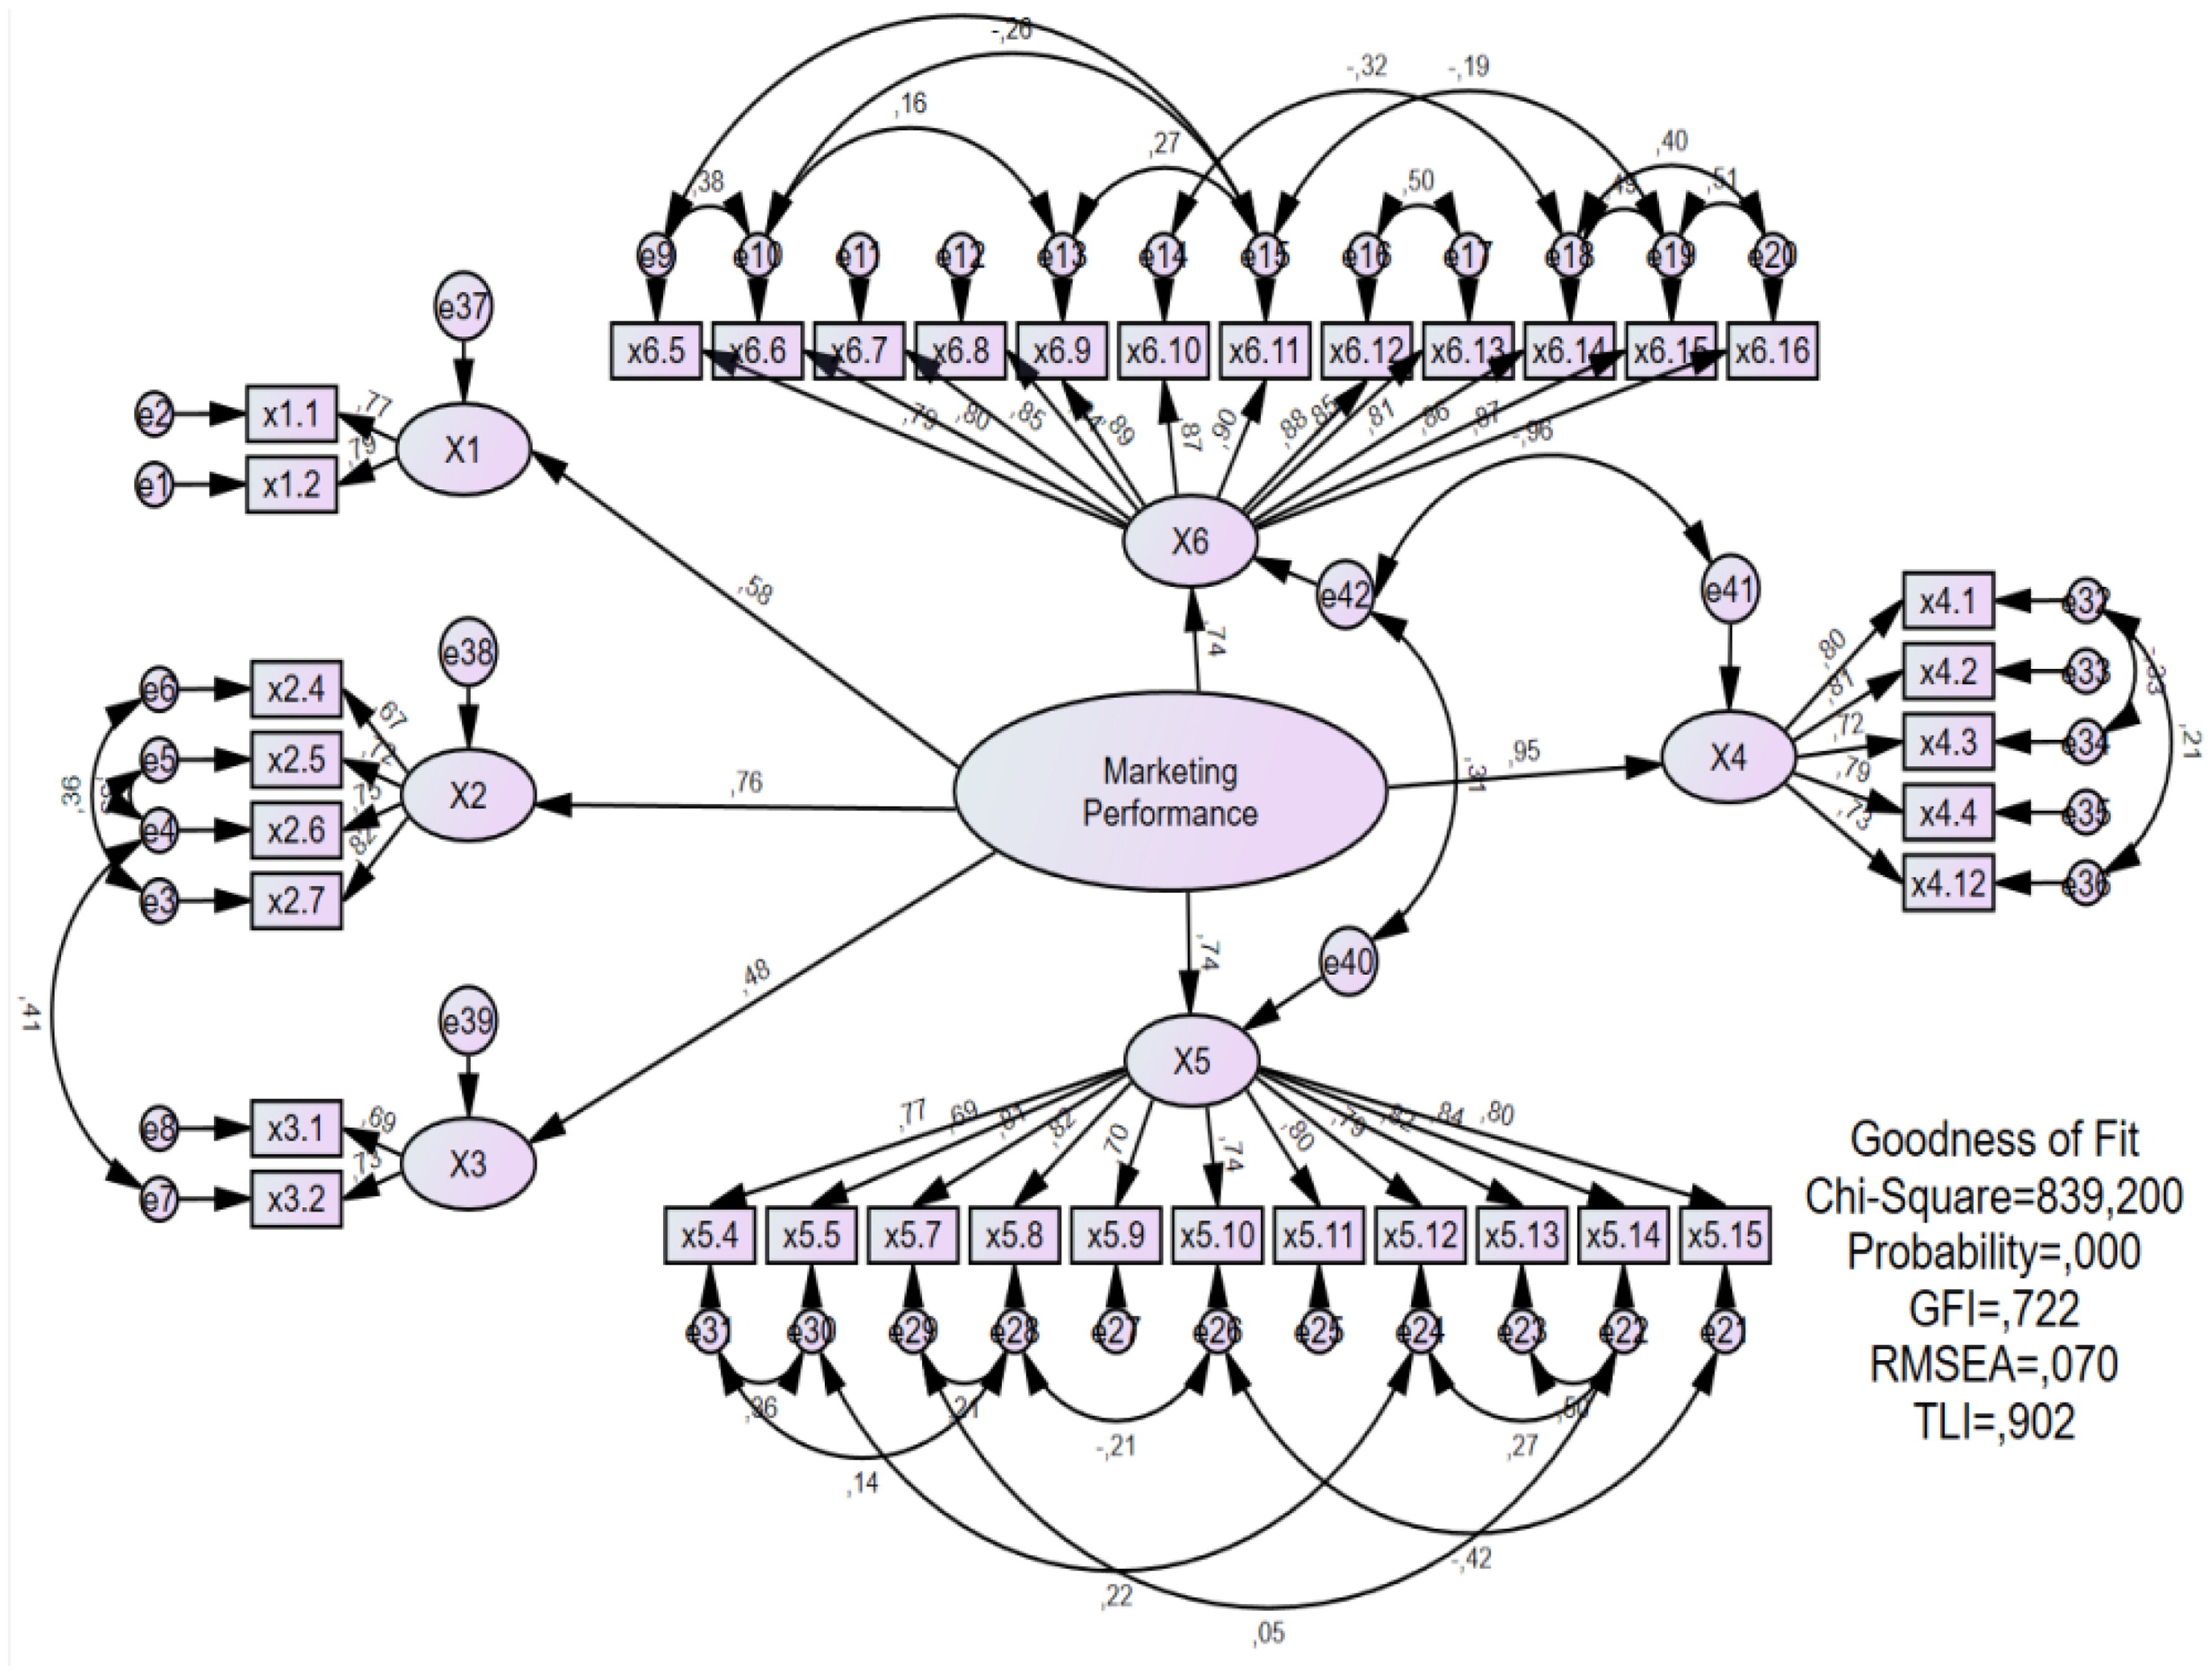
GCFA Marketing Performance Modified