
 ?Mathematical formulae have been encoded as MathML and are displayed in this HTML version using MathJax in order to improve their display. Uncheck the box to turn MathJax off. This feature requires Javascript. Click on a formula to zoom.
Abstract
Product upgrading is the most viable solution for small holder farmers to increase their income and capture more of the value of their product in the value chain. This paper was aimed at assessing factors affecting smallholder tomato producers’ participation decisions in product upgrading (adopting improved variety, pesticide application, and staking). Qualitative and quantitative data were collected from primary and secondary sources of data. Semi-structured interview, focus group discussion, key informant interview, and personal observation were used to collect data. To analyse data obtained from sample respondents, descriptive and econometric models (multivariate probit model) were used. The result of the study implied that family size, farming experience, year of school, access to market information, training, seed, and pesticide significantly and positively influenced one or more product upgrading techniques while age and market distance had negative and significant association with product upgrading. Therefore, policy and development interventions should give emphasis towards the improvement of such institutional support system so as to foster household participation in product upgrading.
1. Introduction
Tomato (Solanum lycopersicum L.) is one of the world’s most important edible and nutritious vegetable crops. It is the second most crucial vegetable crop next to potato (Solanum tuberosum L.), with an average of 182.3 million tons of tomato produced on 4.85 million ha yearly (FAOSTAT, Citation2019). Among vegetable crops grown in Ethiopia, it ranks third in area coverage (4.49%), after red pepper and Ethiopian cabbage, and fourth in total production (5.45%), following Ethiopian cabbage, red pepper, and green pepper (Regassa et al., Citation2016). Particularly, Jimma zone from Ethiopia is a potential area of vegetable production. During 2021/22, the total production volume of vegetables in the zone was 1,419,466.7 tons whereas the proportion of tomato was 171,203.9 tons (Jimma Zone Agricultural and Rural Development Office, Citation2022). Seka Chekorsa district is one of the potential vegetable-producing districts in the Jimma zone. Of total cultivated land, 13,022 hectares of land were covered by vegetables in the district during the 2021/22 cropping season.
Despite the nutritional, economic, and health importance of tomato and the huge potential of Ethiopia to produce tomato, its actual production and productivity in the country are deficient (Abera et al., Citation2020). In comparison to the average production of 16, 96.8, 63.9, 43, and 38.3 tons/ha in Africa, America, Europe, Asia, and the entire world, respectively, the average tomato productivity in the nation is a relatively low 6.18 tons/ha (Brasesco et al., Citation2019).
To cope with ever-growing and dramatic changes in customer demand, it is necessary to cultivate market oriented product. Cuddeford (Citation2014) noted that farmers need to upgrade their products to increase their income and capture more of the value (economic rent) in the value chain. For this study, adopting improved tomato variety, tomato staking, and applying pesticides in which sampled households in the study area engaged were regarded as product upgrading techniques.
Cultivating local variety is mostly common among smallholder producers living in developing countries including Ethiopia. Thus, the use of local and poor-quality seed varieties limits productivity and the quality of tomato, affecting the market price (Shafiwu, Citation2021). Adoption of improved varieties has a positive effect on household well-being and has a high contribution to mitigate the malnutrition problem.
Pests and diseases are affecting product quantity and quality. Consumers, on the other hand, are demanding agricultural products that are high quality and blemish free. Pesticides became one of the priority inputs in the modern agriculture to raise production by fighting against diseases and pests (Arun & Ghimire, Citation2017). Therefore, the application of pesticide is a means to save crops through control of disease and increase the quality and quantity of agricultural produce (Mutuku et al., Citation2014). The other benefits of pesticides include the maintenance of aesthetic quality and the protection of human health from disease-carrying organisms (Christos, Citation2009). However, the resultant misuse and excessive use of pesticides by small-scale tomato farmers have become detrimental to human health as well as the environment (Mergia et al., Citation2021). Therefore, to address problems associated with the use of pesticides, applying them in the right quantities and at the right time is necessary.
A tomato vine cannot support itself, so it needs to be tied to the stake. Staking keeps fruits off the ground which reduces infections and decaying fruits, and increases marketable yield (Lamptey & Koomson, Citation2021). Good air circulation around the leaves and fruit of upright tomato plants lessens disease problems. Sowley and Damba (Citation2013) also found that staking has had a positive effect on tomato weight, yield, and quality in their study of the influence of staking and pruning on the growth and yield of tomato in the Guinea Savannah Zone of Ghana. Tomato on staked plants are larger and ripen earlier than those on plants allowed to sprawl.
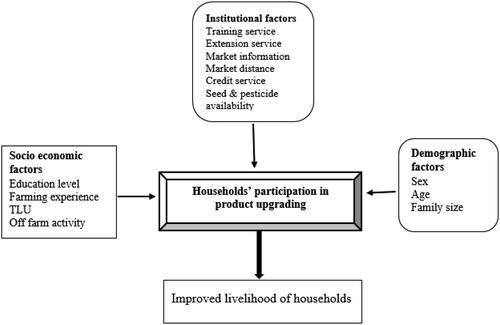
Despite the tomato production potential of the study area, tomato produced elsewhere were traded in the study area at high prices due to seasonal production and poor quality of the product cultivated in the study area. Consequently, smallholder tomato producers captured low market prices for their downgraded products. In the context of this study, Product upgrading is a means of cultivating a new variety of tomato or improving the quality of the usual produce through keeping fruit of tomato off ground (staking) and pesticide application. Such product upgrading practices are very critical for producers so as to obtain better market prices then profitability of their farm. Therefore, upgrading the usual tomato production system is imperative to bring changes in production processes (cultivating improved variety, staking, pesticide application) to improve product quality. Cultivating improved tomato variety, staking and pesticide application are among the most important product upgrading techniques carried out by farmers. To the best knowledge of the researcher, no studies to date have focused on factors driving agricultural producers’ participation decisions in product upgrading. Therefore the objective of this study was to assess determinants of smallholder tomato producers’ participation decision in product upgrading in Seka Chekorsa District, Jimma Zone, Oromia Region, Ethiopia ().
Figure 1. Conceptual framework.
2. Research methodology
2.1. Description of study area
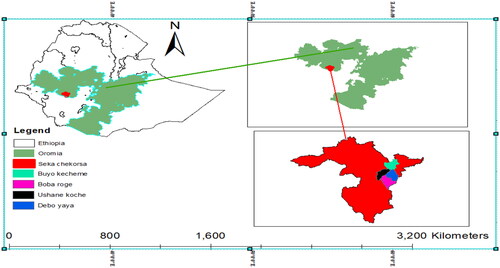
Seka Chekorsa is one of the Jimma zone districts in the Southwestern part of Jimma town, Oromia, Ethiopia. The district is located 364 km southwest of Addis Ababa, the capital city of Ethiopia, and 21 km from Jimma Zone. It is located at 07°35′N 36°33′E. The topography of this district ranges from gently sloping to hilly lands with ridges and valleys in between. The Gojeb River, which divides Seka Chekorsa from the Southern Nations, Nationalities, and Peoples Region, is on its southern boundary. Gera, Gomma, Mana, Kersa, and Dedo are on its western, northwestern, northern, northeastern, and eastern borders, respectively. The district’s altitude ranges from 1580 to 2560 m above sea level. The mean annual rainfall and temperature of the district range between 1633–1769 mm and 12.6–29.1 °C, respectively. The district is divided into two agro-ecological zones; Dega (highland) and Woina dega (mid land), accounting for 18 and 82% of the total land area, respectively (Seka Chekorsa District Agriculture and Environmental Protection Data, Citation2020).
Vegetables widely grown in this area are potato, tomato, cabbage, and red pepper, while major fruits grown in this area are avocado, orange, lemon, banana, mango, and papaya. Coffee, khat, and maze are important cash crops for this district. Tomato is one of the most essential irrigated vegetables in the Seka Chekorsa District of Jimma zone, Oromia. According to Seka Chekorsa District Office of Agriculture (Citation2021) report, tomato is the third largest irrigated vegetable in the district, following cabbage and potato ().
Figure 2. Map of the study area.
Source: Adopted and manipulated from Ethiopian map.
2.2. Types, sources, and method of data collection
Both quantitative and qualitative data were collected from primary and secondary data sources to deal with the study objective. Primary data was collected directly from sample respondents of tomato producers.
A questionnaire was developed and pre-tested before data collection and enumerators were given training on the data collection. Data related to demographic, socioeconomic, and institutional characteristics of sampled respondents were gathered through a semi-structured interview schedule to achieve the study objective. Four focus group discussions were carried out to gather in-depth qualitative data regarding tomato production and marketing from a selected group of tomato producers. Moreover, a key informant interview schedule was employed to gather in-depth qualitative data from chosen tomato production and marketing professionals (extension agents, district agricultural experts, trade office experts, and JiCA and SNV). Personal observation was also used to observe the overview of tomato upgrading practices in the study area. Furthermore, to collect secondary data different materials including published and unpublished materials, articles, websites, related literatures, and government and non-government organizational reports were reviewed to support primary data.
2.3. Sampling procedure and sample size determination
Two-stage sampling procedure was used to select tomato producer sample respondents. As per consultation with the agricultural and developmental agents of Seka Chekorsa districts, from a total of 34 rural kebeles in the district, 21 were tomato producers. In the first stage, four kebeles were selected randomly from tomato-producing kebeles (small administrative unit) hence, those tomato producer kebeles are almost homogenous in agroecology and they are potential producers. The sample size of tomato producers was determined by using the Yamane formula. Yamane (Citation1967) developed the following equation to yield a representative sample for proportions.
Where n = sample size; N = population size of tomato producers in four kebeles; e = desired level of precision, which is 7%. Depending on the information obtained through consultation with developmental agents of sampled kebeles, the total household size who are producing tomato from four kebeles was 689.
In the second stage, from each sampled kebeles, tomato producers were selected based on probability proportional to the size sampling technique (). Then the predetermined size of the sample producers from each kebele was randomly selected using a simple random sampling technique.
Table 1. Proportional distribution of sample households in each kebele.
2.4. Method of data analyses
Both descriptive statistics and econometric analyses were used to analyse the data obtained from sampled respondents. Excel, SPSS version 20.0, and Stata version 14.0 software were used to enter and analyse data.
2.4.1. Descriptive analyses
Descriptive statistics, including mean, percentage, frequency, and standard deviation, were used to examine the demographic, socio-economic, and institutional characteristics of sampled producers. To test the significant difference in the explanatory variables between participants and non-participants of product upgrading, inferential statistics, such as the chi-square test and t-test were employed.
2.4.2. Econometric analyses
2.4.2.1. Multivariate probit model
To analyse the influence of explanatory variables on different product upgrading techniques a multivariate probit model was employed. The model was preferred to probit model since relying on univariate modelling (probit model) for such analysis leaves out useful information regarding the interdependency of the strategies and failure to capture this interdependence may lead to bias and inefficient coefficient estimates (Kassie et al., Citation2010). Dorfman (Citation1996) also stated that univariate modelling excludes useful economic information about interdependent and simultaneous adoption technologies. However, the multivariate probit model considers the interdependencies and simultaneous choice decisions of various strategies (staking, pesticide application, adoption of improved variety). Therefore, a separate model (probit model) for each strategy was not used to estimate the influence of explanatory variables on each strategy. The model was preferred to the multinomial logit model because the multinomial logit model assumes independence or mutual exclusiveness of dependent variables in which the inclusion of one variable precludes the other. In case, tomato producers participated in one or more upgrading techniques (staking, pesticide application, adoption of improved variety) simultaneously. When the expected profit is positive, tomato producers can participate in product upgrading techniques. This predicted profit can be expressed in terms of utility. So, the decision to participate in upgrading techniques comes when the utility () associated with the participation in upgrading techniques is greater than the utility (UNPi) associated with the non-participation that is
.
Djibo and Maman (Citation2019) specified the Multivariate probit model in their study as follows. The probability that the household i participated in the product upgrading technique of j is:
(1)
(1)
When ϕ is the probability density function of the multivariate normal distribution and Σ is the variance matrix-covariance.
The probability of tomato producer’s participation in upgrading activities according to the distribution function is:
(2)
(2)
Household i participate in product upgrading practice of j; p () if and only if
> 0, where,
is utility derived from participating in j product upgrading activity. This can be expressed as follows:
(3)
(3)
: Latent (unobservable) level of utility the household i gets from j product upgrading technique. It is a function of observable explanatory variables, which is written as follows
Xij is a vector of the explanatory variable, βi is an unknown parameter to be estimated, εij disturbance term of j product upgrading technique.
In the multivariate probit model, where participation in different product upgrading practices is possible, the error terms jointly follow a multivariate normal distribution (MVN) with a mean of zero and variance-covariance matrix V has values of 1 on the leading diagonal and correlation ρjk = ρkj as off-diagonal element where (μy1, μy2, μy3) MVN ∼ (0, Ω) and the symmetric variance-covariance matrix Ω is given by
(4)
(4)
Off-diagonal elements in the variance-covariance matrix represent the unobserved correlation between the stochastic components of the different product upgrading practices. This specification with non-zero off-diagonal elements allows for correlation across error terms of several latent equations.
Therefore, the multivariate probit model is specified as:
Where, i, j = 1, 2, 3…….n
Yij is the probability of i tomato producer to participate in j product upgrading activity; are parameters to be estimated
is the vector of an explanatory variable. The regression coefficients of the MVP model cannot be interpreted like other models’ regression coefficients (Greene, Citation2002). Therefore, the marginal effects of each variable that give the magnitude of the marginal effects of change in the explanatory variables on the expected value of the dependent variable were computed using a conditional mixed process (cmp).
2.5. Hypothesis
2.5.1. Dependent variable
Participation decision in product upgrading: is a dummy dependent variable that takes a value of 1 if the household head participated in one or more product upgrading techniques and 0 otherwise.
Adoption of improved variety (Adimtom): is a dummy dependent variable that takes a value of 1 if the tomato producers planted an improved variety of tomato and 0 otherwise.
Tomato staking (staking): is a dummy dependent variable that takes a value of 1 if the tomato producers support tomato by staking tools to keep the fruit off the ground and 0 otherwise.
Pesticide application (Appest): is a dummy dependent variable that takes a value of 1 if the tomato producers applied pesticide and 0 otherwise ().
Table 2. Summary of hypothesis and variables relationship.
3. Results and discussion
3.1. Descriptive result
3.1.1. Comparison of demographic, socio-economic, and institutional characteristics of product upgrading participants and non-participants
As discussed earlier, in the context of this study tomato upgrading is a means of cultivating new variety of tomato or improving the quality of the old produce through keeping the fruit of tomato off ground (staking) and pesticide application. Adopting improved varieties is a vital means of improving the quality of produce thus meeting customer demands. The use of local and poor-quality seed varieties limits the quality of tomato, affecting the market price (Shafiwu, Citation2021). Moreover, the application of pesticides is a means to save crops through the control of disease and increase the quality and quantity of agricultural produce (Mutuku et al., Citation2014). On the other side, staking keeps fruits off the ground which reduces infections and decaying fruits which in turn improves the quality of the fruit and increases marketable yield (Lamptey & Koomson, Citation2021). Therefore, adopting improved tomato variety, tomato staking, and applying pesticides in which sampled households in the study area engaged were regarded as product upgrading techniques. In the study area, 75.3% of sampled households planted improved tomato varieties, while 24.7% reported that they did not adopt improved variety during the survey. Regarding pesticide application, of the households interviewed, 65.2% of sampled households used pesticides, while 34.8% did not apply. Moreover, out of the sampled households interviewed, only 39.9% staked tomato using locally available wood and rope, while most households (60.1%) did not keep tomato fruits off the ground through staking ().
Table 3. Household’s participation in product upgrading techniques.
Inferential statistics, including chi-square and two tail t-test were used to identify the variables that vary significantly between the participant and non-participant of product upgrading techniques. Accordingly, the results in show the relationship between the continuous variables and the respondents’ product upgrading participation categories at different probability levels.
Table 4. Comparison of socioeconomic characteristics of product upgrading participants and non-participants (for continuous explanatory variables).
3.1.1.1. Age
The total average age of the sample households was 42.5 years. The mean age of the improved seed adopters was 41.8 years and that of the non-adopters was 44.7 years. The result of the t-test indicated a statistically significant mean difference between the age of improved seed adopters and non-adopters at 1%. Likewise, the mean age of tomato staking participant and non-participant was 42.02 and 42.81 years, respectively and there was no significant mean difference between the two groups. Furthermore, the average age of pesticide application participant was 41.39 years, while that of non-participant was 44.56 years. The result of the t-test revealed a significant mean difference between the age of pesticide application participant and their counterpart non-participant. From these results, it is possible to conclude that adopters of product upgrading techniques were a bit younger than non-adopters indicating a negative relationship between age and adoption of product upgrading techniques.
3.1.1.2. Family size (Fsize) (adult equivalent)
Depending on Storck and Doppler (Citation1991), the total family size of sampled households was converted to adult equivalent by the conversion factor. The total average adult equivalent labour owned by sample households was 4.17 in number. On average, improved seed adopter sample respondents had a 4.2 family size, whereas non-adopter sample respondents had a 4.1 family size. The result of the t-test indicated no significant mean difference between adopters and non-adopters of improved seed. Similarly, the mean family size of tomato staking participant and non-participant was 4.4 and 4.02, respectively. Its t-test indicated a significant mean difference between adopters and non-adopters at a 5% significance level. The average family size of pesticide application participant and non-participant was 4.16 and 4.19, respectively, and there was no significant mean difference between the family sizes of the two groups.
3.1.1.3. Year of school (Yschool)
The total average education level of the sample households was 2.65 grades (schooling years). On average, improved seed adopters had greater formal education (2.97 grade) compared to non-adopters (1.7 grade). There was a significant mean difference between the education levels of adopters and non-adopters at a 1% significance level. In the case of staking, the mean year of school for participant was 3.02, and that of non-participant was 2.38. The result of the t-test showed a statistically significant mean difference between participant and non-participant at a 10% significance level. Pesticide application participants’ mean year of school was 2.87, and that of non-participant was 2.24. There was a significant mean difference between a year of education of participant and non-participant of pesticide application at a 10% significance level.
3.1.1.4. Tropical livestock unit (TLU)
The total average of the household’s tropical livestock unit was 6.04 TLU. On average, improved tomato adopters had larger TLU (6.3) compared to non-adopter’s (5.4). The t-test revealed that there was a statistically significant mean difference between the two groups at 5%. The average TLU of tomato staking participant and non-participant were 6.2 and 5.9, respectively, with no significant mean difference. Moreover, pesticide application participant and non-participant had an average of 6.1 and 5.9 TLU, respectively, with no significant mean difference.
3.1.1.5. Market distance (Mrktdis)
Market distance is the other most important factor determining farmers’ regular trips to purchase farm inputs and sell their farm outputs to markets. Non-adopters of improved seed travelled on average 1.02 walking hours to the nearest market (Seka) while adopters travelled 0.83 walking hours with a statistically significant mean difference among the groups at a 1% significance level. The mean distance to the nearest market for households who applied pesticides was 0.83 walking hours compared to those who did not apply (0.97). There was a significant mean difference among groups at 1% significance.
3.1.1.6. Farming experience (Fexp)
Tomato farming experience is a critical factor that enhances farmers’ knowledge and skill in tomato farming practices. The total average farming experience of the sample households was 6.51 years. On average, improved seed adopters had 6.73 years of tomato farming experience. In comparison, non-adopters had 5.9 years of tomato farming experience and there is a significant mean difference among groups at a 1% significance level. Likewise, households who participated in tomato staking had an average of 7.09 years of farming experience, whereas non-participants had 6.17 years, with a significant mean difference between tomato farming experience of the groups at a 1% level of significance. The average tomato farming experience of pesticide application participant and non-participant was 6.72 and 6.2, respectively, with a statistically significant mean difference between participant and non-participant at 10%.
3.1.1.7. Sex
The result of this study shows that from sampled households who adopted improved seed, 11%, and from the non-adopter, 25.6% were female-headed households, while from adopter sample households, 89% and non-adopter sample respondents, 74.4% were male-headed. The chi-square test indicates a statistically significant difference in the sex of the household head among the adopter and non-adopter at a 5% level (). Concerning pesticide application, 14.6% of participant and 14.6% of non-participant were female-headed while 85.4% of participant and 85.4% of non-participant were male-headed with no significant difference in the sex of household heads among the two groups. Furthermore, 9.5% of tomato staking participant and 17.9% of non-participant were female-headed, while 90.5% participant and 82.1% of non-participant were male-headed. There was no statistically significant difference in the sex of household heads among tomato staking participant and non-participant.
Table 5. Comparison in demographic and institutional characteristics of product upgrading participant and non-participant (for dummy variables).
3.1.1.8. Off-farm activity (Offarm)
The result of this study indicates that 47.9% of improved seed adopters and 43.6% of non-adopter did not participated in any off-farm activity. In comparison, 52.1% of adopters and 56.4% of non-adopters participated in off-farm activity. In addition, 47.6% of pesticide application participant and 45.5% of non-participant reported that they did not engaged in off-farm activity, while 52.4% of the participant and 54.5% of non-participant participated in off-farm activity. Furthermore, 46% of tomato staking participants and 47% of non-participants did not engaged in off-farm activity, whereas 54% of participants and 52.6% of non-participants engaged in off-farm activity. The chi-square test result shows no significant difference in off-farm activity participation among adopters and non-adopter of the three upgrading techniques.
3.1.1.9. Access to training (Acctrain)
Training is a critical factor that develops and improves agricultural farmers’ knowledge and skills in producing and marketing their output. The result of this study indicates that among adopters of improved seed, 58.8%, and non-adopters, 82.1% did not get training services, while among adopters, 41.2% and non-adopter, 17.9% reported that they got training services. Concerning pesticide application, among participant, 56.3% and non-participant, 80% did not get training services. On the contrary, 43.7% of participants and 20% of non-participants received training services. Likewise, 46% of sampled households who participated in staking and 76.8% of non-participants did not get training, while 54% of participants and 23.2% of non-participants got training services. For the three product upgrading techniques, the chi-square test shows a significant difference in access to training among participants and non-participants. Therefore, training plays a critical role in enhancing and facilitating the participation of households in product upgrading techniques.
3.1.1.10. Access to market information (Accmrkt)
Access to market information (Accmrkt) is another critical institutional service that facilitates the participation of producers in product upgrading techniques. As indicated in % of improved seed adopters and 35.9% of non-adopter did not obtain any market information, while 95% of the adopters and 64.1% of non-adopters obtained market information. Likewise, 5.8% of pesticide application participants and 25.5% of non-participants did not receive market information, while 94.2% of participants and 74.5% of non-participants received market information during the survey. The chi-square test result revealed a significant difference in access to market information among adopters and non-adopters of improved seed and pesticide application at 1 and 10% significance levels, respectively. However, those households obtained market information from the district market, where they received low market returns.
3.1.1.11. Access to extension service (Accext)
The result of this study indicates that 28.6% of improved seed adopters and 43.6% of non-adopter did not get extension services. In comparison, 71.4% of adopters and 56.4% of non-adopters have got extension services. The chi-square test results show a significant difference in access to extension services among adopters and non-adopters of improved seed at 10% significance level. In addition, 28.2% of participants of pesticide applications and 40% of non-participants reported that they did not get extension services, while 71.8% of the participants and 60% of non-participants have got extension services. The chi-square test result shows no significant difference in access to extension services among participants and non-participants of pesticide application. Furthermore, 20.6% of tomato staking participants and 40% of non-participants did not get extension services, whereas 79.4% of participants and 60% of non-participants got extension services. The chi-square test result shows a significant difference in access to extension services among the two groups at 5% significance level.
3.1.1.12. Access to credit (Acccred)
The use of credit help producers purchase improved seed and pesticide to improve the quality of their products thereby, upgrade their products. In this study, 54.6% of improved tomato seed adopters and 87.2% of non-adopters did not use credit, while 45.4% of adopters and 12.8% of non-adopters used credit. The chi-square test result shows a significant credit access difference among adopters and non-adopters at a 1% significance level.
Likewise, in product upgrading of pesticide applications, 60.2% of participant and 67.3% of non-participants reported that they did not use credit. In comparison, 39.8% of participant and 32.7% of non-participants used credit, with no significant difference in access to credit among participants and non-participants of pesticide application.
3.1.1.13. Availability of seed (Accseed)
Availability of seed (Accseed) is among the prime factor that induces the adoption of improved variety as a product upgrading technique. The result of this study revealed that 8.4% of the adopter of improved seed and 76.9% of non-adopters reported that improved tomato seed was not available, and 91.6% of adopters and 23.2% of non-adopters responded that improved seed was available during the survey. The chi-square test results show a significant difference in the availability of seeds among adopters and non-adopters at a 1% significance level.
3.1.1.14. Availability of pesticides (Accpest)
The result of this study revealed that 11.7% of households who applied pesticides and 14.5% who did not use were not available with pesticides, whereas 88.3% of participants and 85.5% of non-participants were aware of pesticides availability. The chi2-test shows no significant difference in the availability of pesticides among participants and non-participants.
3.1.2. Tomato production in the study area
Tomato is a well-known vegetable produced in the study area despite the land allocated for the product per household being small. The survey result indicated that the average land allocated for tomato production and the average yield per ha in the study area was 0.18 ha and 47.9 quintals, respectively. Having access to agricultural input helps tomato producers cultivate market-oriented products and increase yield. Acquiring an improved variety assists tomato producers in upgrading the usual local type to market demand, thereby obtaining a premium for their produce.
Regarding tomato variety cultivated in the study area, most of the sampled households (53.2%) used the Roma VF variety, while 24.7, 17.1, and 5.1% of respondents sowed/planted Local, Golden, and Galilea varieties, respectively (). The other most important thing to consider is the seed source, which determines the quality, price, and reliability of supply. In the study area, 41.1% of sampled households sourced tomato seed from private seed suppliers (from Jimma town). In comparison, 22.2, 20.9, 10.8, and 5.1% reported that they obtained from the local market (Seka market), district OoARD, their own farm, and NGOs, respectively. Those who adopted improved variety (Galilea, Golden, and Roma VF) reported that the major reasons for cultivating improved tomato were high market price due to attractive colour and size, long shelf life, higher yields, and disease resistance. Accordingly, most households (31%) reported that they cultivate improved variety because of its high market price. In comparison, 26.8 and 23% of sampled households raised long durability and higher yield of improved variety compared to local variety as a motivator of adoption, respectively. The left (19.2%) of sampled producers reported that they cultivated improved tomato due to its disease resistance ().
Table 6. Tomato variety adopted and their sources.
Table 7. Factors in favour of adopting improved seed.
Regarding the combination of product upgrading techniques in which sampled households participated, 39.2% of sampled households were involved in ‘staking & adopting improved tomato’ jointly whereas 29.1% of them participated in ‘staking & pesticide application’ simultaneously. At the same time the proportion of sampled households participated in the combination of ‘adoption of improved tomato and pesticide application’ was 52.5% while 29.1% of households participated in ‘staking, adoption of improved tomato & pesticide application’ product upgrading combinations ().
Table 8. Sampled households’ participation in product upgrading combination.
3.2. Factors affecting smallholder farmer participation decision in product upgrading
As discussed earlier, product upgrading involves developing a new product or improving the old product faster than rivalry to increase the quality of produce. Therefore, a multivariate probit model was employed to show explanatory variables’ influence on tomato producers’ participation decisions in product upgrading techniques.
Wald chi-square statistic was used to test the overall significance of variables. As indicated in , the Wald chi2 (35) = 100.73 is strongly significant at a 1% significant level, which implies that the explanatory power of the factors included in the model is satisfactory. The simulated maximum likelihood ratio test [LR chi2 (3) = 9.23 (Prob > chi2 = 0.027] of the null hypothesis of independence between the product upgrading practices (rho21 = rho31 = rho32 = 0) is significant at a 5% significant level. Therefore, the null hypothesis that all the ρ (Rho) values are jointly equal to 0 is rejected, indicating the model’s goodness-of-fit. The decisions to participate in different product upgrading techniques were interdependent, thus, supporting the use of MVP over the individual probit model.
Table 9. Overall fitness, probabilities and correlation matrix of the product upgrading techniques from the MVP model.
The maximum simulation likelihood (SML) estimation result indicates the marginal success probability of each product upgrading technique. Accordingly, the likelihood of adopting improved tomato variety (76%) was relatively high as compared to the likelihood of producer’s participation in pesticide application (65.4%) and tomato staking (39.5%). Concerning the joint probabilities of success and failure of product upgrading decisions, households were more likely to jointly participate in product upgrading practices. The likelihood of households engaging jointly in product upgrading practices is 27% compared to the probability of not together participating in product upgrading techniques (11%).
The ρ values (ρij) indicate the degree of correlation between disturbance terms of each pair of dependent variables. The correlation between the participation decision of households in tomato staking and adopting improved tomato variety (ρ21) is positive and significant at 1%. From this finding, it is possible to conclude those who adopt improved variety are more likely to participate in tomato staking. The ρ31 value indicates that the application of pesticides and keeping tomato fruit off the ground by staking are negatively correlated. The possible explanation is that as farmers kept tomato fruit off the ground, it is less exposed to fruit rot, which reduces pesticide application to prevent the disease. Likewise, the application of pesticides and adoption of improved seed (ρ32) are positively correlated, indicating households who adopt improved variety are more likely to apply pesticides. This might be due to the intensive management requirement of the adopted variety.
As indicated in , the result of the MVP model revealed that out of the total explanatory variables included in the model, some were statistically significant at more than one. At the same time, some of them were significant in one product upgrading practice.
Table 10. Multivariate probit estimations for determinants of producer’s participation decision in product upgrading techniques.
3.2.1. Age
The age of the household head was found to have negative and significant effects on the probability of the household’s participation in tomato staking and pesticide application at a 10% significance level. From this result, it is possible to conclude that as the farmer’s age increases, the likelihood of household participation in staking and pesticide application decreases. As the age of household head increase by 1 year, the probability of household participation in tomato staking and pesticide application decreases by 1.4 and 1.5%, respectively keeping other variables constant. A plausible explanation for this finding is that staking and pesticide application requires physical labour, making it easier for younger farmers to adopt. Younger farmers might also be able to learn and adjust the benefits of the product upgrading initiatives more quickly. The findings of Hasan (Citation2017) revealed that the age of the farmer has a significant and negative impact on the adoption of nets in cabbages and pesticide application in tomato. The author stated that the number of pesticide applications, being a physically intensive activity, decreases as household heads age increases.
3.2.2. Family size (Fsize)
The likelihood of household participation in tomato staking was significantly and positively influenced by family size at a 5% significance level. This implies that households with large family sizes (adult-equivalent) are more likely to participate in tomato staking than those households with relatively fewer family members. Hence, staking is labour intensive activity, and the likelihood of adopting the practice is high with the availability of more family members. The marginal effect of family size indicates that the probability of households’ participation increases by 9.6% as family size in a given household increases by an adult equivalent. Therefore, a large family size is considered an opportunity when there is high labour competition among other farming activities. The result is contrary to Hasan (Citation2017), who found a negative and significant influence of family size on tomato staking.
3.2.3. Year of school (Yschool)
The education level of the household head was found to have a positive and significant influence on the likelihood of adopting improved tomato variety as a product upgrading technique at a 5% significance level. As a year of school of household head increases, their probability of adopting an improved type also increases. An increase in household head year of education by a unit of formal schooling increases the likelihood of adopting improved tomato variety by 2.5%. This implies that more educated farmers are more likely to adopt improved tomato varieties than uneducated farmers because educated farmers can collect information on new technologies more than uneducated farmers. The result is consistent with the findings of Bati and Aman (Citation2017), Feleke et al. (Citation2019), and Nonvide (Citation2020) who found a positive and significant influence of education on the adoption of improved potato, rice, and potato varieties, respectively.
3.2.4. Market distance (Mrktdis)
The likelihood of pesticide application was negatively and significantly affected by market distance at a 5% significance level. The marginal effect of market distance revealed that the likelihood of farmer’s participation in pesticide application decreases by 33.8% as the household resident far away from the nearest market by one walking hour. This implies that households nearest to the market were more likely to adopt pesticide application as a product upgrading technique than those far from the market. The plausible explanation is that farmers are market dependent to source agricultural inputs like pesticides. Hasan (Citation2017) founds a negative and significant influence of market distance on the probability of pesticide application.
3.2.5. Farming experience (Fexp)
The likelihood of household participation in tomato staking, improved tomato variety adoption, and pesticide application were positively and significantly affected by the tomato farming experience of farmers at a 10% significance level. As the household heads’ farming experience increases by one year, the probability of household participation in tomato staking, adopting improved tomato variety, and pesticide application increases by 3.9, 2.7, and 3.9%, respectively. This result implies that more experienced tomato producers are more likely to adopt product upgrading techniques than less experienced farmers. This is because highly experienced farmers are likely to have more information and knowledge on tomato production technologies and management practices. Consequently, the years spent in tomato farming increase the likelihood of adopting product upgrading techniques. This result is in line with Danso-Abbeam and Baiyegunhi (Citation2018) and Rahman and Chima (Citation2018). They found a positive and significant effect of farming experience on adopting improved seed and pesticide application, respectively.
3.2.6. Access to training (Acctrain)
The variable was found to have a positive and significant effect on the probability of household participation in tomato staking and pesticide application at 1 and 10% significance levels, respectively. This implies that farmers who had been offered training on tomato production are more likely to adopt tomato staking and pesticide application as product upgrading techniques compared to those who had not got the service. The marginal effect of access to training implied that the probability of household’s participation in tomato staking and pesticide application increases by 23.9 and 14.1%, respectively, as household head has access to training services. The probable explanation for the result is that farmers who were given training can develop their knowledge and skills toward adopting better practices. The study by Feleke et al. (Citation2019) and Gairhe et al. (Citation2017) revealed that access to training positively and significantly influenced the adoption of improved potato variety. Knaresboro (Citation2019) stated that access to training positively and significantly influenced the likelihood of integrated pest management adoption. However, Kinuthia (Citation2019) found a negative and significant influence of access to training on the likelihood of fungicide application on tomato in Kenya.
3.2.7. Access to market information (Accmrkt)
The likelihood of adopting improved tomato variety and pesticide application was positively and significantly affected by access to market information at 1 and 10% significance levels, respectively. This implies that households who had market information are more likely to adopt improved seed and pesticide applications compared to those who had not get the service. As household head has access to market information the probability of adopting improved tomato variety and participation in pesticide application increases by 18.9 and 27.2%, respectively. This is in line with Ahmed et al. (Citation2017), who found a positive and significant influence of access to market information on the likelihood of improved maize seed adoption. Obtaining accurate market information about farm inputs is crucial as it enables farmers to get production resources like improved seeds and pesticides of the correct quantity and quality. Likewise, as household head had market information concerning the market requirement of their product, they were more likely to upgrade their product to market demand.
3.2.8. Seed availability (Accseed)
The probability of improved tomato variety adoption was positively and significantly affected by the availability of improved seed at a 1% significance level. The result implies that improved tomato seeds readily available in the market enhance the likelihood of farmers’ adoption. The marginal effect of improved seed availability revealed that the probability of adopting improved tomato variety increases by 24.3% as household heads have access to improved seed. Adunea and Fekadu (Citation2019) revealed that the provision of improved wheat seed to farmers in the required quantity and at the right time increases the probability of adoption of wheat row planting. Danso-Abbeam et al. (Citation2017) found positive but insignificant effects of seed availability on the likelihood of improved seed adoption.
3.2.9. Pesticide availability (Accpest)
The probability of pesticide application was positively and significantly affected by the availability of pesticides at a 5% significance level. This indicates that tomato producers are more likely to apply pesticides when the required pesticide is available at the right time and place in the market. It means households that are aware of the availability of pesticides were more likely to adopt pesticide application as a product upgrading technique compared to those who are not aware of the availability of pesticides. As household heads are aware of the availability of the required pesticides the probability of their participation in pesticide application increases by 34.3%. The result is in line with Khan and Damalas (Citation2015) who stated that the easy availability of pesticides encourages farmers to utilize pesticides.
4. Conclusion and recommendation
Tomato is the most crucial vegetable contributing to human diet, economic development, and poverty reduction. Concerning the joint probabilities of success and failure of product upgrading techniques, sampled households were more likely to adopt the three product upgrading techniques jointly. The result of MVP model indicated that family size, year of school, farming experience, access to training, access to market information, access to seed, and access to pesticide positively and significantly affected product upgrading techniques as a prior expectation in hypothesis. In contrast, market distance and age of household heads were found to have a negative and significant influence on product upgrading techniques. It is concluded that different socioeconomic and institutional factors play a critical role in the participation of households in product upgrading thus, improving the position of those marginalized smallholder tomato producers in tomato value chain. Tomato farming experience was found to affect product upgrading techniques positively and significantly. Therefore, development agents, local leaders, and other participants should create room for experience sharing among farmers regarding the importance of product upgrading. Training on tomato production positively and significantly influenced staking and pesticide application of product upgrading techniques. Therefore, to promote adopting these practices as product upgrading techniques, there is a need to capacitate farmers on technology utilization through the provision of training and strengthening the existing extension services. JiCA and SNV offered detailed training for a few tomato producers on various tomato cultivation practices and marketing in the study area. Therefore, it is highly recommended to expand the accessibility of the service for large tomato producers as much as possible. The availability of improved seeds and pesticides strongly affected product upgrading techniques. Therefore, the existing improved tomato seed and pesticide supplier institutions at the zonal/district level should strengthen the delivery system and distribute on time with the required quantity and quality. So the district office of agriculture, research centres, and agricultural transformation agency are the primary institutions responsible.
Author contributions
The authors contributed their time to data collection, data editing and analysis, and writing.
Acknowledgements
We would like to thank Seka Chekorsa agricultural experts and respondents for their contribution during data collection.
Disclosure statement
No potential conflict of interest was reported by the author(s).
Additional information
Funding
Notes on contributors
Zalalam Lule
Zalalam Lule is a lecturer and researcher at Wolkite University, Faculty of Agriculture and Natural Resource, Department of Agribusiness and value chain management. He received his BSc degree in Agribusiness and value chain management from Debre Markos University and MSc degree in Agribusiness and value chain management from Jimma University. His research focuses on agricultural value chain analysis, value addition, and consumer preferences and commercialization related issues.
Mekdelawit Yeshitila
Mekdelawit Yeshitila (Ph.D.) is a lecturer and researcher at Jimma university Department of Agricultural Economics and Agribusiness management. Her main research interest are on contract farming and technical efficiency of agricultural production.
Mulubrihan Bayissa
Mulubrihan Bayissa (Ph.D. Scholar) is a lecturer and researcher at Jimma university Department of Agricultural Economics and Agribusiness management. His main research interest is on production efficiency and market chain analysis of beekeeping.
References
- Abera, G., Ibrahim, A. M., Forsido, S. F., & Kuyu, C. G. (2020). Assessment on post-harvest losses of tomato (Lycopersicon esculentem Mill.) in selected districts of East Shewa Zone of Ethiopia using a commodity system analysis methodology. Heliyon, 6(4), e03749. https://doi.org/10.1016/j.heliyon.2020.e03749
- Adeyonu, A., Ajala, A., Adigun, G., Ajiboye, B., & Gbotosho, O. (2017). Determinants of sweet potato value addition among smallholder farming households in Kwara State, Nigeria. Agro-Science, 15(1), 17–22. https://doi.org/10.4314/as.v15i1.4
- Adunea, D., & Fekadu, B. T. (2019). Adoption determinants of row planting for wheat production in Munesa District of Oromia Region, Ethiopia. Journal of Agricultural Extension and Rural Development, 11(2), 25–34. https://doi.org/10.5897/JAERD2018.0993
- Ahmed, M. H., Geleta, K. M., Tazeze, A., Mesfin, H. M., & Tilahun, E. A. (2017). Cropping systems diversification, improved seed, manure and inorganic fertilizer adoption by maize producers of eastern Ethiopia. Journal of Economic Structures, 6, 1–16.
- Alwang, J., Barrera, V., Andrango, G., Dominguez, J., Martinez, A., Escudero, L., & Montufar, C. (2019). Value-chains in the Andes: Upgrading for Ecuador’s blackberry producers. Journal of Agricultural Economics, 70(3), 705–730. https://doi.org/10.1111/1477-9552.12329
- Arun, G., & Ghimire, K. (2017). Determinants of pesticide application in Nepalese vegetable farming: An empirical analysis using multivariate probit model.
- Bati, B., & Aman, M. (2017). Determinants of adoption of improved potato varieties by smallholder farmers in Shashemene District, West Arsi Zone, Oromia National Regional State, Ethiopia. Haramaya University.
- Brasesco, F., Asgedom, D., & Casari, G. (2019). Strategic analysis and intervention plan for fresh and industrial tomato in the Agro-Commodities Procurement Zone of the Pilot Integrated Agro-Industrial Park in Central-Eastern Oromia, Ethiopia. FAO.
- Christos, A. D. (2009). Understanding benefits and risks of pesticide use. Scientific Research Essays, 4, 945–949.
- Cuddeford, V. (2014). Introduction to agricultural value chains.
- Danso-Abbeam, G., & Baiyegunhi, L. J. (2018). Welfare impact of pesticides management practices among smallholder cocoa farmers in Ghana. Technology in Society, 54, 10–19. https://doi.org/10.1016/j.techsoc.2018.01.011
- Danso-Abbeam, G., Bosiako, J. A., Ehiakpor, D. S., & Mabe, F. N. (2017). Adoption of improved maize variety among farm households in the northern region of Ghana. Cogent Economics & Finance, 5(1), 1416896. https://doi.org/10.1080/23322039.2017.1416896
- Djibo, O., & Maman, N. M. (2019). Determinants of agricultural technology adoption: Farm household’s evidence from Niger. Journal of Development and Agricultural Economics, 11(1), 15–23.
- Dorfman, J. H. (1996). Modeling multiple adoption decisions in a joint framework. American Journal of Agricultural Economics, 78(3), 547–557. https://doi.org/10.2307/1243273
- Doti, A. G. (2018). Determinants of dairy value chain upgrading by smallholder farmers in central Ethiopia. Journal of Dairy Food Sciences, 13, 9–17.
- FAOSTAT (2019). Food and Agriculture Organization of the United Nations-Statistic Division. https://www.fao.org/faostat/en/#data.QC
- Feleke, A., Regasa, G., & Muche, M. (2019). Factors influencing adoption of improved potato (Belete) variety: Evidence from Ethiopian smallholder farmers.
- Gairhe, S., Gauchan, D., & Timsina, K. (2017). Adoption of improved potato varieties in Nepal. Journal of Nepal Agricultural Research Council, 3, 38–44. https://doi.org/10.3126/jnarc.v3i1.17274
- Greene, W. H. (2002). Econometric analysis. New York University.
- Hasan, S. (2017). Factors affecting integrated pest management adoption and pesticide use in Kenyan vegetable farmers. Virginia Tech.
- Jimma Zone Agricultural and Rural Development Office (2022). Annual report.
- Kassie, M., Zikhali, P., Pender, J., & Köhlin, G. J. (2010). The economics of sustainable land management practices in the Ethiopian highlands. Journal of Agricultural Economics, 61(3), 605–627. https://doi.org/10.1111/j.1477-9552.2010.00263.x
- Khan, M., & Damalas, C. A. (2015). Factors preventing the adoption of alternatives to chemical pest control among Pakistani cotton farmers. International Journal of Pest Management, 61(1), 9–16. https://doi.org/10.1080/09670874.2014.984257
- Kinuthia, C. W. (2019). Determinants of pesticide use and uptake of alternative pest control methods among small scale tomato farmers in Nakuru County, Kenya. Egerton University.
- Knaresboro, L. M. (2019). Adoption determinants and impacts of Tuta Absoluta integrated pest management for Nepali tomato farmers. Virginia Tech.
- Lamptey, S., & Koomson, E. (2021). The Role of staking and pruning methods on yield and profitability of tomato (Solanum lycopersicum L.) production in the Guinea Savanna Zone of Ghana. Advances in Agriculture, 2021, 1–7. https://doi.org/10.1155/2021/5570567
- Mergia, M. T., Weldemariam, E. D., Eklo, O. M., & Yimer, G. T. (2021). Small-scale farmer pesticide knowledge and practice and impacts on the environment and human health in Ethiopia. Journal of Health Pollution, 11, 210607.
- Molla, E., Hailekirstos, E., Mengstie, M., & Zenebe, T. (2022). Determinants of wheat value chain in case of North Shewa Zone of Amhara region, Ethiopia. Journal of Cogent Economics & Finance, 10(1), 2014639. https://doi.org/10.1080/23322039.2021.2014639
- Mutuku, M., Njogu, P., & Nyagah, G. (2014). Assessment of pesticide use and application practices in tomato based Agrosystems in Kaliluni sub location, Kathiani District, Kenya. Journal of Agriculture, Science Technology in Society, 16, 34–44.
- Nnanna Mba, A., Anyanwu, C. I., & Kalu, U. H. (2015). Factors influencing cassava value addition by rural agribusiness entrepreneurs in Abia State, Nigeria. Crops, 15(3).
- Nonvide, G. M. A. (2020). Identification of factors affecting adoption of improved rice varieties among smallholder farmers in the municipality of Malanville, Benin. Journal of Agricultural Science Technology in Society, 22, 305–316.
- Rahman, S., & Chima, C. D. (2018). Determinants of pesticide use in food crop production in Southeastern Nigeria. Agriculture, 8(3), 35. https://doi.org/10.3390/agriculture8030035
- Regassa, D., Tigre, W., & Shiferaw, A. (2016). Tomato (Lycopersicon esculentum Mill.) varieties evaluation in Borana Zone, Yabello District, Southern Ethiopia. Journal of Plant Breeding Crop Science, 8, 206–210.
- Seka Chekorsa District Agriculture and Environmental Protection Data (2020).
- Seka Chekorsa District Office of Agriculture (2021). Annual report.
- Shafiwu, A. B. (2021). Improved tomato (Lycopersicon esculentum) seed variety adoption, efficiency and welfare of farmers in selected agro-ecological zones of Ghana.
- Sowley, E., & Damba, Y. (2013). Influence of staking and pruning on growth and yield of tomato in the Guinea Savannah Zone of Ghana. International Journal of Scientific Technology Research, 2, 103–107.
- Storck, H., & Doppler, W. (1991). Farming systems and farm management practices of smallholders in the Hararghe Highlands. Wissenschaftsverlag Vauk Kiel.
- Tegegne, A. (2017). Value chain analysis of milk and effectiveness of LIVES project intervention towards milk value chain. In Case of Dessie Zuria District, South Wollo zone of Amhara Regional State of Ethiopia. Jimma University.
- Yamane, T. (1967). Statistics, An Introductory Analysis (2nd ed.). New York: Harper and Row.
Appendix A
I. General information
District: Seka Chekorsa kebele ___________
Questionnaire number: ___________________________________
Name of Enumerator: _____________________________________
Telephone: _____________________________________________
Date _____/ ____/2022 G.C
II. Demographic characteristics of the producers
Name of household head ___________________, phone number___________________
Sex 1. Male 2. Female
Age of household head ___________________ (years)
Total number of family member’s ______. 1. Blow 7 years (M/F) ___ 2.7–14 years (M/F) _____ 3. 15–64years (male ___ female___) 4.Above 64 years (M/F) ________
Year of schooling ________ grade.
Distance of your residence from the nearest market centre _____walking time (h).
Distance to all weather road _______ walking time (h)
Distance to the nearest agricultural extension office _________ walking time (h)
III. Household livestock holding
Livestock assets of the household
Is your family member adequate for farm activities? 1. Yes 2. No
Is supply of labour a problem during production 2022? 1. Yes 2. No
If your answer is yes for the above question, what is the reason ______
What is the source of labour for tomato production and their numbers? 1. Family labour__ 2. Hired labour__ (___birr/day) 3. Labour exchange 4. Cooperation 5. Others (specify) ____
In total how many labours did you use for your tomato production? _____
If you hired a labour how many are they and how much you paid per labour? _______
For what purpose did you hire labour? ____
IV. Tomato production and input used
How long have you engaged in tomato production? _____
Is there any improved seed available in the nearest market? 1. Yes 2. No
Have you ever used any type of improved variety of tomato seed? 1. Yes 2. No
If your answer for Q.3 is yes what types of improved seed did you used? 1. Roma VF (koshoro) 2. Galilea 3. Golden 4. Others _____________
What was the cost of improved seed? ________
If yes for Q.3, Did you have information on the importance of improved variety before you plant it? 1. Yes 2. No
If yes for Q.6, what types of awareness did you have? 1. High productivity 2. Disease resistance 3. Less perishable 4. High sensory quality 5. Others (specify) ____
If yes for Q.3 did you get any benefits from adopting improved variety of tomato? 1. Yes 2. No
If yes for Q.8 what benefits did you get related to the local one? 1. It offers high yield 2. It is highly disease resistance 3. Offer better price in market. 4. Have better shelf life 5. Others (specify) _____
If your answer for Q.3 is no, what is the reason behind? 1. Absence of improved seed nearby 2. High price of seed 3. Lack of awareness about improved seed 4. Long distance from the source 5.Others (specify) __________
Did you get enough yield from the tomato variety you currently grow? 1. Yes 2. No
If no for Q.11, what are the major reasons for low yield? 1. Poor quality seed 2. Disease/insect 3. Natural hazards 4. Low productivity 5. Others (specify) ________________
Is there any pesticides available in the nearest market to control spread of tomato disease and pest? 1. Yes 2.No
Input used for tomato production
Do you used staking tool to keep tomato fruit off the ground? 1. Yes 2. No
If yes for Q.15 what types of staking material you used? 1. Wooden 2. Metal 3. Plastic
If No for Q.15 why you didn’t use it? 1. Shortage of labour 2. Lack of staking material 3. Don’t know its importance 4. Others (specify) ___________
If yes for Q.15, did you observe any benefits? 1. Yes 2. No
If yes for Q.18, what benefits you observed? 1. It increases fruit yield 2.reduced fruit rot 3.make spraying and harvesting easy 4. Others (specify) ___________
Do you always get inputs at the right time? 1. Yes 2. No
If your answer for Q.20 is No, what are the reasons? 1. Unavailability 2. Far distance from the sources 3. Others (specify) ___________________
Do you always get inputs in the quantities that you need? 1. Yes 2. No
If your answer for Q.22 is No, why? (Multiple response is possible) 1. Not available 2.Too expensive 3.Not available on time 4. Cash shortage 5. Others (Specify) _____
Have you encountered problems in accessing these inputs? 1. Yes 2. No
If your answer for Q.24 is yes, what are the problems? (*Multiple response is possible)
1. Unavailability 2. Shortage of supply 3. Costly 4. Remoteness of input selling site 5. Others (specify) ___________
How did you solve these problems? __________
V. Production service
Access to credit
Do you have access to credit 1.Yes 2. No
Did you borrow money for tomato production before? 1. Yes 2. No
If yes, for Q.2 amount of loan _________________ interest ________________loan period___________ and loan date____________________
If yes for Q.3 for what purpose did you received? 1. Purchase of fertilizers 2. Purchase of improved seed 3.purchase of chemicals 4. Payment to hired labour 5. To perform post-harvest activities 6. Others (specify) ________
If your answer for Q.2 is yes, from where did you collect the credit? (*Multiple response is possible) 1. Micro finance 2. Cooperative/union (specify) _____ 3. NGOs (specify) ______ 4. Bank (specify) ____ 5. Traders 6.relatives 7. Iquib/idir 8.others (specify) ____
How did you solve these problems? ________________________
If no for Q.2 what was the reason? 1. Not available 2. High interest rates 3. Lack of collateral security 4. A lot of bureaucracy 5. Not need credit 6. Others (specify) _______
If your answer for Q.2 is yes, have you repaid the loan? 1. Yes 2. No
If your answer for Q.8 is No, what is the reason? __________________
Training service
Have you ever participated in tomato production system trainings? 1. Yes 2. No
If your answer for Q.1 is No, why? 1. No service providers 2. Low quality of training 3. Have no time to participate 4. Others (specify) ___________
If your answer for Q.1 is yes, on which aspects, by whom and for how long you have got the training? (Fill in the below table)
Was the training you get easily understandable and practicable? 1. Yes 2. No
Were you able to employ the new knowledge you acquired? 1. Yes 2. No
If your answer for Q.5 is yes, what? _______________________
If your answer for Q.5 is No, why? ______________________
Extension service
Did you have extension contact in relation to tomato production in the 2013/14 cropping season? 1. Yes 2. No
If your answer for Q.1 is No, why? (Multiple responses are possible) 1. No service provider nearby 2. Possessed the required information 3. Availability of contact farmers 4. Do not have time to get the service 5. Others_____
If yes for Q.1, how often the extension agent contacted you? 1. Weekly 2.twice a week 3. Once in two week 4.Monthly 5. Twice in the year 6. Any time I ask them 7.others _________
If yes for Q.1, what kind of extension service you get? (Multiple responses are possible) 1. Seed bed preparation 2. Fertilizer (compost) applications 3. Harvesting 4. Transplanting 5. Marketing of tomato 6. Post-harvest handling 7.Others (specify) ______
5) Who provides the advisory service? (Multiple responses are possible) 1. Development agents 2. NGOs (specify) 3. Woreda OoARD experts 4. Research centres (specify) ______________ 5. Neighbours and friends 6. Others (specify) _____
How do you get the advisory service? (Multiple response is possible) 1. Farm to farm visit by the development agent 2. Experience sharing tour 3. Visit to demonstration/ model farmers’ site 4. Training 5. Others (specify) ______________
Market information
Did you get marketing information in 2013/14? 1. Yes 2. No
If your answer for Q.1 is yes, from whom did you get the market information? 1. DAs 2. Fellow farmers 3. Woreda experts 4. Radio 5. Brokers 6. From market 7. Others (specify) ___
What type of information did you get? 1. Price information 2. Market place information 3. Buyers’ information 4.input market and pricing 5. Others (specify) ____________
At what time interval do you get the information? 1 Daily 2. Weekly 3. Monthly 4. Other (specify) ______
Was the information you get is valuable? 1. Yes 2. No
B. Checklist for focus group discussion
Participants: Producers of tomato in selected kebeles;
District: _____________________ Kebele _____________________
Problems related to inputs suppliers (availability/access, quality, and cost of inputs)?
Problems related to tomato production (post-harvest loss, irrigation, disease, extension service, credit access, irrigation facilities, market access)?
How these problems can be solved? ____________
What are the major problems in marketing of tomato? _________________
Who is responsible for the above problems? ___________________
What are barriers of product upgrading in tomato value chain?
How to solve these problems and who is responsible for it?
What factors affect your product quality?
How these problems can be solved?
C. Checklist for key informants interview
District seka chekorsa, Kebele _____________,
Date _____________ Name of interviewee _________ Name of the organization: _________
What are the threats for tomato extension service and input supply?
What are the most important constraining infrastructures affecting tomato production?
What are the possible solutions to correct these problems?
What is the role of Farmer Training Centres on tomato production? How?
What outputs are achieved on dissemination of tomato technologies?
What is the role of your organization in tomato value chain in the study area?
What are the challenges and opportunities you faced in undertaking those roles assigned to your organization? __