
Abstract
Web 2.0 networks have provoked a revolution in the last years due to their capacity to modify human relationships, particularly in business contexts. Social capital, as a crucial intangible asset embedded in Web 2.0 networks, can be extremely helpful to build and optimize personal and organizational performance. The study analysed the influence of web 2 adoptions on the organisational performance of MTN Ghana with perceived ease of use playing a moderating role. The study adopted a quantitative approach and explanatory research design. Data were collected via structured questionnaires from 367 conveniently sampled customers from the 16.2 million active subscribers who had successfully linked their Sim cards with their Ghana cards as of June 30, 2022. The study obtained a valid data set of 272 with a response rate of 74.1% which was then processed via IBM SPSS (v.26) and SmartPLS3 software. The study found that web 2 adoption comprising wikis, blogs, social networking sites, and file sharing has a significant positive effect on MTN’s overall performance. It was concluded that perceived ease of use plays a significant moderating role in the link between web 2 adoption and MTN-Ghana performance. The study, therefore, recommended that policy makers including the management of MTN-Ghana should continue to adopt and invest in its web 2 technologies in order to attain higher performance levels and become more competitive.
1. Introduction
Organisational performance has been immense to organisations especially business establishments since time immemorial (Nani & Safitri, Citation2021). Awan et al. (Citation2020) emphasised that any organisation would enjoy competitive advantages amid financial stability if it consistently meets or exceeds its overall performance targets given the fluctuating and highly competitive nature of modern business environments, firms, especially multinational ones, are consistently exploring innovative ways or strategies to exceed intended outputs in order to attain sustainable organisational performance (Sahibzada et al., Citation2020). Notable among these strategies include the adoption of web 2.0 technologies, simply known as web 2 (Saldanha & Krishnan, Citation2012; Caruso, Citation2018). Web 2 which focuses on a participatory social web is an upgrade on web 1, known as ‘the read-only web’ (Shuen, Citation2018). Given the speed at which technology is advancing and shaping our world, businesses have been forced to constantly be at par with it (Shuen, Citation2018). Precisely, advancements in technologies have given birth to web 2 and key stakeholders including customers are pressuring businesses to adopt and invest in them. Web 2 incorporates web browser innovations like JavaScript frameworks to allow users to easily access, sort, retrieve and classify free information about an event or a firm’s product and service (Singh et al., Citation2018). It employs developed Application Programming Interfaces (APIs) to provide dynamic contents that are responsive to user input and promote self-usage and other forms of interactions like file sharing, blogging, tagging, podcasting, social networking, and commenting (Pelet, Citation2020). Scholars have found common web 2 tools to include social networking sites (SNS), blogs, file sharing an dwikis (see, Kukowska & Skolik, Citation2020; Mariani, Citation2020).
The telecommunication industry comprises data and internet service providers that play valuable roles in the information society and mobile communication evolutions (Al-Mashraie et al., Citation2020). Effective information sharing via text messages, emails, streaming, and voice calls have all been necessitated by the industry; hence, considered the epicenter of innovation and economic growth. Ghana’s telecommunication industry, likewise those in other emerging economies, continue to grow rapidly by primarily offering voice and data (internet) services to subscribers. It currently has a market size of US$1.9 billion with key firms like MTN, AirtelTigo and Vodafone (National Communications Authority, Citation2021). In 2020 alone, the industry contributed about US$3.6 billion to Ghana’s total revenues generated and employed over 100,000 people through direct and indirect employment (i.e. mobile money agents, merchants, retailers) (National Communications Authority, Citation2021). The industry also provides support services to sectors like banks, health, creative arts, agriculture, and education, etc; cementing its importance. MTN is the leading telecommunication company in Ghana with a market share of 63% despite several programmes by NCA to reduce its dominance in the country (Scancom PLC, Citation2021). Since 2015, the company has retained its largest market share base and currently has over 27.8 million subscribers. Its data revenue alone represents about 39% of Ghana’s total service revenues (National Communications Authority, Citation2021). In terms of digitalisation, MTN has transformed the industry with a series of innovations and technologies. In carrying out its business, MTN continues to rely on advanced technologies like web 2 to promote customer engagement and brand positioning.
The telecommunication industry in Ghana is a very competitive one due to the presence of giants like MTN Ghana, AittelTigo, Glo and Vodafone Ghana (National Communications Authority, Citation2021). Companies such as Expresso and Glo Ghana, for instance, have faced the wrath of the industry’s fierce competition which eventually pushed them to change their business focus. Similarly, Airtel and Tigo suffered the same fate and had to merge to create ‘AirtelTigo’ in 2017 in order to remain competitive (National Communications Authority, Citation2021). The report also revealed that the level of competition in the industry has led to Glo partnering with AirtelTigo since April 2022 when Glo customers have been pushed to the latter’s network platform. These are indications that companies in the industry face fierce competition; hence, failure to perform sustainably could have severe repercussions on them. Although MTN is currently the leader in the industry, its performance challenges have also been documented. A report by Scancom PLC (Citation2021), for instance, revealed that the company’s digital revenue fell by 21.7% YoY (i.e. year on year) in 2020 which also led to a decline in its digitato-servicece revenue by 1.6% (i.e. from 4.3% to 2.7%). To address this challenge, the company spent GHS569 million in the same year to expand its technology and service quality (Scancom PLC, Citation2021). This investment saw the company enjoy 53.2% growth in its data traffic while increasing internet coverage from 76.1% to 79.9% in 2021. Also, MTN’s data revenue increased by 47.9% YoY which subsequently increased its data-to-service revenue to 33.6% YoY from 28.5% YoY in the same year. These statistics indicate the importance of adopting and investing in technologies like web 2; hence, it could be argued that the company’s overall performance could continue to expand if it continues to invest in web 2.
Many researchers have indicated that web 2.0 such as Facebook, Instagram, and Twitter are new sites for business that can reinforce customer behaviour intentions (Evanschitzky et al., Citation2022; Zahoor, Citation2022). In the context of the telecommunication industry, customers are more inclined to use web 2.0 tools to increase their knowledge-sharing behaviour about organisations’ products and services as compared to other conventional learning approaches because of its site’s ease and convenience (Hafez, Citation2022). In addition, Blasco-Arcas et al. (Citation2022) highlighted that with the advent of web 2.0 media, a high level of interactivity between customers and organisations can avail and strengthen customer knowledge sharing.
Nevertheless, the findings from existing research on web 2. 0 and organizational performance are still inconclusive, as Abdelhady and Ameen (Citation2022) argued that web 2.0 tools can help business entities in their operations much easier to foster strong relationships between parties. However, Vasan (Citation2023) posits that for both the buyer and the seller, web 2.0 has become a double-edged weapon, depending on how it is used, the use of these tools will offer both assistance and damage. In addition, Vasan argued that if businesses do not properly familiarise their messages with the anticipations of customers, they can lose their image (Cadavid & Valencia-Arias, Citation2022; Amoah et al., Citation2021)
A review of past literature reveals that bountiful research has been conducted on web 2.0 and firm performance in developed countries (Narayan & Hungurd, Citation2022; Heredia et al., Citation2022).
However, studies examine the individual effects of the adoption of web 2.0 tools like file sharing, and wikis. Social networking sites and blogs on organizational performance remain scanty in the literature. In addition, academic research on these variables using an integrated model is limited, especially in the context of the Ghanaian telecommunication industry. In view of the research deficiency, the aim of this study is to examine the interrelationships between web 2.0 adoption, perceived ease of use, and organizational performance in Ghana’s telecommunication industry.
Furthermore, despite the contribution of Resource-Based theory in management and marketing studies, it has not been adequately explored in relation to Web 2.0 adoption and organisational performance, especially in the context of telecommunication industry in Ghana. The study also provides practical implication for telecommunication operators on how to leverage Web 2.0 technologies to boost firm performances. It also informs the formation of effective service marketing strategies that promotes brand positioning and enhanced customer engagement.
2. Literature review and hypotheses development
According to the resource-based view (RBV) theory, firms need to constantly adopt new innovations or technologies as key resources in order to stay competitive (Somsuk et al., Citation2012). RBV theory also suggests that firms need to adopt technologies like web 2 to support their limited internal resources in a bid to perform effectively. The theory is also supported by the technology acceptance model (TAM) which similarly proposes that individuals mostly accept a technology based on its perceived ease of use (PEOU) and perceived usefulness (PU) (Marangunić & Granić, Citation2015). TAM suggests that a positive perception of web 2’s ease of use and usefulness could trigger actual usage among the target audience and invariably help providers to attain expected performance goals. In relation to the study, the theory suggests that telecommunication companies like MTN can never rely on only their internal resources to achieve set goals; thus, emphasising the need to continue to adopt technologies from external partners. The theory specifically suggests that these firms can become competitive and also attain higher performance if they adopt modern innovations like Web 2 technologies. In view of this, the theory supports the adoption of Web 2 technologies like wikis, social networking sites, file sharing, and blogs to support firms’ scarce resources in order to attain set performance targets. The theory further argues that internal resources are generally scarce, hence, for firms to perform better, they need to adopt Web 2 technologies.
2.1. Adoption of social networking sites and organisational performance
Social networking websites like Facebook, Instagram, and Twitter play crucial roles in creating positive interaction between or among people; hence, are key to achieving better organisational performance (Kim et al., Citation2013; Zhang et al., Citation2017). In the business environment, social media can be used to link customers with businesses for a variety of requirements. This assertion was directly supported by Tajvidi and Karami (Citation2017) when they found social media to significantly and positively affect firm performance. They concluded that hotels’ performance would improve if they adopt social media to expand their innovation and branding capabilities. Similarly, firms’ participation in social media promote brand value (Hudson et al., Citation2016; Nisar & Whitehead, Citation2016); customer trust (Zhang et al., Citation2017); sales growth (Kumar et al., Citation2016), promote knowledge sharing (Munar & Jacobsen, Citation2014) and CRM (Rosman & Stuhura, Citation2013). These outcomes are synonymous to attaining positive organisational performance; suggesting that social media is positively related with organisational performance (Trainor et al., Citation2014; Nisar & Whitehead, Citation2016). As a communication medium, social networks also aid businesses in achieving a variety of organisational goals, especially those related to public relations and marketing activities like advertising, customer service and branding (Nisar & Whitehead, Citation2016). Zhang et al. (Citation2017) stressed that social media enables users to generate content and communicate with others which leads to high firm performance. Siamagka et al. (Citation2015) and Wamba and Carter (Citation2016) further stressed that firms’ adoption of social networks could create strong networks among customers, businesses, and suppliers and this could be key to expanding firm performance. From the foregoing, one can deduce that adopting social networking sites play valuable roles in improving organisational performance; hence, the study hypothesis that:
H1: Adoption of social networking sites has a significant positive effect on organisational performance.
2.2. Adoption of file sharing and organisational performance
File sharing is characterised by making huge files accessible to users on peer-to-peer networks (Hurtado Gonzalez et al., Citation2014). To ensure that the site does not operate independently from other Web 2.0 applications, file sharing platforms often allow users to embed their information into social networking sites (Hurtado Gonzalez et al., Citation2014; Rogerson & Basanta, Citation2016). For the sharing of photos, for instance, reputable websites including Flickr or Fotolog are used while YouTube, on the other hand, is for sharing video content (Kim et al., Citation2013). With these file sharing platforms, organisations can easily and conveniently transfer important information via video or imagery content to customers (Belk, Citation2014). This, in turn, allows these organisations’ customers to access information about their products and services to make purchasing decisions and promote performance. Although studies have failed to directly investigate the role of file sharing in organisational performance, it could, however, be argued that file sharing is key to attaining this goal. Kim et al. (Citation2013) similarly stressed that businesses that do not regularly post and share video contents with their customers viafile-sharingg sites could struggle to reach large number of people. More precisely, given the millions of subscribers of YouTube (Tafesse, Citation2020); using it to create and share videos with customers would lead to wide coverage, improve brand image and invariably promote firm performance. Also, Narayan and Hungund (Citation2022) noted that innovations like file sharing makes information about a firm’s product and service readily accessible devoid of customers’ location; hence, serves as a crucial web 2 technology for spreading a firm’s information. Customers can, for instance, use file sharing sites like YouTube to posts comments or suggestions after using a given company’s product and services. Arguably, positive comments trigger post-purchase behaviours which could serve as a vital electronic word oof mouth advertisement to attract other customers; hence, improve performance (Narayan & Hungund, Citation2022). With file sharing as an IS innovation, companies including SMEs are induced to abide by national and international regulatory rules, which aids them in maintaining a high degree of compliance to safeguard reputation and brand image; invariably promoting their performance levels (Erind, Citation2015). File sharing sites also allow customers to store the information, recover them at any time and even protect them (Alzaam & Almizeed, Citation2021). These events consequently lead to better organisational performance. In light of this, the study proposed that:
H2: Adoption of file sharing has a significant positive effect on organisational performance
2.3. Adoption of wiki and organisational performance
Wiki is a collaboratively edited and controlled online hypertext publication that is accessed through a web browser by its own audience (Grudin & Poole, Citation2010). This web 2 technology, if adopted, allows users including customers to create, browse and search for information including those about a company’s product and service (Dessart et al., Citation2015). It is used in recent times by firms to advertise their packages to readers or users (Chirumalla et al., Citation2018). For instance, with wiki, customers get information about a company which can then be shared with others; arguably creating awareness and thereby improving its overall performance. In view of this, companies with wikis can easily create and regularly update content for their customers and by doing so, the customers are consistently exposed to up-to-date information which could be crucial to promoting brand positioning, influence their purchasing intentions, and invariably affect firm performance. Rahoo et al. (Citation2018) specifically stressed that wiki, a form of web 2, is used for promoting and marketing library services in most higher education organisations in Sindh. In relation to the study, information about MTN Ghana’s packages and other relevant information can easily be accessed on wiki sites like Wikipedia and this arguably influences customers purchasing decisions, promote brand awareness and firm performance. The study hypothesised that:
H3: Wiki has a significant positive effect on organisational performance of MTN
2.4. Adoption of blogs and organisational performance
Blog is a forerunner of Web 2.0 which enable readers to subscribe to a feed to receive notifications when new entries are made (Bheekharry, Citation2020; Sajjad & Zaman, Citation2020). Sharing blog entries, videos, pictures or comments on social media encourages followers to respond and participate, go to a business’ website, and patronise services and products (Prasad, Citation2021); arguably, contributing to expanding firm performance. According to Awan et al. (Citation2020) and Ďaďová and Soviar (Citation2021), blogs create an online community and allow firms to actively engage with target audience to trigger actual purchasing and invariably contribute to positive performance outcomes. Also, blogs, according to Moustafa (Citation2022), represent the fifth most reliable source of accurate web information, and marketers who use them have been found to get about 67 percent more leads than those who do not; indications of its role in expanding firm performance. Moreover, Sajjad and Zaman (Citation2020) also stressed that firms that adopt blogs to create and share information ensure effective marketing engagement which in turn promotes users’ loyalty and arguably improve firm performance. Blogs via social media have changed how competition is conducted due to the quick development of technology, the growing influence of online communities, and marketers’ diminished ability to manage their strategies through traditional marketing techniques (Assis et al., Citation2020). Users that frequent a company’s blog to get information tend to build a strong bond with it, which may be important for boosting its performance levels (Amoah et al., Citation2021). Sadiq et al. (Citation2020) concluded that users can utilize blogs to share positive experiences with their social networks, which could raise a company’s ratings, promote engagement, and arguably improve firm performance. Given this, the study proposed that:
H4: Adoption of blogs has a significant positive effect on organisational performance
2.5. Moderating role of perceived ease of use in the relationship between web 2 adoption and organisational performance
PEOU has been identified as a key construct for investigating and evaluating user acceptance of a certain technology, drawing on the information technology (IT) literature. Researchers have suggested that PEOU could play a role in users’ acceptance and use of a technology which could consequently improve the performance of an organisation (Amin et al., Citation2014; Morosan, Citation2022). Morosan (Citation2022), for instance, revealed that if consumers perceive a new technology to be simple and easy to use, they could adapt their behaviour to actually use it and vice versa. Similarly, to this, Amin et al. (Citation2014); Kiburu et al. (Citation2022) asserted that PEOU, perceived usefulness, and consumer satisfaction in an online buying environment had a favourable association. They concluded that customers who perceive online shopping as easy to use and useful, exhibit positive post purchase behaviours such as customer satisfaction. Chawla and Joshi (Citation2021) revealed that PEOU and PU significantly mediated the link between self-efficacy and purchasing intentions of mobile banking customers in Yemen. They concluded that for self-efficacy to improve customers’ purchasing intentions, it must pass through PEOU and perceived usefulness. Wilson et al. (Citation2021), for instance, concluded that PEOU and perceived usefulness play crucial roles in improving customer satisfaction and eventually strengthening customer loyalty in China. In line with these findings, the study argues that when customers perceive Web 2 technologies adopted by the telecommunication firms in Ghana, especially MTN, to be useful and easy to use, they would be induced to adopt them; thereby, triggering stronger firm performance. More precisely, for MTN’s adoption of Web 2 technologies like wikis, social networking, file sharing, and blogs to expand its performance, then they should be perceived by its customers or subscribers as easy to use. The study also argues that although web 2 adoption could directly affect MTN’s performance, the presence of PEOU could strengthen it but not weaken it. Hence, subscribers’ PEOU of web 2 adopted by MTN could trigger actual usage which could be key to attaining stronger firm performance. In view of this, it was hypothesised that:
H5: Perceived ease of use has a significant moderating effect on web 2 adoption and organisational performance
2.6. Conceptual framework and summary of research gaps
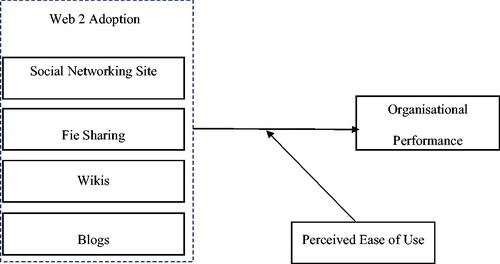
In this study, perceived ease of use (PEOU) represented the moderating variable, web 2 adoption comprising wikis, social networking sites, file sharing, and blogs represented the exogenous constructs while organisational performance represented the endogenous construct (see ). demonstrates the hypothesised relationship between the constructs of the study as discussed above in section 2 of the study.
Figure 1. Conceptual framework of the study. Source: Author’s Own Construct (2022).
The main gaps identified in the review has to do with the need to test for perceived ease of as a moderating factor. In addition, the current literature exposes the need to empirical assess the five identified hypotheses.
3. Research methods
The quantitative approach was employed on the basis of obtaining and interpreting objective or fact-based data from a large target population to draw concrete conclusions (Salaria, Citation2012). The explanatory research design was appropriate because it provided the guidelines to investigate the interactions among web 2 adoption, perceived ease of use and organisational performance. The design is appropriate for obtaining data from MTN’s subscribers who are scattered across the Ghana. It also allows the use of statistical tools notably regression which involve a great amount of numerical data to analyse the causal relationships (Beins & McCarthy, Citation2017). The study was carried out within the scope of MTN Ghana, the leading company in telecommunications in the country.
The study population was active customers of the company who had also linked their SIM cards with the Ghana Card by 30th June, 2022. Report by Scancom PLC (Citation2021) revealed that 16.2 million which represents about 60% of its subscriber base of 27.2 million have met this criterion. The study’s target population comprised 16.2 million customers of MTN Ghana. In relation to the study, target population size of 16.2 million is extremely large; hence, required sampling. To achieve this, Adam’s (2020) sample determination table was adopted and a sample size of 267 was selected under the following assumptions: 95% confidence level, p = 4, margin of error (ϵ) =0.4 and t = 1.96. Given the possibility of response issues which could affect the quality of the study’s data and associated outcome, the minimum sample size was increased by 10% to 367. Given the scattered nature of the subscribers, the study adopted the convenience sampling technique. Although this technique is non-probabilistic and largely used in qualitative research, some researchers (Kriska et al., Citation2013; Etikan et al., Citation2016) have contended that it can be used in quantitative research. They stressed that it is adopted when a reasonable number of the members in a target population are easily accessible reachable or approachable (Kriska et al., Citation2013). Also, the tool enables selecting of participants based on proximity; hence, the researchers obtain data from members-based convenience (Etikan et al., Citation2016). The instrument used to collect the primary data for this study was the structured questionnaire. Ahmad et al. (Citation2022) suggested that a structured questionnaire is appropriate for gathering primary data in any quantitative study. The questionnaire was in four (4) major folds: Part A focused on the respondents’ socio-demographic features; Part B had 20 question items to measure the four web 2 tools; Part C contained five indicators to measure organisational performance and finally, Part D contained five question items to measure perceived ease of use. All the items were then put on a five-point Likert-like interval scale where 1 represents weak agreement and 5 represents strong agreement respectively. The scale was chosen because it is useful for gathering data when the study aims at establishing causal relationships between web 2 adoption and performance.
3.1. Measurement of variables
This section presented the measurement indicators for the key constructs and associated sources (see ).
Table 1. Measurement of variables.
3.2. Validity and reliability
The study’s drafted questionnaire was given to three experts with adequate research and marketing knowledge to review. This is in line with Mohajan’s (2022) position on the use of experts in instrument validation. This brought about minor changes in the wording of the items. Reliability is addressed when the instrument’s Cronbach alpha after reliability testing is 0.7 or more. Thus, the closer the alpha value to 1, the higher the reliability of the instrument. To achieve this, the study conducted a pre-test and obtained a data-set of 40 from MTN subscribers in Cape Coast. The result of the reliability test was presented in to show that all the constructs and their associated measurement items were reliable.
Table 2. Reliability test.
Data collection procedure, prior to the data collection exercise, the researchers provided a letter to the management of MTN Ghana to inform them about the impending research and to also seek access to relevant information to successfully conduct the research. After being granted permission by the company’s management, information such as MTN’s profile and a total number of subscribers who have linked their SIM card with Ghana Card were obtained from the company’s records. In terms of the respondents, copies of the questionnaires were made and distributed to 367 conveniently sampled subscribers. The researchers adopted the drop-and-pick approach, where copies of the instruments were handed over to the respondents to complete and were retrieved at a later date. Due to their involvement and support, the exercise took three weeks to complete, specifically, between 7th August to 28th August, 2022. After the exercise, the researchers obtained completed questionnaires from 330 respondents because, 37 of the respondents, although initially provided assurances, could not participation in the exercise because of their inflexible time schedules.
The objectives were then analysed via partial least square-structural equation modelling (PLS-SEM). This analytical tool is suitable for examining data aimed at establishing cause-and-effect relationships between or among variables. PLS-SEM specifically has the ability to provide more rigorous analysis to draw concrete conclusions and generalise the findings. By fusing principal component analysis with ordinary least square regressions, PLS-SEM explicitly predicts partial model structures (Hair et al., Citation2021). The following assumptions were assessed: measurement assessment (i.e. indicator reliability, internal consistency reliability and validity [i.e. discriminant and convergent] and structural model (i.e. collinearity, coefficient of determination, effect size, and predictive relevance) (Hair et al., Citation2017, Citation2021; Memon et al., Citation2021). After assessing these quality criteria, the hypotheses were specifically tested using 5000 bootstrapping and its results were extensively discussed. It is to note that the PLS-SEM output was presented in both figures and tables and subsequently discussed in the next sections.
3.3. Ethical considerations
The ethical considerations are not limited to informed consent, right to privacy, confidentiality, voluntary participation, anonymity and honesty (Sobočan, 2022). Practically, confidentiality was attained when the respondents’ data were protected; hence, kept away from third parties. Also, the respondents were allowed to voluntarily participate in the exercise and they were also free to withdraw at any time they wished without any penalty nor punishment.
4. Analysis, results and discussions
The study’s results and discussion were provided in this section. It first provided the respondents’ socio-demographic information and consequently discussed the tested hypotheses.
4.1. Socio-demographic features of respondents
The respondents’ socio-demographics were described in this section based on valid responses. Out of the 367 questionnaires distributed to the conveniently sampled respondents, 272 with a response rate of 74.1% were deemed valid. Hence, this section presented the demographics of the 272 MTN subscribers who partook in the study and also provided valid responses. First, the respondents’ sex was ascertained and it was noticed that the majority (141, 51.8%) of them were males while (131, 48.2%) of them were females. In terms of age, the majority (91, 33.5%) of the respondents were between 41 and 50 years; (77, 28.3%) of them were between 31 and 40 years; (74, 27.2%) of them were between 18 and 30 years and finally, (30, 11.0%) of them were over 50 years. In terms of highest educational qualification, (123, 45.2%) of them have first degrees, (855, 31.6%) were HND or lower certificate holders and finally, (63, 23.2%) of them have second (masters) or terminal (doctorate) degrees.
On the number of years the respondents have subscribed and actively use MTN’s packages (i.e. products and services), it was revealed that majority, (95, 34.9%) of the respondents have actively used the company’s packages for over 15 years; (78, 28.7%) of them have also been using the company’s packages for 11 to 15 years; (76, 27.9%) of them have done so for 5 to 10 years while (23, 8.5%) of them have less than 5 years of experience in using MTN’s packages. This result indicates that most of the respondents have used this company’s packages for over 5 years; hence, possess adequate knowledge to provide relevant information associated with web 2 adoption of the company.
4.2. Preference of web 2 tools adopted by MTN
The respondents were asked to indicate which of the company’s web 2 technologies they are aware of and also prefer most. These technologies specifically included social networking sites, wikis, file sharing and blogs. The result of this exercise was presented in .
Figure 2. Customers’ preference for web 2 tools. Source: Field survey (2022).
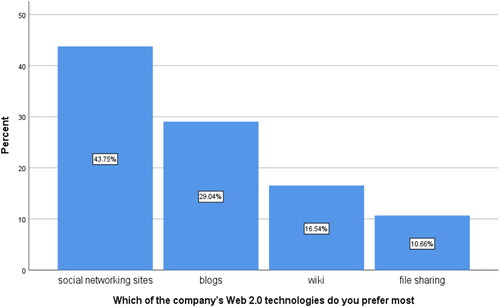
From , it could be seen that majority (43.75%) of the respondents revealed that they are aware of and prefer social networking sites to access and read information about MTN’s products and services. These social network platforms included Facebook, WhatsApp, Instagram and Twitter. This was followed by 29.04% of the respondents’ preferring blogs, 16.54% of them prefer wiki while 10.66% of them prefer the file sharing tool like YouTube, Flickr. This result simply means that most of the customers of MTN in Ghana prefer social networks to interact with the company, obtain valuable information from them and also share their comments or suggestions with both the company and other customers. This could be because social networks are the most popular, convenient and easy to use as compared to the other three web 2 technologies; hence, customers find them easier and faster to access, read and share information about any product or service.
The section presented the study’s results after analysing the data using the PLS-SEM technique. It specifically had the following major sub-sections: (i) model development and assessment (i.e. in terms of measurement and structure) and (ii) significance and relevance of the structural model relationships.
4.3. Model specification and assessment
This section presented two key sub-sections: (a) model specification and (b) model assessment with respect to measurement and structure.
4.3.1. Model specification
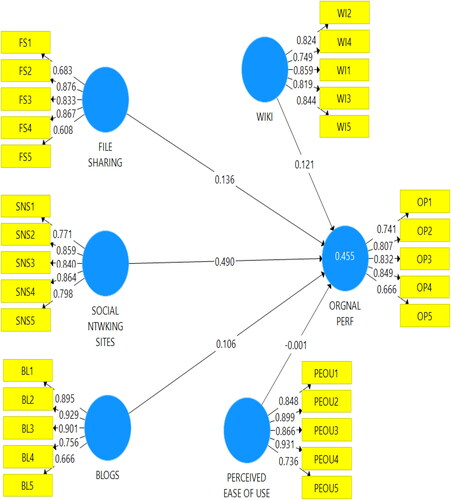
The model was first specified or developed to show the constructs and their assigned indicators or measurement items. The model was built with six (6) constructs (i.e. 4 exogenous, 1 moderator, and 1 endogenous) with 30 indicators (5 indicators each). Precisely, the exogenous variables (i.e. Web2.0 technology) included social networking sites (SNS) comprising SNS1, SNS2, SNS3, SNS4, SNS5; Wiki (WI) had WI1, WI2, WI3, WI4, WI5; file sharing (FS) had FS1, FS2, FS3, FS4, FS5; blogs (BL) also had BL1, BL2, BL3, BL4, BL5. The moderating variable (perceived ease of use [PEOU]) also contained PEOU1, PEOU2, PEOU3, PEOU4, PEOU5 and the endogenous variable (organisational performance [OP]) had OP1, OP2, OP3, OP4, OP5. The model was presented in to show all the constructs and indicators.
Figure 3. Initial model specification. Source: Field Survey (2022).
4.3.2. Assessment of indicator reliability
After specifying the model, the measurement items or indicators were first assessed using their loadings. The item loadings were assessed to ensure that each indicator truly measured its assigned construct (Hair et al., Citation2017). To achieve this, the rule suggests that indicator loadings should be ≥ 0.70 (Hair et al., Citation2017; Memon et al., Citation2021). The rule also proposes that item loadings < 0.70 could be deleted from the model, but with high precaution. Hair et al. (Citation2021, 2022) emphasised that instead of automatically removing items with loadings below 0.70, researchers should carefully evaluate the indicator’s impact or relevance to the other validity and reliability measures. Hence, items < 0.70, especially those between 0.40 and 0.70 could be maintained if they have positive impacts on the model’s validity and reliability.
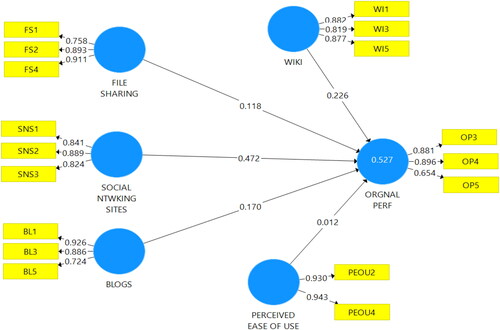
Based on the rule and suggestions by Hair et al. (Citation2021) and Hair and Alamer (Citation2022), the following indicators were removed from the specified model in : FS3(0.833), FS5(0.608), SNS4(0.864), SNS5 (0.798), BL2(0.929), BL4(0.756), WI2 (0.824), WI4(0.749), PEOU1(0.848), PEOU3(0.866), PEOU5(0.736), OP1(0.741) and OP2(0.807). Deductively, although majority of the indicators had loadings > 0.7, they were removed because their inclusion affected the validity and reliability of the overall model. Therefore, only items > 0.70 with better impact on the other reliability and validity measures were retained and invariably, used to specify the final model in .
Figure 4. Final model structure. Source: Field survey (2022).
4.3.3. Assessment of measurement model
After specifying the measurement model, it was assessed to ensure that all the required quality criteria are met. Precisely, internal consistency reliability (ICR) and validity (convergent [CV], discriminant [DV]) (i.e. inner VIF values) were assessed (see and ). presented the model’s ICR by reporting Cronbach Alpha (CA), rho A and composite reliability (CR). Also, the model’s convergent validity via AVEs was assessed.
Table 3. Internal consistency reliability and validity.
Table 4. Heterotrait-monotrait (HTMT) ratio.
presented the model’s ICR results to assess the possible association between the items or indicators measuring a particular latent variable (Hair et al., Citation2019). ICR is assessed to ensure that all the question items are reliable for measuring their assigned constructs. ICR is assessed using CA, rho_A or CR values (Sujati, Citation2021; Hair et al., Citation2021) and follows the ruling that the values should be above 0.70. More precisely, values between 0.70 and 0.90 suggest ‘satisfactory to good’ while those above 0.95 are deemed to be ‘problematic’ because they show redundant indicators; hence, affecting construct validity (Henseler et al., Citation2014). Hair et al. (Citation2019) also revealed that reliability values ≥ 0.95 suggests the likelihood of undesirable response patterns which could trigger inflated connections among the indicators’ error terms; hence, affecting overall reliability. Given the three approaches to ICR, the rho_A has predominantly been preferred to CA and CR due to its ability to produce more accurate and superior outcome (Dijkstra et al., 2015; Trizano-Hermosilla & Alvarado, Citation2016). Trizano-Hermosilla and Alvarado (Citation2016), for instance, revealed that CA assumes that all indicator loadings are tau-equivalence; implying that they are the same in a particular population. They also suggested that CA is more conservative and deemed to have a lower-bound approximation of the true ICR while CR may be too liberal and considered as an acceptable upper-bound approximation of the true ICR. The reliability coefficient rho_A falls between CA and CR; hence, regarded as acceptable compromise between CA and CR. From , the rho_A values ranged between 0.816 (OP) and 0.930 (BL) to suggest ICR. The convergent validity (CV) was also assessed using the AVE values (Hair et al., Citation2021) to show the extent to which the variances of the indicators are captured by their latent variables with respect to the sum of variance and its resulting measurement error. The model complied with the rule that all AVE values should be ≥ 0.50 (Henseler et al., Citation2014; Hair et al., Citation2021). Deductively, all the AVE scores were > 0.50 with OP (0.668) reporting lowest AVE while and PEOU (0.87) had the highest AVE; thereby, suggesting that the model’s validity was convergent.
4.3.4. Discriminant validity
The model was also tested for discriminant validity (DV) as proposed by Wong (2019), Hair et al. (Citation2021). It is specifically used to assess whether a model has possible collinearity issues. Hair et al. (Citation2017) proposed that DVs which are discriminantly valid mostly lack significant levels of collinearity. Previous studies (Hair et al., Citation2017, Citation2021; Henseler et al., Citation2015) have proposed three major approaches (i.e. Fornell and Larcker, cross loading and Heterotrait-Monotrait (HTMT) ratio) for checking DV, but, the HTMT approach was preferred because it shows superior output given its strength in easily detecting absence of DV in basic research. The rule for assessing the HTMT ratio suggests that the correlation values among the constructs should be < 0.90 (Wetzels et al., Citation2009). Simply put, DV is achieved if the HTMT values are < 0.90. From , all the constructs’ HTMT values are < 0.90 with the highest value of 0.806 between PCSR and LCSR; while the link between WI and BL was 0.079 having the lowest HTMT. This result suggests that the constructs are clearly different from each other.
Table 5. Explanation of target endogenous variable variance.
4.3.5. Structural model assessment
This section presented the assessment outcome of the study’s structural model to specifically evaluate the model’s predictive accuracy using coefficient of determination (R2) score, predictive relevance (Q2) based on the Stone-Giesser’s test and effect size (f2) (see ).
reported the model’s variance inflation factor (VIF) scores to check for possible collinearity. Collinearity is evaluated using VIFs to check whether the coefficients of the parts in the model are bias-free (Hair et al., Citation2017). The rule suggests that VIF values should be < 5 (Henseler et al., Citation2015) to indicate absence of collinearity issues. However, the most appropriate VIF value which indicates no collinearity issue is 0.30 or below. From , all the VIFs were < 3 (i.e. 1.033[BL] - 1.838 [WI]); thereby, suggesting absence of collinearity problem. The R2 value, representing the coefficient of determination, was also discussed to show the combined contributions of the exogenous constructs (BL, FS, SNS, WI) on the endogenous construct (OP) (Hair et al., Citation2021). R2 suggests the portion of OP that is linearly accounted for by combining Web 2.0 technology adopted by MTN. The R2 ranges between 0 and 1 and follows the rule that: 0.75 (substantial), 0.50 (moderate) and 0.25 (weak) respectively (Hair et al., Citation2021). From , the R2 value was 0.527 (i.e. > 0.50) to show that Web2.0 technology adoption moderately accounts for 52.7% of MTN’s performance in Ghana. Therefore, since the company adopted web 2.0, its overall performance has increased by over 50%. Hair et al. (Citation2019), however, revealed that the R2 limitation is that its value tends to increase as more exogenous constructs are included in the model. This can be addressed by making adjustments in the R2 value based on the number of exogenous constructs with respect to the data size; hence, the need to discuss the adjusted R2. revealed a value of 0.518 to suggest that about 51.8% of OP is linear accounted for by any adjustment made in web 2.0 adoption. Therefore, when any adjustments are made after adopting the web 2.0, it could account for about 52% of change in MTN’s performance.
Table 6. Significance and relevance of path coefficients.
also reported the f2 of each independent construct by adopting Cohen et al. (Citation2011) impact criterion which suggests that f2 values of 0.02 = small, 0.15 = medium and 0.35 = large respectively. From the table, SNS had a medium f2 of 0.310, while the other web 2.0 technologies had small f2, precisely, BL (0.060), WI (0.059) and FS (0.020) respectively. The result suggests that SNS has a better effect on OP as compared to the other web 2.0 technologies; however, FS had a weakest f2.
Finally, the model’s predictive relevance based on Stone-Geisser’s (Q2) test was assessed (Hair et al., Citation2017). Memon et al. (Citation2021) revealed that Q2 is analysed by removing a portion of the data matrix, analyse the remaining model and predict the removed portion based on the estimations. Wong (2019) suggested that Q2 is achieved if its construct’s value is > 0. Hair et al. (Citation2021) further suggests that, ‘0.02 ≤ Q2 < 0.15 shows weak, 0.15 ≤ Q2 < 0.35 (moderate) and Q2 > 0.35 (strong) Q2’ respectively. Deductively, all the Q2 values were > 0; showing predictive relevance. From , FS (0.366) predicts OP better than WI (0.329), BL (0.315) and SNS (0.238) respectively.
4.3.6. Significance and relevance of path coefficients
After assessing and meeting the model’s quality criteria, the study finally reported the hypotheses results. The hypotheses specifically focused on testing the significant effects of BL, WI, FS, and SNS on OP of MTN. The hypotheses were specifically tested using 5000 bootstraps and the t-stats were reported and analysed instead of the p-values as proposed by Hair et al. (Citation2017, Citation2021). They suggested that t-stats ≥ 1.96 is synonymous with p-values< 0.05 at 95% confidence level to indicate ‘support or acceptance’ of the directional hypothesis. This rule has been extensively supported by several scholars including Aguirre‐Urreta et al., (Citation2016), Memon et al. (Citation2021) and Sarstedt et al. (Citation2022). Also, in terms of relevance, the path coefficients fall between -1 and +1 where the closer the value to -1, the stronger the negative relationship while values close to +1 suggests strong positive correlation. Moreover, the relationship’s strength was represented by the β value with the rule that values < 0.35 (weak), 0.35–0.65 (moderate) and >0.65 (strong) respectively (Cepeda-Carrión et al., Citation2022; Hair et al., Citation2019, Citation2021). The results were presented in with five columns representing structural path, path coefficients (β), t-stats, p-values and decision rule of each hypothesis. In view of this, the study’s five hypotheses were tested and discussed in the succeeding sections based on the rules aforementioned.
4.3.7. Effect of adoption of social networking sites on performance of MTN
The section presented the outcome of H1 with respect to the significant effect of adoption of social networking sites (SNS) on organisational performance (OP). revealed the following results: t-stat = 5.835, p = 0.000, and β = 0.495; hence, supporting the hypothesis. The results indicate that SNS has a significant, positive moderate effect on OP of MTN; as such, any unit change in SNS would result in a significant and positive unit change in OP by 49.5%. Based on β, SNS ranked ‘1st’ among the four web 2 technologies adopted by MTN. The study’s result implies that when MTN adopts social networking sites like WhatsApp, Facebook, Twitter, and Instagram to spread or share information about its products and services with customers, its overall performance level would rise by about 50 percent. The result clearly shows that adoption of social networking sites as a marketing tool would improve MTN’s performance by 50%; hence, about half of MTN’s overall performance in terms of market share, profit margin and expansion of network connectivity across the country is contributed by the adoption of web 2, specifically social networking sites. Therefore, for MTN to enjoy moderate performance, SNS should continuously be used as a marketing tool to reach large number of customers within the shortest possible time. Simply put, SNS such as Facebook, Twitter and WhatsApp are important marketing sites that plays a moderate role in expanding MTN’s performance. The result indicates that hypothesis one (H1) is supported. The study’s finding has been supported by Siamagka et al. (Citation2015) and Wamba and Carter (Citation2016) who posited that web 2 is still an emerging area but its adoption yields high outcomes notably firm performance. They concluded that web 2 technologies including social media or networking platforms are key to the success stories of organisations, especially the multinational ones that adopt them. Nisar and Whitehead (Citation2016) similarly stressed that social networking site is the most used and adopted web 2 technology for marketers and even individuals over the last decade. This is because of its relatively ease of use, the speed with which adverts spread to reach a large number of people across the globe as well as its convenience and low costs. Harrigan et al. (Citation2021) concluded that social network, also known as social media, plays an important role in attaining improved firm performance.
4.3.8. Effect of adoption of file sharing on the performance of MTN
The second hypothesis (H2) on whether file sharing (FS) significantly affects organisational performance (OP) of MTN was also tested and the t-stat was 1.988 with p-value of 0.047 to signify support for the study’s hypothesis. This result means that FS significantly affects the OP of the company. Thus, any unit change in FS would lead to a significant unit change in OP. The β-value of 0.118 indicates a positive but weak effect of FS on OP; implying that any significant unit increment in FS would lead to a significant unit increment in OP by 11.8% and vice versa. Dwelling on the β-value, FS ranked ‘3rd’ among the four web 2 tools adopted by MTN to spread information about its products and services to its numerous customers in Ghana. The result indicates that when MTN uses file sharing as a web 2 technology to create images/pictures and videos and share them with its millions of customers, it would improve the company’s performance level by about 12 percent. More precisely, when file sharing platforms such as YouTube (i.e. for videos) and Flickr (i.e. for images) are adopted to facilitate the creation, sharing and receipt of files including videos, audios and images about MTN, they could improve the company’s overall performance levels in areas of increased number of subscribers and improved network connectivity. Also, the company would continue to achieve its mission, goals and objectives coupled with increasing its market share and profit levels when it adopts file sharing software and applications to create rich video, pictures and audio information and share them via YouTube, Filemail, etc to its customers. The result indicates that hypothesis two (H2) is supported. The study’s finding is in line with previous studies by Hurtado Gonzalez et al. (Citation2014) and Rogerson and Basanta (Citation2016). These studies have clearly revealed that file sharing software like YouTube serves as an important web 2 technology for sharing and spreading information (i.e. audio, video, picture, text) about a company’s products or services to its numerous customers are relative ease. File sharing also ensures that organisations can easily share valuable information about their services and products to promote brand positioning and invariably induce customers to continue to patronise them; thereby, promoting firm performance (Tafesse, Citation2020). Similarly, Narayan and Hungund (Citation2022) emphasised that adopting web 2 tools like video and image sharing software or applications are vital for firms to smoothly conduct their marketing activities in order to expand OP.
4.3.9. Effect of adoption of wiki on performance of MTN
The study’s H3 proposed that, ‘wiki (WI) has a significant positive effect on organisational performance (OP) of MTN’. Based on the t-stat value of 2.526 > 1.96 with p-value of 0.0012 < 0.050, the study’s hypothesis was supported. This result means that WI has a significant effect on OP and the model’s β-value of 0.212 also suggest that WI has a positive but weak effect on MTN’s OP. Per the β-value, WI ranked ‘2nd’ among the web 2 technologies adopted by MTN. Despite its low rank, the result suggests that when MTN relies on wiki to advertise its packages to customers, its performance levels tend to expand by 21.2%. More precisely, for MTN to continue to expand its overall performance levels by about 21 percent, then wiki should be adopted among its web 2 technologies. The result specifically reveals that when the company adopts wiki to allow its customers to easily access and read valuable information about its products and services, its overall performance level would expand. The result also suggests that when MTN adopts wiki, its customers can easily access numerous and up-to-date information about its products and services and this would be crucial to expanding the company’s overall performance. A typical example of wiki adopted by the company is MTN Wikipedia which was established in 2015 to allow customers to easily access, read and/or share information about the company with other customers. The wiki represents a key marketing tool which even allow customers to indirectly act as marketers whenever they share the company’s information with others; in turn, improving MTN’s position and thereby, promoting firm performance. The result indicates that hypothesis three (H3) is supported. The study’s outcome was supported by Grudin and Poole (Citation2010) and Dessart et al. (Citation2015) in their assertions that wiki has become an important marketing tool for spreading information about a product or service at easy. Sharma and Verma (Citation2018) also revealed that wiki is easy to use and interact with as long as the customer has access to network connectivity. They concluded that the use of wiki to share information about one’s product and service is crucial to reaching wide markets at relatively easy and in a convenient manner; thereby, helping to improve firm performance. Similar conclusion was drawn by Dessart et al. (Citation2015) and Rahoo et al. (Citation2018) in their assertion that web 2 technology including wiki is fast-growing and plays a valuable role in attaining high performance levels.
4.3.10. Effect of adoption of blogs on organisational performance at MTN
The study also hypothesised (H4) that, ‘adoption of blogs (BL) has a significant positive effect on organisational performance (OP) of MTN’. H4 was supported because of the following: t-stat = 2.190 > 1.96 and p-value = 0.029 < 0.05. This result suggests that BL has a significant effect on OP and the β-value of 0.110 suggests a positive but weak effect of BL on OP of MTN. The result means that BL plays a significant positive but weak role in any change in OP. Per the β-value, BL ranked ‘4th’ among the adopted web 2 technologies; suggesting that whenever MTN shares information about its products and services via blog content, it could improve its overall performance levels by 11%. Although BL had the lowest effect on OP among the other web 2 tools, it, however, improves about one-tenth of MTN’s performance in Ghana. The study’s finding implies that if MTN intends to improve its customer base or market share and number of subscribers by 11 percent, then it should continue to create blog contents to allow its customers to access the required information on the daily basis. With blogs, MTN can upload valuable information in video or text formats for its customers to benefit from. Similarly, if the company adopts blog, it would allow its customers to subscribe to its feed and get notifications whenever new information is posted or uploaded. This would continue to provide new and inspiring updates about the company’s products and services and in turn improve the company’s overall performance levels. The result indicates that hypothesis four (H4) is supported. The study’s result is in line with previous studies by Bheekharry (Citation2020), Sajjad and Zaman (Citation2020) Ďaďová and Soviar (Citation2021) who revealed that blogging has become the order of the day, especially in the marketing space, due to continuous advancement in technologies, particularly social media. They emphasised that organisations that adopt blogs and allow people to easily read and interact with their platform, their overall performance levels would improve significantly. Precisely, Agarwal (Citation2020) and Vasan (Citation2023) concluded that blogs allow customers to also post suggestions and comments for other readers or customers to benefit from and hence, allow them to make valuable and positive purchasing decisions, especially in instances where the positive comments about a firm’s products and services exceed the negative ones.
4.3.11. Moderating role of perceived ease of use in the correlation between web 2 adoption and organisational performance of MTN
This section discussed the outcome after testing the moderating role of perceived ease of use (PEOU) on the link between web 2 adoption and organisational performance of MTN. After the PLS analysis, the model’s output revealed a t-stat of 2.196 > 1.96 (p = 0.028 < 0.05) and β-value of 0.0141 to indicate ‘support’ for H5. This result means that PEOU plays a significant positive but weak role in the causal link web 2 adoption and OP of MTN. The result implies that OP would become strong rather than weak if MTN’s customers perceive the company’s web 2 tools as easy to use. Hence, for MTN’s performance levels to expand by 14.1%, then its adopted web 2 technologies should be perceived as easy to use by its customers. The study’s result implies that when customers perceive that the web 2 technologies like blogs, wiki, social networking sites and file sharing adopted by MTN are easy to use and interact with, they tend to exhibit positive purchase behaviours towards its products and services which consequently lead to improved firm performance. The result also suggests that for MTN to expand its performance levels, its adoption of web 2 technologies should be perceived as easy to use by its customers. Customers in our modern-day business environment prefer to deal with firms that adopt systems, tools or strategies they perceive as easy to use. This would then induce them to continue repurchasing those companies’ products and services and thereby, expand their profit levels and market share. The study’s result has been supported by the Technology acceptance model which posits that customers intention to and actual use of a given system, technology, product or service is predominantly triggered by the customers’ perceived ease of use and perceived usefulness. The model concludes that customers would actually embrace the web 2 tools adopted by MTN if they hold positive perceptions in terms of ease of use and usefulness. Also, previous studies have revealed that customers’ perceived ease of use of a service, innovation or product tend to trigger actual usage and invariably help organisations to attain higher performance levels. These findings support that of Amin et al. (Citation2014) who asserted that PEOU, perceived usefulness, and consumer satisfaction in an online buying environment had a favourable association. They also concluded that customers who perceive online shopping as easy to use and useful, exhibit positive post purchase behaviours such as customer satisfaction. Similarly, Wilson et al. (Citation2021), for instance, concluded that PEOU and perceived usefulness play crucial roles in improving customer satisfaction and eventually strengthening customer loyalty in China. In line with these findings, the study can conclude that when customers perceive web 2 technologies adopted by the telecommunication firms in Ghana, especially MTN, to be useful and easy to use, they would be induced to adopt them; thereby, triggering stronger firm performance.
5. Conclusions
Given the study’s key findings, the following conclusions were hereby presented: The study first found social networking sites to positively and moderately affect the performance of MTN in Ghana. This finding has largely been buttressed by related studies which concluded that the adoption of social networking sites has become inevitable when firms intend to quickly and conveniently spread information about their products and services in order to expand firm performance. It was concluded that social networking site is a key Web 2 technology that significantly and positively predicts MTN’s performance levels when adopted. Per the study’s result with respect to objective two, it was found that file sharing significantly and positively affects organisational performance at MTN Ghana. The study’s outcome implied that file sharing is an important Web 2 tool for spreading information about companies’ products and services to attract customers and invariably promote their corporate performance. The study again concluded that wiki has a positive significant effect on organisational performance at MTN. Impliedly, web 2 is growing in recognition and its adoption is crucial to reaching a large number of people; thereby, contributing to overall firm performance in terms of increasing customer base. More precisely, when people including customers have access to relevant information about a company’s packages via wiki, it could positively affect their patronage intentions and consequently expand overall firm performance. In addition, it was concluded that the performance of MTN would improve by about one-tenth if it adopts Web 2 technologies like blogs. The conclusion was drawn because previous studies have largely supported the study’s result by revealing that blogging, as a Web 2 platform, has come to stay and it plays a valuable role in the marketing space. For instance, organisations can create blog platforms to allow customers to freely post suggestions and comments after using their products which serve as electronic word of mouth and thereby serve as an important marketing platform to promote their performance levels. Finally, it was concluded that customers’ perceived ease of use with respect to the Web 2 technologies adopted by MTN contributes significantly to strengthening its overall performance in Ghana. This implies that when customers perceive a given technology or innovation as easy to use, they tend to embrace it which in turn assists the developers or providers to improve upon their performance levels. This assertion is underpinned by the technology acceptance model; hence, the study’s conclusion was appropriate.
6. Theoretical contribution
The study provides valuable contribution to theory. The study effectively combined two main theoretical frameworks, Resource-Based Theory and Technology Acceptance Model, to assess the phenomenon under study. The integration resulted in a better understanding of how telecommunication companies could leverage these technologies to achieve improved performances. The foundational premises of these theories contributed to the understanding of Web 2.0 adoption and performance in the context of telecommunication industry.
The study also provides an extension to the literature by investigating the correlation between Web 2.0 adoption and firm performance in the context of Ghana’s telecommunication industry. Earlie studies have mostly examined the individual effects of Web 2.0 tools and their effect on firms’ performances.
7. Practical implications
Policymakers should develop comprehensive policies and also direct the management of telecommunication companies to develop customer-centric strategies in order to improve customer satisfaction and organisational performance.
Firstly, policymakers including the Ministry of Communication and Digitalisation should develop comprehensive frameworks to push telecommunication companies notably MTN to continue to adopt and invest in Web 2 technologies specifically social networking sites. Management of telecommunication companies notably MTN, on the other hand, should embrace the framework and continuously devise innovative means of expanding the adoption of social networking sites for its marketing activities.
Secondly, the management of telecommunication companies like MTN should collaborate with the Ministry of Communication and Digitalisation and other relevant parties to develop software or application purposely to share video and picture contents of these companies. Also, the file sharing tool should be a convenient, accessible, informative, and low service charge to drive customers’ interests and attention in order to promote its usage and invariably help the telecommunication companies to attain higher performance. Management of the companies especially MTN should also continue to invest and expand the current file-sharing platforms in order to promote their performance levels.
Thirdly, policymakers including the Ministry of Communication and Digitalisation should collaborate with telecommunication companies to create a unique, innovative, and comprehensive wiki platform that would contain valuable information about these companies’ profiles and packages. Although MTN currently has a wiki, its awareness among customers in Ghana is generally low; hence, the management of the company should devise strategies to improve its level of awareness among its Ghanaian customers.
Fourthly, the management of MTN should continue to improve its blog platform or software to encourage its subscribers and readers to continue to post their opinions and comments about the company’s products and services after using them. Also, management should attach reward packages like free airtime or data to its blog sites or platforms to entice customers to subscribe, get notifications and also actively interact with the company via those platforms.
Lastly, management of MTN as well as the other telecommunication companies should collaborate and engage in regular public education or sensitisation campaigns to help their customers understand and know how to use the adopted web 2 tools. These campaigns or educative programmes should aim at helping subscribers understand how each of the adopted web 2 tools work and how they can be accessed and used with ease. This is because, when customers perceive the technologies as easy to use, they would be induced to make more use of them and this would go a long way to the companies’ performance.
8. Limitations of the study
Limitations are inevitable in any research regardless of its approach, design and unit of analysis. As such, although the study made valuable contributions to literature on web 2 adoption, perceived ease of use and organisational performance, it was, however, exposed to some limitations. For instance, the study’s outcomes were limited to the opinions of customers of MTN who were accessible to the researchers.
9. Suggestions for further research
Although the study’s objectives were largely attained, the study offered some suggestions for further improvement. For instance, the study collected primary data from subscribers in Ghana; hence, generalising the findings to across the entire telecommunication industry in Ghana could be misleading. In view of this, the study suggested that further research should include customers of the other networks to obtain more generalisable results. Finally, future researchers could adopt the mixed methods to obtain both qualitative and quantitative outcomes to improve existing findings.
Disclosure statement
No potential conflict of interest was reported by the author(s).
Data availability statement
The dataset used in the study may be available on request.
Additional information
Funding
Notes on contributors
Evans kofi Bediako
Evans Kofi Bediako works with MTN Ghana and holds MBA in Marketing from University of Cape Coast, Ghana. His area of specialization is in Marketing. His research interests include service marketing, customer care, digital marketing strategy, international marketing, international business and technology adoption in communication.

Eric Gonu
Eric Gonu is a lecturer in the department of marketing and supply chain management, University of Cape Coast, Ghana. He holds a Doctor of Philosophy in Business Administration. His area of specialization is in Marketing. His research interests are in the areas of service quality management, customer relationship management, social media strategy, online marketing, service marketing, relationship marketing, and digital marketing. He has a number of journal articles from reputable journals including, Cogent Business and Management, Plos One, Journal of Financial Services Marketing, Scientific African and African Journal of Business Management.
Paul Mensah Agyei
Paul Mensah Agyei holds a PhD in Marketing from the Ghana Institute of Management and Public Administration (GIMPA), Accra, Ghana, and a Master of Business Administration degree and Bachelor of Management Studies from Kenyatta University, Nairobi, Kenya and University of Cape Coast, Cape Coast, Ghana respectively. He is currently a lecturer of marketing at the University of Cape Coast, Ghana. He has a number of journal articles from reputable journals, including Industrial Marketing Management, Cogent Business and Management, European Journal of Training and Development, and International Review of Research in Open and Distributed Learning, Cogent Social Sciences, Plos One, and Cogent Education. He is also a reviewer for the Journal of African Business, the Arab Gulf Journal of Scientific Research, and the Quality Assurance in Education Journal.
Richard Kofi Opoku
Richard Kofi Opoku is a PhD (Management Science and Engineering) student at Beijing University of Chemical Technology (BUCT), Beijing, China. His research interests include procurement management, marketing management, supply chain management, risk management, and entrepreneurship.
References
- Abdelhady, M., & Ameen, F. (2022). The Socio-economic implications of tourism sharing economy. Journal of Tourismology, 8(2), 1–22. https://doi.org/10.26650/jot.2022.8.2.1104727
- Agarwal, M. (2020). Importance of user generated content as a part of social media marketing that drives customer’s brand awareness and purchase intentions. The International Journal of Analytical and Experimental Modal Analysis, 12(2), 3071.
- Aguirre‐Urreta, M. I., Rönkkö, M., & Marakas, G. M. (2016). Omission of causal indicators: Consequences and implications for measurement – A rejoinder. Measurement: Interdisciplinary Research and Perspectives, 14(4), 170–175. https://doi.org/10.1080/15366367.2016.1257323
- Ahmad, U., Huraira, A., Khan, A. A., & Sardar, S. (2022). Role of social media reviews in capturing brand trust & brand loyalty: A case of burger joints in Karachi. Sustainable Business and Society in Emerging Economies, 4(2), 303–314. https://doi.org/10.26710/sbsee.v4i2.2320
- Al-Mashraie, M., Chung, S. H., & Jeon, H. W. (2020). Customer switching behavior analysis in the telecommunication industry via push-pull-mooring framework: A machine learning approach. Computers & Industrial Engineering, 144, 106476. https://doi.org/10.1016/j.cie.2020.106476
- Alzaam, A. F., & Almizeed, K. (2021). The effect of digital marketing on purchasing decisions: A case study in Jordan. The Journal of Asian Finance, Economics and Business, 8(5), 455–463. https://doi.org/10.13106/JAFEB.2021.VOL8.NO5.0455
- Amoah, J., Jibril, A. B., & Akram, U. (2021). Social media as a promotional tool towards sme’s development: Evidence from the financial industry in a developing economy. Cogent Business & Management, 8(1), 1923357. https://doi.org/10.1080/23311975.2021.1923357
- Amin, M., Rezaei, S., & Abolghasemi, M. (2014). User satisfaction with mobile websites: the impact of perceived usefulness (PU), perceived ease of use (PEOU) and trust. Nankai Business Review International, 5(3), 258–274. https://doi.org/10.1108/NBRI-01-2014-0005
- Awan, S. H., Habib, N., Shoaib Akhtar, C., & Naveed, S. (2020). Effectiveness of performance management system for employee performance through engagement. SAGE Open, 10(4), 215824402096938. https://doi.org/10.1177/2158244020969383
- Assis, E. E., Ferreira, V. M. R., & Andrade, F. O. (2020). Blogs used as marketing tools and their influence on consumers’ decisions on purchasing fashion and beauty products. REMark, 19(3), 586. https://doi.org/10.5585/remark.v19i3.17763
- Beins, B. C., & McCarthy, M. A. (2017). Research methods and statistics. Cambridge University Press.
- Belk, R. (2014). Sharing versus pseudo-sharing in Web 2.0. The Anthropologist, 18(1), 7–23. https://doi.org/10.1080/09720073.2014.11891518
- Bheekharry, N. D. (2020). Optimising Customer Engagement through Digital Intelligence. In Advances in Digital Marketing and eCommerce (pp. 179–187). Springer. https://doi.org/10.1007/978-3-030-47595-6_22
- Bowen, J. (2015). Trends affecting social media: implications for practitioners and researchers. Worldwide Hospitality and Tourism Themes, 7(3), 221–228. https://doi.org/10.1108/WHATT-04-2015-0021
- Blasco-Arcas, L., Falkheimer, J., & Heide, M. (2022). Crisis communication in service ecosystems: perspectives and future challenges. Journal of Service Management, 33(4/5)), , 601–613. https://doi.org/10.1108/JOSM-11-2021-0436
- Cadavid, L., & Valencia-Arias, A. (2022). Analysis and categorization of studies of digital marketing in small and medium enterprises. Intangible Capital, 18(2), 263–289. https://doi.org/10.3926/ic.1809
- Caruso, S. J. (2018). Toward understanding the role of Web 2.0 technology in self-directed learning and job performance. Contemporary Issues in Education Research (CIER), 11(3), 89–98. https://doi.org/10.19030/cier.v11i3.10180
- Cepeda-Carrión, G., Hair, J. F., Ringle, C. M., Roldán, J. L., & García-Fernández, J. (2022). Guest editorial: Sports management research using partial least squares structural equation modeling (PLS-SEM). International Journal of Sports Marketing and Sponsorship, 23(2)), , 229–240. https://doi.org/10.1108/IJSMS-05-2022-242
- Chawla, D., & Joshi, H. (2021). Attitude as a mediator between antecedents of mobile banking adoption and user intention. International Journal of Business Excellence, 24(3), 321–339. https://doi.org/10.1504/IJBEX.2021.115838
- Chirumalla, K., Oghazi, P., & Parida, V. (2018). Social media engagement strategy: Investigation of marketing and R&D interfaces in manufacturing industry. Industrial Marketing Management, 74, 138–149. https://doi.org/10.1016/j.indmarman.2017.10.001
- Cohen, L., Manion, L., & Morrison, K. (2011). Research methods in education. Routledge.
- Ďaďová, I., & Soviar, J. (2021). The application of online marketing tools in marketing communication of the entities with the tourism offer in 2020 in Slovakia. Transportation Research Procedia, 55, 1791–1799. https://doi.org/10.1016/j.trpro.2021.07.170
- Djakasaputra, A., Wijaya, O., Utama, A., Yohana, C., Romadhoni, B., & Fahlevi, M. (2021). Empirical study of Indonesian SMEs sales performance in digital era: The role of quality service and digital marketing. International Journal of Data and Network Science, 5(3), 303–310. https://doi.org/10.5267/j.ijdns.2021.6.003
- Dessart, L., Veloutsou, C., & Morgan-Thomas, A. (2015). Consumer engagement in online brand communities: a social media perspective. Journal of Product & Brand Management, 24(1), 28–42. https://doi.org/10.1108/JPBM-06-2014-0635
- Dijkstra, T. K., & Henseler, J, University of Groningen. (2015). Consistent partial least squares path modeling. MIS Quarterly, 39(2), 297–316. https://doi.org/10.25300/MISQ/2015/39.2.02
- Erind, H. (2015). The technological, organizational and environmental framework of IS innovation adaption in small and medium enterprises. Evidence from Research over the Last 10 Years. International Ournal of Business and Management, 3(4), 1–14. https://doi.org/10.20472/BM.2015.3.4.001
- Etikan, I., Musa, S. A., & Alkassim, R. S. (2016). Comparison of convenience sampling and purposive sampling. American Journal of Theoretical and Applied Statistics, 5(1), 1–4. https://doi.org/10.11648/j.ajtas.20160501.11
- Evanschitzky, H., Linzmajer, M., Woisetschläger, D. M., & Basuroy, S. (2022). Retail Website Interactivity and Firm Performance. SMR-Journal of Service Management Research, 6(2), 104–117. https://doi.org/10.5771/2511-8676-2022-2
- Grudin, J., & Poole, E. S. (2010). Wikis at work: success factors and challenges for sustainability of enterprise Wikis [Paper presentation]. Proceedings of the 6th International Symposium on Wikis and Open Collaboration (pp. 1–8). https://doi.org/10.1145/1832772.1832780
- Hafez, M. (2022). Unpacking the influence of social media marketing activities on brand equity in the banking sector in Bangladesh: A moderated mediation analysis of brand experience and perceived uniqueness. International Journal of Information Management Data Insights, 2(2), 100140. https://doi.org/10.1016/j.jjimei.2022.100140
- Hair, J. F., & Alamer, A. (2022). Partial least squares structural equation modeling (PLS-SEM) in second language and education research: Guidelines using an applied example. Research Methods in Applied Linguistics, 1(3), 100027. https://doi.org/10.1016/j.rmal.2022.100027
- Hair, J. F., Astrachan, C. B., Moisescu, O. I., Radomir, L., Sarstedt, M., Vaithilingam, S., & Ringle, C. M. (2021). Executing and interpreting applications of PLS-SEM: Updates for family business researchers. Journal of Family Business Strategy, 12(3), 100392. https://doi.org/10.1016/j.jfbs.2020.100392
- Hair, J. F., Risher, J. J., Sarstedt, M., & Ringle, C. M. (2019). When to use and how to report the results of PLS-SEM. European Business Review, 31(1), 2–24. https://doi.org/10.1108/EBR-11-2018-0203
- Hair, J. F., Jr, Sarstedt, M., Ringle, C. M., & Gudergan, S. P. (2017). Advanced issues in partial least squares structural equation modelling. Sage publications.
- Harrigan, P., Daly, T. M., Coussement, K., Lee, J. A., Soutar, G. N., & Evers, U. (2021). Identifying influencers on social media. International Journal of Information Management, 56, 102246. https://doi.org/10.1016/j.ijinfomgt.2020.102246
- Henseler, J., Dijkstra, T. K., Sarstedt, M., Ringle, C. M., Diamantopoulos, A., Straub, D. W., Ketchen, D. J., Jr., Hair, J. F., Hult, G. T. M., & Calantone, R. J. (2014). Common beliefs and reality about PLS: Comments on Rönkkö and Evermann (2013). Organizational Research Methods, 17(2), 182–209. https://doi.org/10.1016/j.ijinfomgt.2020.102246
- Henseler, J., Ringle, C. M., & Sarstedt, M. (2015). A new criterion for assessing discriminant validity in variance-based structural equation modeling. Journal of the Academy of Marketing Science, 43(1), 115–135. https://doi.org/10.1007/s11747-014-0403-8
- Heredia, J., Castillo-Vergara, M., Geldes, C., Gamarra, F. M. C., Flores, A., & Heredia, W. ((2022). How do digital capabilities affect firm performance? The mediating role of technological capabilities in the “new normal”. Journal of Innovation & Knowledge, 7(2), 100171. https://doi.org/10.1016/j.jik.2022.100171
- Hudson, S., Huang, L., Roth, M. S., & Madden, T. J. (2016). The influence of social media interactions on consumer–brand relationships: A three-country study of brand perceptions and marketing behaviors. International Journal of Research in Marketing, 33(1), 27–41. https://doi.org/10.1016/j.ijresmar.2015.06.004
- Hurtado Gonzalez, J. M., Cámara, S. B., & Galán Gonzalez, J. L. (2014). Web adoption and firm performance in the fashion industry: The moderating role of social and economic rational managerial perceptions. Journal of Organizational Computing and Electronic Commerce, 24(4), 342–365. https://doi.org/10.1080/10919392.2014.956595
- Kiburu, L., Boso, N., & Njiraini, N. (2023). Exploring how social network ties moderate the relationship between consumer attitude and technology usage: empirical study of mobile banking users in Kenya. International Journal of Business and Emerging Markets, 15(4), 321–345. https://doi.org/10.1504/IJBEM.2023.134086
- Kim, H. D., Lee, I., & Lee, C. K. (2013). Building Web 2.0 enterprises: A study of small and medium enterprises in the United States. International Small Business Journal: Researching Entrepreneurship, 31(2), 156–174. https://doi.org/10.1177/0266242611409785
- Kriska, S. D., Sass, M. M., & Fulcomer, M. C. (2013). Assessing limitations and uses of convenience samples: a guide for graduate students. ScholarWorks. 2828–2834.
- Kukowska, K., & Skolik, S. (2020). The Web 2.0 revolution and knowledge sharing in formal organizations in Poland [Paper presentation]. ECKM 2020 21st European Conference on Knowledge Management (p. 447).
- Kumar, A., Bezawada, R., Rishika, R., Janakiraman, R., & Kannan, P. K. (2016). From social to sale: The effects of firm-generated content in social media on customer behavior. Journal of Marketing, 80(1), 7–25. https://doi.org/10.1509/jm.14.0249
- Marangunić, N., & Granić, A. (2015). Technology acceptance model: a literature review from 1986 to 2013. Universal Access in the Information Society, 14(1), 81–95. https://doi.org/10.1038/s41598-022-18700-z
- Mariani, M. (2020). Web 2.0 and destination marketing: current trends and future directions. Sustainability, 12(9), 3771. https://doi.org/10.3390/su12093771
- Memon, M. A., Ramayah, T., Cheah, J. H., Ting, H., Chuah, F., & Cham, T. H. (2021). PLS-SEM statistical programs: a review. Journal of Applied Structural Equation Modeling, 5(1), i–xiv. https://doi.org/10.47263/JASEM.5(1)06
- Morosan, C. (2022). Examining the impact of contact reducing technology on food purchasing during the pandemic. Journal of Foodservice Business Research, 26(6), 866–896. https://doi.org/10.1080/15378020.2022.2057175
- Moustafa, E. (2022). Prioritisation of critical factors affecting the adoption of social media using best-worst method: Evidence from SMEs in Egypt. Cogent Business & Management, 9(1), 2151184. https://doi.org/10.1080/23311975.2022.2151184
- Munar, A. M., & Jacobsen, J. K. S. (2014). Motivations for sharing tourism experiences through social media. Tourism Management, 43, 46–54. https://doi.org/10.1016/j.tourman.2014.01.012
- Nani, D. A., & Safitri, V. A. D. (2021). Exploring the relationship between formal management control systems, organisational performance and innovation: The role of leadership characteristics. Asian Journal of Business and Accounting, 14(1), 207–224. https://doi.org/10.22452/ajba.vol14no1.8
- Narayan, A., & Hungund, S. (2022). Enhancing firm performance through adoption of innovation: Empirical evidence from Indian biotechnological firms. Journal of the Knowledge Economy, 13(3), 2431–2456. https://doi.org/10.1007/s13132-021-00821-x
- National Communications Authority. (2021). Annual Report on the Ghana’s telecommunication industry. NCA.
- Nisar, T. M., & Whitehead, C. (2016). Brand interactions and social media: Enhancing user loyalty through social networking sites. Computers in Human Behavior, 62, 743–753. https://doi.org/10.1016/j.chb.2016.04.042
- Pelet, J. E. (Ed.). (2020). Handbook of research on user experience in web 2.0 technologies and its impact on universities and businesses. IGI Global.
- Prasad, S. (2021). Blogging effects across supplier, retailer, and customer. Journal of Marketing Communications, 27(1), 1–19. https://doi.org/10.1080/13527266.2019.1609569
- Rahoo, L. A., Baladi, Z. H., Arshad, S., Nagar, M. A. K., & Rustamani, S. (2018 Use of web 2.0 tools for marketing and promotion of library services in higher education institutes of Sindh [Paper presentation]. 2018 IEEE 5th International Conference on Engineering Technologies and Applied Sciences (ICETAS) (pp. 1–5). IEEE. https://doi.org/10.1109/ICETAS.2018.8629175
- Rogerson, A. M., & Basanta, G. (2016). Peer-to-peer file sharing and academic integrity in the internet age. In Handbook of Academic Integrity (pp. 273–285). Springer Singapore. https://doi.org/10.1007/978-981-287-098-8_55
- Rosman, R., & Stuhura, K. (2013). The implications of social media on customer relationship management and the hospitality industry. Journal of Management Policy and Practice, 14(3), 18–26.
- Sadiq, M. W., Hameed, J., Abdullah, M. I., & Noman, S. M. (2020). Service innovations in social media & blogging websites: enhancing customer’s psychological engagement towards online environment friendly products. Revista Argentina de Clínica Psicológica, 29(4), 677–699. https://doi.org/10.24205/03276716.2020.873
- Sahibzada, U. F., Jianfeng, C., Latif, K. F., Shah, S. A., & Sahibzada, H. F. (2020). Refuelling knowledge management processes towards organisational performance: mediating role of creative organisational learning. Knowledge Management Research & Practice, 21(1), 1–13. https://doi.org/10.1080/14778238.2020.1787802
- Sajjad, M., & Zaman, U. (2020). Innovative perspective of marketing engagement: Enhancing users’ loyalty in social media through blogging. Journal of Open Innovation: Technology, Market, and Complexity, 6(3), 93–105. https://doi.org/10.3390/joitmc6030093
- Salaria, N. (2012). Meaning of the term descriptive survey research method. International Journal of Transformations in Business Management, 1(6), 1–7.
- Saldanha, T. J., & Krishnan, M. S. (2012). Organizational adoption of web 2.0 technologies: An empirical analysis. Journal of Organizational Computing and Electronic Commerce, 22(4), 301–333. https://doi.org/10.1080/10919392.2012.723585
- Sarstedt, M., Hair, J. F., Pick, M., Liengaard, B. D., Radomir, L., & Ringle, C. M. (2022). Progress in partial least squares structural equation modeling use in marketing research in the last decade. Psychology & Marketing, 39(5), 1035–1064. https://doi.org/10.1002/mar.21640
- Scancom PLC. (2021). MTN Ghana’s performance for the six-month period ended 30 June 2021. MTN Ghana.
- Shahreki, J., Nakanishi, H., Jayiddin, N. F., & Ibrahim, N. F. (2020). Technology and the HR field: the growth of human resource information systems. Journal of Soft Computing and Decision Support Systems, 7(2), 7–18.
- Sharma, S., & Verma, H. V. (2018). Social media marketing: Evolution and change. In Social media marketing (pp. 19–36). Palgrave Macmillan. https://doi.org/10.1007/978-981-10-5323-8_2
- Shuen, A. (2018). Web 2.0: A Strategy Guide: Business thinking and strategies behind successful Web 2.0 implementations. O’Reilly Media.
- Siamagka, N. T., Christodoulides, G., Michaelidou, N., & Valvi, A. (2015). Determinants of social media adoption by B2B organizations. Industrial Marketing Management, 51, 89–99. https://doi.org/10.1016/j.indmarman.2015.05.005
- Singh, J. B., Chandwani, R., & Kumar, M. (2018). Factors affecting Web 2.0 adoption: exploring the knowledge sharing and knowledge seeking aspects in health care professionals. Journal of Knowledge Management, 22(1), 21–43. https://doi.org/10.1108/JKM-08-2016-0320
- Somsuk, N., Wonglimpiyarat, J., & Laosirihongthong, T. (2012). Technology business incubators and industrial development: Resource-based view. Industrial Management & Data Systems, 112(2), 245–267. https://doi.org/10.1108/02635571211204281
- Sujati, H. (2021). Assessing the discriminant validity of the curiosity scale using confirmatory factor analysis. In Educational Innovation in Society 5.0 Era: Challenges and opportunities (pp. 60–63). Routledge.
- Tafesse, W. (2020). YouTube marketing: How marketers’ video optimization practices influence video views. Internet Research, 30(6), 1689–1707. https://doi.org/10.1108/INTR-10-2019-0406
- Tajvidi, R., & Karami, A. (2017). The effect of social media on firm performance (in press, corrected proof). Computers in Human Behavior, 3(6), 1–18. https://doi.org/10.1016/j.chb.2017.09.026
- Trainor, K. J., Andzulis, J. M., Rapp, A., & Agnihotri, R. (2014). Social media technology usage and customer relationship performance: A capabilities-based examination of social CRM. Journal of Business Research, 67(6), 1201–1208. https://doi.org/10.1016/j.jbusres.2013.05.002
- Trizano-Hermosilla, I., & Alvarado, J. M. (2016). Best alternatives to Cronbach’s alpha reliability in realistic conditions: congeneric and asymmetrical measurements. Frontiers in Psychology, 7, 769. https://doi.org/10.3389/fpsyg.2016.0076
- Vasan, M. (2023). Impact of promotional marketing using Web 2.0 tools on purchase decision of Gen Z. Materials Today: Proceedings, 81, 273–276. https://doi.org/10.1016/j.matpr.2021.03.188
- Wamba, S. F., & Carter, L. (2016). Social media tools adoption and use by SMEs: An empirical study. In Social media and Networking: Concepts, methodologies, tools, and applications (pp. 791–806). IGI Global. https://doi.org/10.4018/978-1-4666-8614-4.ch035
- Wetzels, Odekerken-Schröder, van Oppen. (2009). Using PLS path modeling for assessing hierarchical construct models: Guidelines and empirical illustration, MIS Quarterly, 33(1), 177–195. https://doi.org/10.2307/20650284
- Wilson, N., Keni, K., & Tan, P. H. P. (2021). The role of perceived usefulness and perceived ease-of-use toward satisfaction and trust which influence computer consumers’ loyalty in China. Gadjah Mada International Journal of Business, 23(3), 262–294. https://doi.org/10.22146/gamaijb.32106
- Zahoor, S. Z. (2022). Analysing the effect of social media on customer equity: a study of fast-food restaurants. Vision. https://doi.org/10.1177/09722629221107228
- Zhang, M., Guo, L., Hu, M., & Liu, W. (2017). Influence of customer engagement with company social networks on stickiness: Mediating effect of customer value creation. International Journal of Information Management, 37(3), 229–240. https://doi.org/10.1016/j.ijinfomgt.2016.04.010