
ABSTRACT
Myocardial ischemia/reperfusion (I/R) injury is exacerbated in diabetic individuals and animal models. We tested whether autophagy is an important cellular determinant of cell death. First, we utilized a cellular model of hypoxia reoxygenation (H/R) in H9c2 cells cultured in low or high glucose (HG) and tested cell death using flow cytometry to detect Annexin-V and propidium iodide, imaging cell viability ReadyProbe and lactate dehydrogenase release. We observed that cell death induced by H/R was enhanced by HG. Kinetic analysis of caspase-3 activity using a fluorescence reporter probe, stable expression of the VC3AI biosensor and western blotting indicated that H/R induced activation of caspase-3 was enhanced by HG. Temporal autophagy flux analysis using DapRed and DalGreen probes indicated an initial increase in response to H/R that was reduced upon prolonged (24h) R. HG suppressed this induction of autophagy. This was verified using LC3 HiBiT reporter assay, tandem-fluorescent LC3, and western blotting. Lysosomal cathepsin activity was also elevated at 6h and suppressed at 24h R. Autophagy-deficient cells were generated via CRISPR-mediated knockout of atg7 and the effect of combined HG and H/R treatment on caspase activation and cell death was elevated in comparison with wild type cells. We then performed coronary artery ligation surgery to induce ischemia, followed by reperfusion, in wild-type or streptozotocin (STZ)-induced hyperglycemic mice. Non-invasive 3-dimensional imaging using fluorescence molecular tomography combined with computerized tomography was employed to monitor spatio-temporal activation of cardiac autophagy and apoptosis. Upon systemic injection of a near infra-red cathepsin activatable probe we found that hyperglycemic mice had lower activity in the infarct region after I/R versus wild type. In parallel, we observed a higher extent of I/R-induced apoptosis, detected with an annexin-V probe, in hyperglycemic mice. Collectively, these results revealed that impaired autophagic flux in the presence of high glucose levels exacerbates I/R injury.Abbreviation: satg7, autophagy-related 7; FMT, fluorescence molecular tomography; HG, high glucose; H/R, hypoxia/reoxygenation; I/R, ischemia/reperfusion; LC3, MAP1LC3; N, normoxia; NG, normal glucose; NIR, near-infrared; p62, SQSTM1; STZ, streptozotocin.
Introduction
Although improved strategies to decrease reperfusion injury have decreased mortality in non-diabetic patients after myocardial infarction (MI), there is a need for improved approaches to attenuate post-MI heart failure in diabetics [Citation1–3]. Effective therapeutic interventions are currently limited [Citation4–6]. Mechanisms leading to exacerbated post-MI remodeling and poor outcomes in diabetic patients are incompletely understood, although hyperglycemia can be a key determinant of outcomes [Citation7,Citation8].
Autophagy serves as a dynamic degradative recycling system that produces new building blocks and energy for cellular renovation and homeostasis [Citation9]. Nevertheless, autophagy may be regarded as a double-edged sword with potential beneficial and detrimental effects in the heart [Citation10]. At low levels, autophagy plays an important role in recycling damaged organelles and nutrients, however excessive autophagy contributes to tissue dysfunction such as cell death [Citation11]. Excessive degradation of critical cellular proteins and organelles can consequently lead to cardiac atrophy [Citation12,Citation13]. Furthermore, changes in autophagy at distinct stages of cardiac injury can be important in dictating the final functional consequence [Citation14] and a detailed temporal analysis of this process is desirable. Sufficient myocardial autophagy as an adaptive response to stress, such as I/R and pressure overload, is important for maintaining cardiac function [Citation15–18]. Disruption of autophagy by cardiac-specific knockdown of ATG5 in adult mice led to cardiomyopathy, age-induced cardiac dysfunction, and decreased survival [Citation16,Citation19]. One of the most important remodeling events upon I/R injury that is regulated by autophagy is cardiomyocyte cell death [Citation20,Citation21].
Studies establishing that autophagy has an important role in development of heart failure make it a valid therapeutic target [Citation22,Citation23]. Although there has been extensive study of autophagy in the context of ischemia, with or without reperfusion, the question of whether autophagy in ischemia reperfusion injury is adaptive or detrimental remains controversial [Citation24–30]. It is well recognized that diabetic patients endure greater post MI heart failure-associated morbidity compared with nondiabetics, with poorer outcomes even after successful reperfusion [Citation31–34]. Mechanistically, accumulating evidence suggests that autophagic flux is impaired in diabetes due to excessive ROS production, lipid-induced impairment of lysosomal function, insulin resistance and impaired activation of mTORC1 and AMPK [Citation35–37]. It is thus imperative to understand the temporal and spatial interplay between diabetes induced and I/R induced autophagy alterations, and the resultant cell death in the heart.
The lack of existing methodologies for the non-invasive determination of autophagy in live rodent models have been a significant limitation to this field. Although immunodetection of various autophagy markers by western blot, detection of LC3 puncta by immunofluorescence, and identification of autophagosomes by transmission electron microscopy (TEM) have thus far been able to provide indices of autophagic flux, these invasive approaches necessitate the use of large numbers of experimental animals. The upregulation of cathepsin activity in the lysosomal compartment during autophagy, and evidence suggests that increased cathepsin activity was found in ischemic heart which showed pro-survival effect [Citation38–40]. So, we have applied a novel approach using fluorescence molecular tomography (FMT) to non-invasively measure cathepsin activity as a biomarker of autophagy in mice [Citation41]. This involves the use of a cathepsin-activatable near infra-red probe, which can be imaged non-invasively using FMT and quantification of probe intensity is indicative of the level of autophagy in vivo [Citation41]. We acknowledge that, akin to other available methods, this is not a direct measure of autophagy, yet we believe that it is a large step forward given the limited approaches available to researchers for in vivo analysis of autophagy. This method can be used as a non-invasive temporal screening approach and additional insight gained at a particular time-point when used in combination with established assays.
Here, we established in vitro and in vivo models to examine direct effects of hyperglycemia and I/R on autophagy flux in cardiomyocyte and its significance in cell death. We hypothesized that I/R induced cell death in mice was limited via induction of autophagy as a self-protective mechanism. Furthermore, we postulated that the extent of autophagy induced by I/R would be attenuated in diabetic mice, leading to exaggerated cell death and cardiac dysfunction. We used H/R and supplementation with high glucose in H9c2 cells as a cellular model and performed temporal analysis of autophagy and apoptosis, and determined the functional significance of autophagy using autophagy-deficient CRISPR-mediated atg7 KO cells.
Results
High glucose enhanced hypoxia-reoxygenation induced cell death
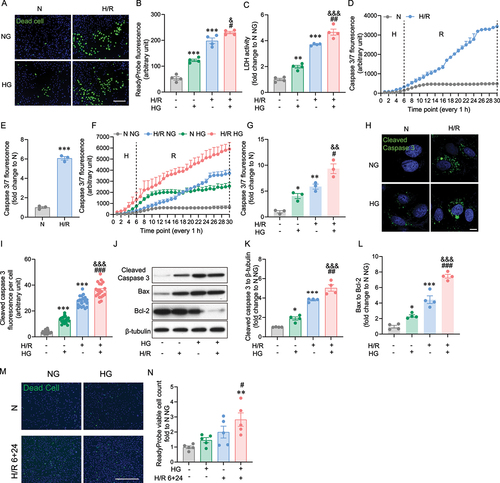
We used a cellular model of H9c2 cells derived from rat ventricle and subjected to hypoxia (H: 1 % O2) for 6 h and followed with up to 24 h reoxygenation (R: 20 % O2) as an in vitro model. Cell death was first assessed using ReadyProbe Cell Viability assay as previously reported [Citation42], using a fluorescent reagent which can only bind to DNA in cells with compromised plasma membrane integrity, and thus allowed visualization of dead cells. High glucose (HG) alone induced a significant increase in cell death compared with normal glucose (NG) (). A higher extent of cell death was induced by hypoxia/reoxygenation (H/R) and this was exacerbated in the presence of HG (). A similar trend was observed using lactate dehydrogenase (LDH) release as a measure of cell death (). Then, temporal analysis of caspase 3 activation was performed using an activatable fluorescent probe to determine induction by H/R. Activation of caspase 3 initiated from the end of hypoxia (H) and rapidly increased during the reoxygenation (R) phase (blue) compared to normoxia (N: grey), as shown in with the quantitative difference at 30 h shown in . We then examined the effect of HG and observed that HG alone (green) increased caspase 3 activation compared to normal glucose (NG) during normoxia (grey), although both plateaud after around 10–12 h (). The activation of caspase 3 by H/R in HG (red) was significantly greater compared to H/R under NG conditions (blue) and it is interesting to note a continuing increased trend throughout the 30 h period studied (). To further confirm our results with the caspase 3 activatable probe, we engineered H9c2 cells to stably express a caspase activity reporter VC3AI [Citation43]. In line with the kinetic studies presented above, caspase 3 activity was increased upon H/R challenge and further enhanced in the presence of HG (). Caspase-3 activation was also assessed by western blot and show representative blot and quantitation showing an increase upon HG and H/R, the latter being enhanced when combined with HG. These differences are also reflected in an altered Bax:Bcl-2 expression ratio (). To further validate the findings in H9c2 cell line, we applied human induced pluripotent stem cell (iPSC) derived cardiomyocyte as it’s well established supplementing the in vitro study of cardiac ischemia/reperfusion model [Citation44,Citation45], and we performed high glucose and hypoxia reoxygenation treatment in line with the in vitro experiments with H9c2 cells line. Specifically, iPSC-cardiomyocyte was treated with or without high glucose 24 hours before 6+24 hours H/R or normoxia incubation. Cell death analysis by ReadyProbe staining revealed that the significant increase of cell death was shown in HG H/R 6+24 h (). Overall, the results of iPSC-cardiomyocyte in profiling autophagy upon HG NG H/R 6+24 h are consistent with the results measured in H9c2 cell line.
Figure 1. Hypoxia/reoxygenation-triggered cell death was elevated by the presence of high glucose. A Representative image of H9c2 cells stained with ReadyProbe (green) after H/R or N incubation with or without HG. B Quantification of dead cells from A. C LDH measurement at the time point of 6+24 H/R or N with or without HG. D Caspase 3/7 fluorescence was measured for every 1 h in 6 h hypoxia and 24 hours reoxygenation or 30 h normoxia conditions, data were presented as 3 technical replicates. E Caspase 3/7 fluorescence density at the 30-hour end point of H/R or N. Data represented the mean of 3 biological replicates. F Caspase 3/7 fluorescence was measured for every 1 h in 6 h hypoxia and 24 h reoxygenation or 30 h normoxia conditions with or without HG (25 mM glucose), results represented the mean of 3 biological replicates. G Caspase 3/7 fluorescence density at the end point of H/R or N, with or without HG. Data were presented as 3 biological replicates. H Representative confocal microscope images of H9c2 cells stably expressing VC3AI showing cleaved caspase 3 (green) after H/R (6 hours hypoxia and 24 hours reoxygenation, 6+24 h) or N (30 hours reoxygenation). I Quantification of cleaved caspase 3 per cell from H. J-L Representative western blot images and quantification of cleaved caspase 3, Bax, Bcl-2 and β-tubulin expression in H9c2 cells subjected to 6+24 H/R or N with or without HG. M Representative image of iPSC-cardiomyocytes stained with ReadyProbe (green) after H/R or N incubation with or without HG. N Quantification of panel. Results are presented as mean ± SEM (n = 4 per group) in panel A to L. For panel M-N results are presented as mean ± SEM of n = 3-16 technical replicates. *P < 0.05, **P < 0.01, ***P < 0.001 versus N NG, &P <0.05 versus N HG, #P < 0.05, ##P < 0.01, ###P < 0.001 versus H/R NG. Unpaired T Test was used for statistical analysis for . Ordinary One-way ANOVA with Tukey’s multiple comparison test was run for the rest of statistical analysis. Scale bar: 65 µm in panel A, M, 10 µm in panel H.
Autophagic flux was blocked by prolonged hypoxia reoxygenation and was aggravated by the presence of high glucose
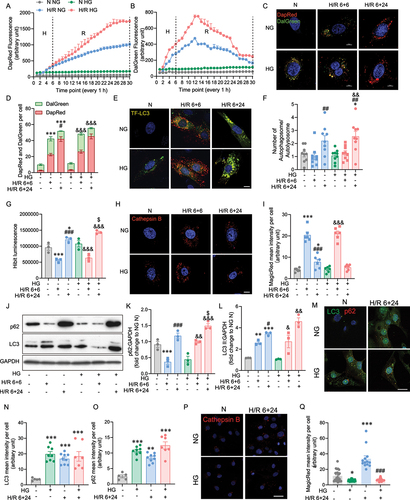
To elucidate the dynamic changes of autophagy, we established and validated various autophagy assays in H9c2 by using autophagy activator rapamycin, and inhibitor chloroquine (Supplementary Figure 4). We next monitored autophagic flux during H/R in hyperglycemic H9c2 cells using the DapRed and Dalgreen photoprobes. DapRed labels both autophagosomes and autolysosomes by incorporating into the autophagosome during double membrane formation via structural features, and then emits fluorescence under hydrophobic conditions [Citation46]. DalGreen also labels autophagosomes during initiation, but only fluoresces strongly during the autolysosome stage, thereby, in combination the comparison of the two dyes allows one to count autophagosomes and autolysosomes [Citation47] (Supplementary Figure 4 A-B). Autophagy flux was activated in the hypoxia phase (H 6 h), and early reoxygenation phase (H 6 h, R 6 h, 6+6 h), as manifested by an increase in autophagosome number scored by DapRed and autolysosome number scored by both DapRed and DalGreen shown by yellow puncta in the green and red channels (). However, with prolonged reoxygenation (H 6 h, R 24 h, 6+24 h), autophagosome formation remained on an upward trajectory indicated by DapRed fluorescence, while autolysosome numbers declined at the midpoint of reoxygenation indicated by a drop in DalGreen fluorescence. This indicated autophagy flux was disrupted by prolonged H/R (). In accordance with the kinetic study, an increase in LC3II protein levels and a decrease in p62 protein levels were observed following short-term (6+6 h) exposure to the hypoxic and oxygenic conditions. In contrast to short H/R, p62 levels were significantly increased following prolonged H/R 6+24 h. The increase in both p62 and LC3II protein levels following prolonged H/R indicates that the degradation of p62 by autophagy was disrupted per se, since only autophagosomes were accumulating (Figure S1 A, B and C). These results indicate that the autophagy flux in H9c2 cells is blocked following prolonged H/R, contrary to the activated autophagy flux induced by H. Next, we sought to determine if the effects of H/R on autophagy can be affected by HG. In comparison with NG, the results suggested that during hypoxic and early reoxygenation conditions, autophagic flux significantly increased as indicated by DapRed and DalGreen upon HG treatment (). But by the midpoint of prolonged reoxygenation, autophagy flux was declining due to a drop in autolysosome numbers. To further track the autophagic flux following exposure to H/R conditions, a tandem GFP-RFP-LC3 plasmid was introduced into H9c2 cell. The tandem fluorescence tagged LC3 showed a GFP and RFP signal before autophagosomes fuse with lysosomes, and exhibited only the RFP signal subsequently, which allowed us to track autophagic flux [Citation48] (Supplementary Figure S4C,D). Upon initiation of hypoxia, we observed comparable numbers of yellow puncta were induced following prolonged H/R conditions (6+24 h), whereas short term H/R (6+6 h) induced much greater numbers of red puncta than green puncta resulting from effective quenching of green signals by acidic autolysosomes. The decrease was further enhanced in the HG condition (). In addition, HG pre-treatment alone had no significant impact on autophagic flux (). Quantitative autophagy flux was further measured by a modified H9c2 cell line, with a genetically encoded LC3 HiBiT reporter (). When autophagosomes fuse with lysosomes to form autolysosomes, both cargo material and the captured LC3 HiBiT reporter will be degraded (Supplementary Figure 4 G-H). Quantification of the HiBiT signal was decreased in short-term H/R but elevated by long-term H/R in either NG or HG conditions, increased autophagy flux in during hypoxia, but reduced flux compared to normoxia by the end of the 24 h reoxygenation phase. To clarify whether lysosome activity was decreased in response to prolonged H/R, we examined cathepsin B with MagicRed dye. The substrates in this dye fluoresce red upon cleavage by active cathepsin enzymes present in the autolysosomes (Supplementary Figure 4E–F). Autolysosomal activity was increased during H/R 6+6 h, then impaired during H/R 6+24 h, with both NG and HG () which is consistent with the findings with DalGreen, TF-LC3 and HiBiT. This finding was further supported by increased LC3II and p62 protein levels in prolonged H/R incubation (). Overall, these data indicate that the autophagy flux in H9c2 is blocked following exposure to extended H/R conditions and by some measures is exacerbated by HG treatment. The role of autophagy was also evaluated in iPSC-cardiomycte. Specifically, iPSC-cardiomyocytes were treated with or without HG 24 hours before 6+24 hours H/R or normoxia incubation. Immunofluorescent detection of LC3 and p62 in iPSC-cardiomyocytes showed significantly increased in both LC3 and p62 upon HG N, NG H/R 6+24 h and HG H/R 6+24 h, indicating the disruption of autophagic flux (, and Supplementary Figure 5 A). MagicRed staining as an indicator of cathepsin B activity showed significant decrease in N HG and increase in H/R 6+24 h compared to NG N, as well as significant decrease in HG H/R 6+24 h compared to NG H/R 6+24 h ().
Figure 2. The role of high glucose in hypoxia reoxygenation induced autophagic flux impairment. A DapRed and B DalGreen fluorescence was measured for every 1 hour in 6 hours hypoxia and 24 h reoxygenation or 30 h normoxia conditions, results represented the mean of 3 biological replicates. C Representative confocal microscope images of H9c2 cells stained with DapRed and DalGreen in normoxia or H/R 6+6 h or H/R 6+24 h conditions with or without HG. D Quantification of fluorescence intensity of DapRed and DalGreen per cell. E Representative confocal microscope images of TF-LC3 H9c2 cells in normoxia or H/R 6+6 h or H/R 6+24 h conditions with or without HG. F Quantification of autophagosome and autolysosome per cell. G Luminescence of the HiBiT-LC3 reporter cell. H Representative confocal microscope images of Cathepsin B activity illuminated using MagicRed in H9c2 cells in normoxia or H/R 6+6 h or H/R 6+24 h conditions with or without HG. I Quantification of MagicRed mean intensity per cell in H9c2 cells subjected to 6+6, 6+24 H/R or N with or without HG. J-L Representative western blot images and quantification of p62 and LC3 expression of H9c2 subjected to N, H/R 6+6 h, H/R 6+24 h, treated with or without high glucose. M Immunofluorescence staining of LC3 (green) and p62 (red) in iPSC-cardiomyocytes subjected to H/R 6+24 with or without HG treatment. N-O Quantification of LC3 and p62 mean intensity per cell. P Representative confocal microscope images of Cathepsin B activity illuminated using MagicRed in iPSC-cardiomyocytes in normoxia or H/R 6+24 h conditions with or without HG. Q Quantification of MagicRed mean intensity per cell in iPSC-cardiomyocytes subjected to 6+24 H/R or N with or without HG. Results are presented as mean ± SEM (n = 3-5 per group) from panel A to L. *P < 0.05, **P < 0.01, ***P < 0.001 versus NG N, &P < 0.05, &&P < 0.01, &&&P < 0.001 versus HG N, #P < 0.05, # #P < 0.01, ###P < 0.001 versus NG H/R 6+6 h, $P < 0.05, $$P < 0.01, $$$P < 0.001 versus NG H/R 6+24 h. For panel M-Q results are presented as mean ± SEM of n = 3-16 technical replicates. Ordinary One-way ANOVA with Tukey’s multiple comparison was run for statistical analysis. Scale bar: 10 µm
Cell death induced by hypoxia/ reoxygenation was worsened in an autophagy deficient H9c2 cell line
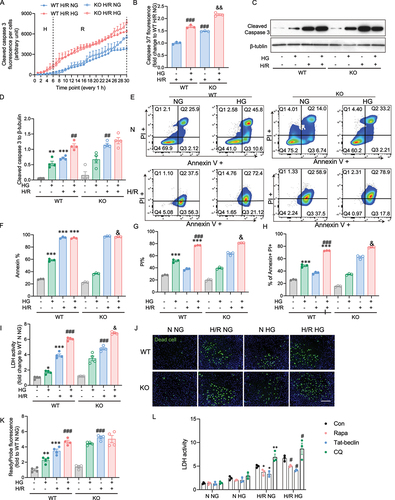
To confirm that autophagy flux induced by prolonged H/R and HG leads to cardiomyoblast apoptosis through the autophagy process, we measured cell viability and apoptosis subjected to H/R and HG when the autophagy process was deficient, by utilizing CRISPR-mediated, atg7 knockout (KO) H9c2 cell line versus wild type (WT) cells. First, we found that in line with WT, the atg7 KO cell demonstrated increased caspase 3 activation upon H/R with or without HG, whereas a significant difference was observed by the 30 h endpoint (). Under normoxia conditions only, HG activates Caspase 3 cleavage in both WT and atg7 KO cells, but by the 30 h endpoint, this activation was slightly and significantly higher in agt7 KO compared to WT cells (Figure S2 A and B). Cleaved caspase 3 protein expression was detected to confirm our observation in the temporal study. When autophagy was blocked, cleavage of caspase 3 significantly increased in the cells subjected to prolonged H/R, but no differences were seen between the NG and HG conditions with H/R in WT and KO cells (). Cell death was further examined by flow cytometry using Annexin V, a marker for early apoptosis, and PI, a marker for necrosis or late apoptosis. Our findings demonstrated that in WT cells, H/R (6 + 24 h) induced early apoptosis indicated by Annexin V + and late apoptosis indicated by Annevin + PI + regardless of NG or HG. (). Late apoptosis in H/R of the Atg7 KO cells was increased in Agt7 KO cells when HG was present (). Using the LDH release and ReadyProbe Cell Viability kit, we observed similar findings (). To further evaluate the role of autophagy in protecting against cell death induced by H/R and HG, the autophagy inducers rapamycin and Tat-beclin, or the autophagy inhibitor chloroquine was pretreated before H9c2 cells were subjected to HG and H/R challenge. Data suggested that when autophagic flux was blocked, cell death was exacerbated upon HG H/R 6+24 h, while cell death was decreased with the activation of autophagy (). From the data obtained in WT and atg7 KO, our results suggest that an intact autophagy response helped reduce cardiomyoblast death following H/R, HG and their combination.
Figure 3. atg7 KO-mediated inhibition autophagy exacerbates cardiomyoblast death induced by hypoxia-reoxygenation and high glucose. A Caspase 3/7 fluorescence was measured every 1 hour in 6 hours hypoxia and 24 hours reoxygenation of WT and atg7 KO cells. Data were presented as 3 technical replicates. B Caspase 3/7 fluorescence density at the endpoint of H/R. Results represented the mean of 3 biological replicates. C-D Representative western blot images and quantification of cleaved caspase 3 and β-tubulin expression in WT and atg7 KO cells subjected to 6+24 H/R or N with or without HG. E-G Flow cytometry in WT and Aatg7 KO cells after 6+24 H/R or N incubation with or without HG stained with PI and Annexin. H LDH release measurement. J-K Representative images of WT and atg7 KO stained with cell death marker, ReadyProbe (green) after 6+24 H/R or N incubation with or without HG. L LDH activity of H9c2 cell treated with rapamycin, Tat-beclin, or chloroquine and subjected to H/R 6+24 or N, with or without HG. Results of ReadyProbe fluorescence are presented as mean ± SEM (n=3 per group). *P < 0.05, **P < 0.01, ***P < 0.001 versus WT NG N, #P < 0.05, ##P < 0.01, ###P < 0.001 versus WT NG H/R, &P < 0.05, &&P < 0.01, &&&P < 0.001 versus WT HG H/R. Ordinary One-way ANOVA with Tukey’s multiple comparison was run for statistical analysis. Scale bar: 65 µm.
Use of fluorescent molecular tomography to examine I/R-induced cardiac autophagy and apoptosis
To assess the effect of hyperglycemia and ischemic injury on cardiac remodeling and function, wild-type C57BL/6 mice were injected with streptozotocin (STZ) or vehicle (PBS). After 4 days, mice that had blood glucose levels > 15mmol/L were deemed hyperglycemic and randomized further to undergo I/R surgery followed by FMT imaging and biochemical analysis, as described (). Importantly, micro-computed tomography (microCT) imaging allowed us to visualize the heart in 3-dimensional space to accurately define a ROI encompassing the heart for in vivo imaging (). FMT simultaneously assessed the degree of autophagy and apoptosis activity in the heart in vivo using two Near-infrared (NIR) probes designed to produce fluorescence localized to areas of specified activity: Cathepsin B to determine autophagic flux, and Annexin V (Annexin 750) to identify regions of apoptosis. A representative image is shown in with the selection of a ROI that identifies the myocardium only. Signal from cathepsin B activity and annexin V binding is also evident. Serial coronal-slices through the heart from dorsal to ventral and sagittal slices from left to right aspect show localization of cathepsin B and annexin V within that ROI (). In vivo temporal FMT analysis (24, 48 and 72 h of reperfusion after ischemia) were performed to detect cathepsin B activity and annexin V binding in the heart. Using CT co-registration as in , a spherical ROI denoted by purple wireframe was constructed for quantitative analysis (). The same mouse was assessed for cathepsin B activity and annexin V binding at successive time-points. Representative images together with quantitative analysis of whole-heart ROI 24, 48 and 72 h post-I/R indicate that cathepsin B activity is reduced in STZ-induced diabetic mice in comparison to control mice at all time-points (). Furthermore, mean values of annexin V binding were increased in hearts from STZ-induced diabetic mice at all time-points compared to the values observed in control mice (). In addition, representative myocardium ROIs 72 h post I/R surgery are shown with serial optical sections (), again highlighting the decreased Cathepsin B activity and increased annexin V binding in STZ-induced diabetic hearts. Interestingly, this indicated that while annexin V binding was primarily localized to the area-at-risk, Cathepsin B activity exhibited more broadly throughout the heart.
Figure 4. Molecular imaging of autophagy and apoptosis in the myocardium. A Experimental protocol where all mice received one single high dose streptozotocin (STZ) via intraperitoneal injection to induce diabetes, or a vehicle control injection. Four days post-STZ injection, mice were infused with Cathepsin B 680 and Annexin V 750 near-infrared (NIR) probes via jugular vein cannula as described in the Methods. Mice then underwent 35 min ligation of the left anterior descending artery followed by 24-72 h of reperfusion as indicated. Non-invasive fluorescence molecular tomography (FMT) immediately followed by computed tomography (CT) imaging was performed 24, 48, and 72 h post-ischemia. B FMT and CT co-registration was used to accurately localize NIR probe activity within the myocardium. A mouse is shown with a region of interest (ROI) tightly restricted to the myocardium with detected signals from Cathepsin B 680 and Annexin V 750. C Serial coronal-slices through the heart from dorsal to ventral and sagittal-slices from left to right aspect show distinct localization of Cathepsin B 680 and Annexin V 750. D FMT quantification of whole-heart ROI at 24, 48, and 72h post-I/R shows Cathepsin B activity is reduced in diabetic mice at all time-points compared to vehicle-injected mice. E FMT quantification of whole-heart ROI 24, 48, and 72h post-I/R shows that Annexin V binding is increased in both conditions, over-time, however, the increasing slope for hyperglycemia is comparably higher than vehicle injected mice. F Representative myocardium ROIs of 72h post I/R surgery are shown with serial optical sections. ROIs were determined by CT-FMT co-registration and the coronal sections for Cathepsin B 680 and Annexin V 750 from FMT files were displayed from dorsal to ventral. G and H show images captured from ex vivo hearts indicating spatially localized activation of Cathepsin B and binding of Annexin V after cardiac ischemia and 72 h of reperfusion. In E-F, n = 3~8, * indicates P < 0.05 vs control at respective time points. Ordinary one-way ANOVA with Tukey’s multiple comparison was run for statistical analysis.
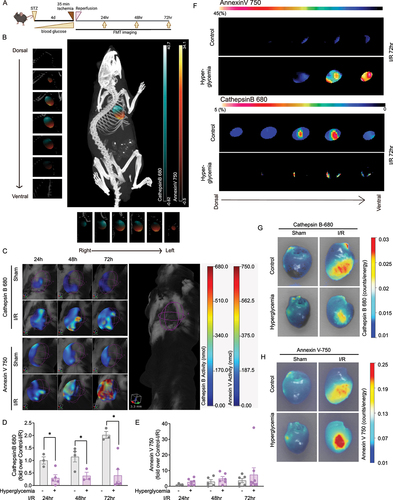
Next, we performed ex vivo FMT analysis of hearts from control and hyperglycemia mice subjected to ischemia and 72 h reperfusion. This had the advantage of minimizing scatter from surrounding tissue. Representative images of hearts isolated from control or STZ-induced diabetic mice after sham or ischemia surgery with 72 h of reperfusion are shown in . Here, it is important to note that the isolation process itself did not elevate Cathepsin B and Annexin V activities in sham hearts. Compared to in vivo FMT, these images confirmed that Cathepsin B activity was attenuated and annexin V binding was elevated in the infarct region of STZ-induced diabetic mouse hearts relative to control mice (). Quantitation of these signals in the infarct region of interest is shown in Supplementary Figure 3.
Histological and functional analysis in the heart
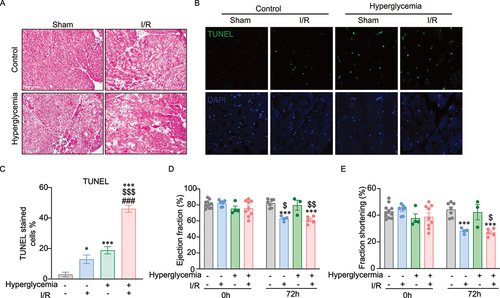
Myocardial apoptosis was further investigated via an established histological approach. presents H&E staining of tissue sections from control and STZ-induced diabetic mice after sham surgery or ischemia with 72 h reperfusion. Morphological changes consistent with cardiac hypertrophy, indicated by nuclei enlargement, cardiomyocyte loss and tissue injury, were observed. This trend was mirrored by TUNEL analysis to detect DNA damage in tissue sections, with representative images and quantitative analysis shown in . Heart function was assessed immediately before I/R surgery and again 72 h post-I/R ). Transthoracic ultrasound echocardiographic analysis showed a significant reduction in fractional shortening (%FS) and ejection fraction (%EF), the principal indicators of cardiac contractile function, in mice 72 h post-I/R when compared to sham operated mice. At this timepoint, there was no detectable difference in cardiac function between control and hyperglycemic mice.
Figure 5. Histological and functional analysis of cell death in mouse hearts. A Representative H&E-stained images showing tissue morphology in control and hyperglycemic mice after sham surgery or ischemia followed by 72 h reperfusion. B-C Cell death in heart tissue sections was detected by TUNEL staining. Representative images and quantification analysis in a graph are shown here. D-E Cardiac function was assessed by fractional shortening (FS) and ejection fraction (EF) determined by echocardiography in lightly anesthetized mice before ischemia surgery (Day 0) and after 72 h of reperfusion. FS and EF were significantly reduced after 72 h of reperfusion in both control and hyperglycemia. n=3~11, *indicates versus control-sham (*P <0.05, ***P < 0.0001). $ indicates versus hyperglycemia-sham ($P <0.05, $$P < 0.001, and $$$P < 0.0001), # indicates versus control-I/R (#P <0.05, ##P < 0.001, and ###P < 0.0001). Ordinary One-way ANOVA with Tukey’s multiple comparison was run for statistical analysis.
Discussion
Attributing to the role of controlling turnover of long-lived proteins and organelles, autophagy is critical to cardiac function [Citation16,Citation49-51]. Although cardiomyocyte autophagic alterations in diabetic cardiomyopathy and cardiac ischemia-reperfusion injury in nondiabetic animals have been a hot topic of investigation in recent years [Citation52,Citation53], the definitive role of autophagy in cardiac injury associated with these pathological conditions remains controversial. This is partly due to the inappropriate autophagic evaluation methods used in earlier studies, resulting in diverse interpretations [Citation54]. Moreover, although it is well recognized that ischemic heart disease is the primary cause of mortality in type 2 diabetic patients, the specific impact of diabetes upon cardiomyocyte autophagic flux after myocardial ischemia reperfusion has not been determined [Citation23].
This study was designed to examine the temporal changes of autophagy and the significance of this process in regulating H9c2 cell death induced during hypoxia reoxygenation in a high glucose state, to serve as a potent in vitro cellular model of cardiomyocytes in a diabetic I/R heart. The other focus of this study was to develop and test non-invasive imaging approaches to monitor cardiac autophagy and apoptosis, and compare them with established conventional methods, to analyze the influence of STZ-induced diabetes on basal and I/R-induced changes [Citation55]. Accordingly, we developed the use of in vivo and ex vivo FMT imaging with near infra red (NIR) probes for Cathepsin B activity and annexin V binding to provide insight into the temporal and spatial regulation of cardiac autophagy and apoptosis, respectively. Collectively our data indicated that, in STZ-induced diabetic mice, there was an enhanced degree of apoptosis following I/R injury which correlated with suppression of autophagy.
Advances in technology over the past decade have taken optical imaging beyond the standard qualitative two-dimensional epifluorescence and brought it into the realm of three-dimensional FMT. This has led to enhancements in deep tissue fluorescence detection and introduced improved quantitative accuracy. Such advancements allow for 3-dimensional measurements of important biological changes, associated either with disease progression or therapeutic intervention, and dynamic monitoring of molecular processes previously unattainable using conventional imaging modalities. Our use of NIR probes, activated specifically in areas of high autophagic flux or apoptotic activity in combination with co-registration with high resolution microCT scan for precise anatomical delineation of defined regions of interest, allowed us to follow individual mice over time and avoid inter-animal variation. We acknowledge that measuring cathepsin activity does not necessarily equate to direct analysis of autophagy and could also be influenced by other events, including lysosome biogenesis. Certainly, the advent of more specific NIR probes, such as for LC3II, should further enhance our ability to track autophagic flux in the future. Currently, it is still important that final conclusions in animal studies are drawn from a combination of FMT data along with well-established approaches including Western blotting for markers of autophagy, tissue section (immuno)histology, and transmission electron microscopy. While each of these methods have their own inherent limitations, the combined conclusions drawn from expeditious combination of multiple imaging and biochemical approaches, offers insights not previously possible. In our study, approaches to measure autophagy flux in cardiomycytes exposed to I/R with or without HG correlated well with the observations made using Cathepsin B activity, in vivo under conditions of cardiac I/R and hyperglycemia.
The role of autophagy in both diabetic and ischemic cardiomyopathy has been extensively studied, but perhaps due to the highly dynamic nature of the changes in autophagy flux or the timing of measurements in each experimental model, there variability in the contribution of autophagy to the recovery from injury from ischemic cardiomyopathy in the diabetic mouse. For example, previous studies based mainly upon Western blotting or LC3 puncta analysis have suggested that basal, or post-I/R, autophagy is decreased [Citation56-60] or elevated [Citation61,Citation62] in STZ-induced diabetic mouse heart homogenates. These examples highlight the need for a wider repertoire of approaches with which autophagy flux can be examined to allow for accurate conclusions to be drawn. Our focus on analysis of cathepsin activity as a measure of autophagic flux is potentially useful, since it has been previously shown that I/R injury impairs autophagosome clearance mediated in part by reactive oxygen species-induced decline in lysosome-associated membrane protein-2 [Citation30]. Improved approaches that facilitate our investigation of changes in cardiac autophagy in diabetes and heart failure, and their functional significance, are important, especially given the potential therapeutic benefits associated with targeting autophagy [Citation10,Citation52].
We have made several important observations in this study. Firstly, we have provided clear evidence that autophagy was increased in short term H/R, whereas followed with long term reoxygenation incubation, autophagy flux was disrupted, via mechanisms involving both autophagosome formation and autophagosome-lysosome fusion. Specifically, compared with the normal glucose treated H9c2 cell, autophagosome clearance was inhibited in the cell subjected to H/R, as evident by decreased cathepsin B activity and p62 degradation, and decreased autolysosome formation. In contrast to normal glucose-treated cardiomyoblasts, high glucose-treated cells exhibited impaired autophagosome formation during hypoxia-reoxygenation. This suggests that high glucose levels negatively affect the process of autophagosome formation and clearance in cardiomyoblasts under H/R conditions. As such, hypoxia followed by reoxygenation in the non-hyperglycemia cardiomyoblast impaired autophagosome flux primarily by inhibiting autophagosome clearance. In contrast, hypoxia followed by reoxygenation in the hyperglycemia cardiomyoblast impaired autophagic flux by exacerbating impaired autophagosome clearance atop of reduced autophagosome formation. Ultimately, the autophagy deficient cell line subjected to hypoxia reoxygenation, and high glucose further confirmed the autophagy played an essential role in combating cell death induced by hypoxia reoxygenation in H9c2. In the animal study, FMT analysis indicated that apoptosis occurs over time, and this correlated with less autophagy. It is likely that additional parallel mechanisms are contributing to the elevated level of annexin binding. Indeed, TUNEL analysis indicated that the basal level of DNA fragmentation was higher in hyperglycemic/diabetic mice versus control mice.
Another potentially important reason for apparent discrepancies of the role of autophagy in ischemia-reperfusion cardiac injury is that in several studies whole heart homogenates are often analyzed by biochemical methods, yet significant spatial changes in cardiac autophagy are apparent after I/R especially in the infarct region. Certainly, post-mortem identification of the infarct region, peri-infarct region, and remote area in the ischemia-reperfusion model is more challenging when compared to the permanent coronary artery ligation model in which an acellular fibrotic scar can be clearly identified. It is then difficult to compensate for variations in vascular anatomy that affect the size and location of the infarcted region. Through the use of labeled reporters such as Cathepsin B or Annexin V, regional differences can be clearly delineated and also simultaneously monitored in the same mouse over time. We propose that spatio-temporal localization of autophagy and apoptosis may provide valuable insight into future therapeutic interventions, such as determining when specific processes should be therapeutically targeted post-infarct.
In conclusion, we used in vivo and ex vivo fluorescence molecular tomography imaging and complementary in vitro established approaches to elucidate changes in I/R-induced cardiac autophagy, apoptosis, and subsequently cardiac dysfunction measured by echocardiography. We found suppressed autophagic flux and exacerbated apoptosis in diabetic versus wild type mice. We believe that our study establishes potentially important and useful new experimental approaches and identifies the role of dynamic cardiac autophagy changes in leading to cardiac cell death and dysfunction in a mouse model of diabetes. It is hoped that the FMT-based imaging of cardiac autophagy and apoptosis presented here can be utilized in the future with other mouse models to further examine temporal and spatial changes in cardiac autophagy and their functional significance.
Methods and materials
Experimental studies in animal models
C57BL/6 mice (Charles River Laboratories, Montreal, QC, Canada) were acclimated a minimum of 5 days to a standard housing environment: temperature and humidity-controlled rooms (21 ± 2 °C), with a daily 12:12 h light-dark cycle with access to low-fluorescence chow diet ad libitum. To induce diabetes, mice were starved 6-12 h prior to IP injection with streptozotocin (Calbiochem) 150 µg/g, then returned to normal low-fluorescence chow diet and monitored daily. Diabetes, defined as blood glucose >14 mmol/L, typically occurred after 3 to 5 days. At 6-8 weeks of age, mice were randomly allocated into 4 groups that received vehicle or STZ IP injection to induce diabetes, and subsequently underwent sham or cardiac ischemia-reperfusion via left descending coronary artery ligation surgery. Mice were anesthetized with 5% isoflurane, then intubated and maintained on 1.5 % isoflurane. Left thoracotomy was performed between the fourth and fifth ribs, and the pericardial tissue was removed before the ligation of LAD artery with a 7-0 suture around a PF-10 tubing for 35 min. The suture was removed to reperfuse the heart for up to 72 h, as indicated. Sham-operated mice underwent the same surgical procedure, except the suture was not tied around the LAD artery. Animal facilities met the guidelines of the Canadian Council on Animal Care, and all protocols were approved by the Animal Care Committees of York University and University Health Network.
Temporal fluorescence molecular tomography imaging in mice
NIR probes, as described below, were infused into mice via a permanent jugular vein catheter for in vivo assessment of autophagy (Cathepsin B 680 FAST, Perkin Elmer, MA USA) and apoptosis (Annexin-Vivo 750, Perkin Elmer, MA USA). Probes were delivered 24 h (Cathepsin B) or 4 h (Annexin) prior to the beginning of in vivo imaging. At the time of probe infusion, mice were lightly anesthetized, and the catheter was externalized and flushed with sterile saline. 100 µL of NIR probe was infused, followed by a second flush of sterile saline before sealing of the catheter, which was then returned under the skin, and the incision was closed with a single silk stitch. NIR probes were visualized via fluorescence molecular tomography (FMT) using the VisEn FMT 2500 LX Quantitative Tomography System (Perkin Elmer, MA USA). Shaved mice were placed in the supine position in a plexiglass holder in the FMT imager and the scan region was manually established to capture the upper half of the mouse (i.e. nose to above the liver) using an in-plane resolution of 1×1 mm2. Cathepsin B and Annexin images were captured sequentially at 680 nm and 750 nm respectively, before transfer of the lightly anesthetized mouse for micro–computed tomography (CT) imaging (eXplore Ultra, GE Healthcare, London, Canada). Three-Dimensional FMT-CT image reconstruction was performed using Amide (http://amide.sourceforge.net) or Inveon Research Workstation (Siemens Healthcare, Germany). Briefly, reconstructed FMT images were extracted in DICOM format, imported, and aligned via rigid registration to CT images using fiducial markers present in the plexiglass holding apparatus. Regions of interest (ROI) for whole heart and infarct area were contoured on a subset of axial CT slices within the image volume, with linear interpolation between the contoured slices used to generate the 3D volume. FMT intensity was measured across the defined regions of interest for both Cathepsin B and Annexin (nmol).
Ex-vivo fluorescence molecular tomography imaging of mouse hearts
Hearts were isolated from mice at the times specified, and isolated hearts were immediately placed on an opaque resin block in the FMT plexiglass mouse holder and imaged at 680 nm and 750 nm. Epifluorescence images were captured for each mouse heart, and analysis of ex-vivo images was performed using Amide. Briefly, ROI were appropriately sized and placed to measure fluorescence in the entire heart, the infarct region, and a ‘healthy’ remote region. Minimal thresholding was applied to remove only very low-grade background signal. The analysis used the Mean signal intensity (counts/energy) in the given ROI. The ROI size remained consistent through all individuals with the statistics for the average voxel size across all hearts analyzed; whole heart (1262.22+/-20.1, 1.6 % variance), infarct region (405 +/- 0.6, 0.15 % variance), and remote region (728.43 +/- 1.4, 0.9 % variance).
Analysis of cell death using TUNEL labeling
At 72 h after ischemia/reperfusion or sham surgery, hearts were horizontally cut and fixed in 10% neutral buffered formalin for 24-48 h. After dehydration, the samples were embedded into paraffin. The chilled paraffin blocks were sectioned at 5 μm, mounted with antifade mounting medium then stained with DAPI (4’,6-diamidino-2-phenylindole) (H-1200, Vector Lab, Burlingame, CA, USA). At a single cell level, apoptosis was detected by terminal deoxynucleotidyl transferase (TdT) dUTP nick-end labeling (TUNEL) assay (In situ cell death detection kit, fluorescein, Roche Diagnostics, Mannheim, Germany). The assay was performed by following the manufacturer’s instructions. Using a confocal microscope (LSM 700, Carl Zeiss, Oberkochen, Germany), images were collected with 40 x magnification and analyzed by ImageJ software.
Hematoxylin & eosin staining in cardiac tissue sections
Cryostats of heart samples prepared 72 h after ischemia/reperfusion or sham operation were horizontally cut at 5 μm and frozen sections were thawed at room temperature, fixed in 2 % PFA for 15 min, and then washed in running water. Sections were incubated in filtered Harris’ Hematoxylin (Leica Biosystems, Concord, ON, CA) for 3 min, differentiated in 1 % acid alcohol solution, and washed in running warm water for a further 5 min. Sections were then blued in 0.2 % ammonia water for 1 min and washed again. The sections were immersed in Eosin Y solution (Leica Biosystems, Concord, ON, CA) for 40 sec, washed briefly before dehydrating through graded alcohol solutions (70%, 95%, 3 changes of 100%), and then cleared in 3 changes of xylene before mounting coverslips in Permount mounting media (Thermo Fisher Scientific, Ottawa, ON, CA). Tissue sections were digitized at 20 x on a Leica Aperio ScanScope XT slide scanner.
Analysis of cardiac function by echocardiography
Cardiac function was assessed by transthoracic echocardiography on anesthetized mice using a GE Vivid 7 ultrasound system (GE Healthcare Canada) with an i13L transducer, as previously described [Citation63]. Depth and frequency were set at 1 cm and 14 MHz, respectively. Short-axis views were obtained from the parasternal approach. LV dimensions [left ventricular end-diastolic internal diameter (LVIDd) and end-systolic internal diameter (LVIDs)] were measured in M-mode at short-axis views of the LV at papillary muscle level. Fractional shortening (FS) was calculated as follows: [(LVIDd−LVIDs)/LVIDd]×100. Ejection fraction (EF) was calculated as follows: [(LVIDd3−LVIDs3)/LVIDd3]×100.
Cell Culture of H9c2 cells
H9c2 rat embryonic cardiac myoblasts (ATCC® CRL-1446TM) were grown in Dulbecco’s Modified Eagle’s Medium (DMEM) (Gibco, Invitrogen) supplemented with 10 % fetal bovine serum (FBS) and 1 % (vol/vol) streptomycin/penicillin (Gibco, Invitrogen) at 37 °C and 5 % CO2. When cells reached confluency, they were incubated in 1 % FBS-DMEM media overnight. Hypoxia was achieved by placing cells in a hypoxic chamber (Onstage Incubator, ThermoFisher, NX7LIVE001) filled with a pre-analyzed gas mixture of 1 % O2 and 5 % CO2. Reoxygenation was achieved by placing cells in the Onstage Incubator filled with 20 % O2 and 5 % CO2.
Human induced pluripotent stem cell-derived cardiomyocytes
Cryopreserved IPSC-CMs (Cellular Dynamics International, R1132) were thawed and cultured on plastic dishes coated with 0.1% gelatin (Stem cell technologies, 7903) in plating medium (Cellular Dynamics International, M1001). After 2 days the cultured medium was replaced with maintenance medium (Cellular Dynamics International, M1003) for 5 more days as previously reported [Citation64,Citation65]. Cardiomyocytes were confirmed to contract synchronously at greater than 80% confluency before high glucose and hypoxia reoxygenation treatment.
Validation of autophagy assays in cellular models
The autophagy activator rapamycin (Sigma, RA8781, 100 nM), and autophagy inhibitor chloroquine (Sigma, C6628, 50 nM) were used to verify various autophagy assays by fluorescent microscopy. Additionally, rapamycin and Tat-beclin (Novus, NBP2-49888, 5 μM) were used to evaluate the functinal significance of autophagy in protecting against cell death induced by H/R.
Generation of atg7 KO, HibiT-LC3 and VC3AI transduced H9c2 Cells
CRISPR knock-out lines were generated using guide RNAs cloned into the pX459 plasmid, as previously described [Citation66]. Vectors carrying guides targeting atg7 were transfected into H9c2 cells using Lipofectamine 3000. Transduced cells were selected using 1 μg/ml of puromycin over 5 days, and then expanded in media without selection. T7 endonuclease assays were carried out using T7 endonuclease I according to the manufacturer’s recommendations on PCR products generated using the following primer pair 5’-GCTGCTGCAGGTAGGTGTAA and 5’-GGTGTCCTGTCTGAGACTGC. Autophagy LC3 HiBiT reporter vector (Promega, GA2550) has a HiBiT tag and contains a sequence encoding the MAP1LC3B gene. H9c2 cells were transfected with the autophagy LC3 HiBiT reporter vector according to the manufacturer manual [Citation67]. Nano-Glo HiBiT lytic reagent (Promega, N3040) was added to the cells after each treatment and luminescence was measured on a Thermo Varioskan LUX microplate reader. To generate H9c2 lines stably expressing Venus-based Caspase-3 like protease activity indicator (VC3AI; a gift from Dr Binghui Li, Addgene plasmid 78907), lentiviral particles were produced using pCDH-puro-CMV-VC3AI and transduced cells were selected using 1 μg/mL puromycin [Citation43]. This genetically encoded biosensor consists of cyclized chimeras containing a caspase-3 cleavage site as a switch. Upon cleavage by caspase-3-like proteases, the non-fluorescent indicator rapidly becomes fluorescent, and thus detects activation in real-time.
Immunofluorescence staining
LC3 and p62 immunofluorescence was performed as described previously [Citation68]. Briefly, cells were fixed, permeabilized, and blocked with PBS solution containing 1% BSA and 2% goat serum. After blocking, cells were incubated with blocking solution containing LC3 (MBL, PD014, 1:1000) and p62 (R&D, MAB 8028). Cells were incubated with anti‐rabbit Alexa Fluor 488 secondary antibody (Thermo Fisher Scientific, A11008, 1:500) and anti-goat Alexa Fluor 594 antibody (Thermo Fisher Scientific, A11005, 1:500) at room temperature for 1 h. After incubation, cells were mounted with DPAI after washing.
Western blot
H9c2 cells were used for western blot and the cells were suspended in lysis buffer. Proteins were separated by reducing SDS-PAGE and transferred to a PVDF membrane. The following antibodies were used for the western blot:, LC3B (1:1000, Cell Signaling Technology, 2775), p62 (1:1000, Cell Signaling Technology, 5114), Bax (1:1000, Cell Signaling Technology, 2772), cleaved Caspase 3 (1:1000, Cell Signaling, 9661), Bcl-2 (1:1000, Cell Signaling Technology, 3489), and β-tubulin (1:2000, Cell Signaling Technology, 2128), GAPDH (1:2000, Cell Signaling Technology, 2118). The quantification of signals was performed by densitometry of scanned autoradiographs with the aid of ImageJ.
Flow cytometry analysis of Annexin-V and PI
After treatment, cells were harvested with trypsin-EDTA-0.25% (Gibco, 25200056) and cell pellets were incubated with an appropriate staining dye. Annexin V and Propidium Iodide (PI) (ThermoFisher, V13245) were used in 1 % FBS-DMEM at 37 °C for 30 minutes. After incubation, cells were re-suspended in the FACS buffer (2 % FBS in PBS) and assessed by flow cytometry (Attenute NxT BRV6, ThermoFisher). Compensation and analysis were performed with FlowJO software V10.
Measurement of Cell death
H9c2 cells were seeded on glass coverslips which were isolated as described previously [Citation69]. Staining Caspase 3/7 kit (1:500, ThermoFisher, C10423), ReadyProbe Cell Viability Probe (ThermoFisher, #R37609) was performed according to manufacturer’s protocols and DAPI (HCS NuclearMask Blue Stain, ThermoFisher, H10325) was added simultaneously. Briefly, 2 drops of NucGreen® Dead and DAPI was added per mL of cell culture medium needed and then incubated with cultures for 15 minutes at 37 °C. Cell viability was assessed via the incorporation of NucGreen® Dead into the nucleus and imaged using the EVOS FL Imaging System. NucGreen® Dead only incorporates into cells with a compromised cell membrane, while DAPI can permeate the membranes of all cells and bind to DNA. LDH cytotoxicity assay (Cayman, 601170) measures cell death in response to treatments using a coupled two-step reaction. In the first step, LDH catalyzes the reduction of NAD+ to NADH and H+ by oxidation of lactate to pyruvate. In the second step of the reaction, diaphorase uses the newly formed NAD and H+ to catalyze the reduction of tetrazolium salt to highly colored formazan which absorbs strongly at 490-520 nm. The amount of formazan produced is proportional to the amount of LDH released into the culture medium as a result of cytotoxicity [Citation69]. in keeping with above methods, need to add some more experimental protocol detail. Briefly, after the confluency the confluency of H9c2 cell reached 80% in 96-well plate, cells were treated with or without HG for 24 h followed with N or H/R. Additional, three well was designated to measure maximum release of LDH, added with 20 μL of 10% Triton X-100 solution. At the endpoint of treatment, 100 μL culture medium of each condition was collected and transferred to a new 96-well plate, then added with 100 μL of LDH reaction solution prepared following the user guideline by mixing NAD+ (100x), Lactic Acid (100x) and INT (100X) in assay buffer. After 30 mins incubation at room temperature, absorbance at 490 nm was read by plate reader. %cytotoxicity was calculated by (experimental value A490/Maximum release A490) * 100.
Measurement of autophagy by fluorescent microscopy
H9c2 cells were seeded on glass coverslips which were isolated as described previously [Citation69]. Staining using different dyes including Magic Red (1:260, ImmunoChemistry Technologies, 942), DalGreen (1:1000, Dojindo, D675), was performed according to manufacturer’s protocols and DAPI (HCS NuclearMask Blue Stain, ThermoFisher, H10325) was added simultaneously. As reported previously, DapRed is used to detect both autophagosomes and autolysosomes [Citation46]. The mechanism underlying its use is that the dye is incorporated into the autophagosome during double membrane formation via structural features, and then emits fluorescence under hydrophobic conditions. DalGreen is a cell permeable fluorescent dye with the property of emitting fluorescence under hydrophobic and acidic conditions. It is therefore used to detect autolysosomes [Citation3]. Both DapRed and DalGreen were added to H9c2 cells at a dose of 0.1 umol/L, and 1 umol/L respectively for 30 minutes at 37 °C prior to treatment. In temporal studies, cells were subsequently monitored for fluorescence at 561 nm for DapRed and 450 nm for DalGreen by Cellnsight CX7 Platform (ThermoFisher, CX7A1110). In other experiments, cells grown on cover slips were fixed with 10% formalin (Sigma, HT501128) after treatment and mounted on microscope slides with ProLong Gold Antifade Mountant (ThermoFisher, P36930). Slides were then visualized under Nikon Eclipse Ti2 confocal microscopy.
Measurement of autophagy by microscopy and luminescence using HiBiT reporter H9c2 cell
A sequence encoding the MAP1LC3B gene. H9c2 cells were transfected with the autophagy LC3 HiBiT reporter vector according to the manufacturer’s manual[Citation69,Citation70]. When autophagy is induced, cytosolic LC3-I (as well as expressed autophagy LC3 HiBiT reporter) is recruited to phagophores where it becomes conjugated to phosphatidylethanolamine, thereby forming LC3-II. Upon phagophore membrane elongation and closure to form the mature autophagosomal vesicle, a significant fraction of tethered LC3 protein becomes captured within the lumen along with various cargo materials. Subsequently, autophagosomes fuse with lysosomes to form autolysosomes, leading to the ultimate degradation of both cargo material and the captured LC3 protein (and autophagy LC3 HiBiT reporter protein). The capture of cargo material, its trafficking to the autolysosome and the ultimate degradation of this material is referred to as autophagic flux. Therefore, changes in the total level of LC3 protein (or autophagy HiBiT LC3 reporter) can be used to monitor changes in autophagic flux. In brief, for luminescence measurement, after confluency of the H9c2 cells tagged with LC3 HiBiT reporter reached 80% in a 96-well plate, cells were treated with or without HG for 24 h followed with N or H/R in a volume of 100 l. At the endpoint of treatment, cells were equilibrated to room temperature for 15 mins, then 100 of Nano-Glo HibiT lytic reagent (Promega, #N3040) was added to each well and mixed by orbital shaking at 400 rpm for 10 mins in room temperature. Luminescence was then detected at an integration time of 0.5 seconds. For fluorescence microscopy, at the end point of treatment, H9c2 cells tagged with LC3 HiBiT reporter was DAPI (HCS NuclearMask Blue Stain) and visualized under Nikon Eclipse Ti2 confocal microscopy.
Statistical analysis
Statistical analysis was performed using the Student’s t-test and one- or two-way ANOVA followed by Tukey’s multiple-comparison test where appropriate. Data are expressed as the mean ± SEM where P < 0.05 was considered statistically significant.
Author contributions
Manuscript writing or editing (JT, NY, KD, GS), experimental work (JT, NY, KD, HKS, TQD, JW, TM, JDP), experimental design (JT, NY, KD, HKD, RKL, JJ, JG, JDP, GS), funding (GS).
Supplemental Material
Download Zip (25.9 MB)Acknowledgments
GS wishes to thank Heart & Stroke Foundation of Canada and Canadian Institutes of Health Research for funding these studies.
Supplementary Material
Supplemental data for this article can be accessed online at https://doi.org/10.1080/27694127.2024.2330327
Additional information
Funding
References
- Dunlay SM, Givertz MM, Aguilar D, et al. Type 2 Diabetes Mellitus and Heart Failure: A Scientific Statement From the American Heart Association and the Heart Failure Society of America: This statement does not represent an update of the 2017 ACC/AHA/HFSA heart failure guideline update. Circulation. 2019 Aug 13;140(7):e294–28.
- Rawshani A, Rawshani A, Franzén S, et al. Range of Risk Factor Levels: Control, Mortality, and Cardiovascular Outcomes in Type 1 Diabetes Mellitus. Circulation. 2017 Apr 18;135(16):1522–1531.
- Sousa GR, Pober D, Galderisi A, et al. Glycemic Control, Cardiac Autoimmunity, and Long-Term Risk of Cardiovascular Disease in Type 1 Diabetes Mellitus. Circulation. 2019 Feb 5;139(6):730–743.
- Figtree GA, Rådholm K, Barrett TD, et al. Effects of Canagliflozin on Heart Failure Outcomes Associated With Preserved and Reduced Ejection Fraction in Type 2 Diabetes Mellitus. Circulation. 2019 May 28;139(22):2591–2593.
- Cosentino F, Cannon CP, Cherney DZI, et al. Efficacy of Ertugliflozin on Heart Failure-Related Events in Patients With Type 2 Diabetes Mellitus and Established Atherosclerotic Cardiovascular Disease: Results of the VERTIS CV Trial. Circulation. 2020 Dec 8;142(23):2205–2215.
- Rådholm K, Figtree G, Perkovic V, et al. Canagliflozin and Heart Failure in Type 2 Diabetes Mellitus: Results From the CANVAS Program. Circulation. 2018 Jul 31;138(5):458–468.
- Mapanga RF, Joseph D, Symington B, et al. Detrimental effects of acute hyperglycaemia on the rat heart. Acta Physiol (Oxf). 2014 Mar;210(3):546–64.
- Di Filippo C, Cuzzocrea S, Marfella R, et al. M40403 prevents myocardial injury induced by acute hyperglycaemia in perfused rat heart. Eur J Pharmacol. 2004 Aug 16;497(1):65–74.
- Mizushima N, Komatsu M. Autophagy: renovation of cells and tissues. Cell. 2011 Nov 11;147(4):728–41.
- Schiattarella GG, Hill JA. Therapeutic targeting of autophagy in cardiovascular disease [Review]. J Mol Cell Cardiol. 2016 Jun;95:86–93.
- Ikeda S, Zablocki D, Sadoshima J. The role of autophagy in death of cardiomyocytes. J Mol Cell Cardiol. 2022 Apr;165:1–8.
- Hariharan N, Ikeda Y, Hong C, et al. Autophagy plays an essential role in mediating regression of hypertrophy during unloading of the heart. PLoS One. 2013;8(1):e51632.
- Cao DJ, Jiang N, Blagg A, et al. Mechanical unloading activates FoxO3 to trigger Bnip3-dependent cardiomyocyte atrophy. J Am Heart Assoc. 2013 Apr 8;2(2): e000016.
- Wellnitz K, Taegtmeyer H. Mechanical unloading of the failing heart exposes the dynamic nature of autophagy. Autophagy. 2010 Jan;6(1):155–6.
- Delbridge LMD, Mellor KM, Taylor DJ, et al. Myocardial stress and autophagy: mechanisms and potential therapies. Nat Rev Cardiol. 2017 Jul;14(7):412–425.
- Nakai A, Yamaguchi O, Takeda T, et al. The role of autophagy in cardiomyocytes in the basal state and in response to hemodynamic stress. Nat Med. 2007 May;13(5):619–24.
- Shirakabe A, Zhai P, Ikeda Y, et al. Drp1-Dependent Mitochondrial Autophagy Plays a Protective Role Against Pressure Overload-Induced Mitochondrial Dysfunction and Heart Failure. Circulation. 2016 Mar 29;133(13):1249–63.
- Mariño G, Pietrocola F, Kong Y, et al. Dimethyl α-ketoglutarate inhibits maladaptive autophagy in pressure overload-induced cardiomyopathy. Autophagy. 2014 May;10(5):930–2.
- Taneike M, Yamaguchi O, Nakai A, et al. Inhibition of autophagy in the heart induces age-related cardiomyopathy [Research Support, Non-U.S. Gov’t]. Autophagy. 2010 Jul;6(5):600–6.
- Nah J, Fernández Á F, Kitsis RN, et al. Does Autophagy Mediate Cardiac Myocyte Death During Stress? Circ Res. 2016 Sep 30;119(8):893–5.
- Zhang M, Sui W, Xing Y, et al. Angiotensin IV attenuates diabetic cardiomyopathy via suppressing FoxO1-induced excessive autophagy, apoptosis and fibrosis. Theranostics. 2021;11(18):8624–8639.
- Moe GW, Marin-Garcia J. Role of cell death in the progression of heart failure. Heart Fail Rev. 2016 Mar;21(2):157–67.
- Lavandero S, Chiong M, Rothermel BA, et al. Autophagy in cardiovascular biology. J Clin Invest. 2015 Jan;125(1):55–64.
- Xing Y, Sui Z, Liu Y, et al. Blunting TRPML1 channels protects myocardial ischemia/reperfusion injury by restoring impaired cardiomyocyte autophagy. Basic Res Cardiol. 2022 Apr 7;117(1):20.
- Xie M, Cho GW, Kong Y, et al. Activation of Autophagic Flux Blunts Cardiac Ischemia/Reperfusion Injury. Circ Res. 2021 Jul 23;129(3):435–450.
- Xie M, Kong Y, Tan W, et al. Histone deacetylase inhibition blunts ischemia/reperfusion injury by inducing cardiomyocyte autophagy. Circulation. 2014 Mar 11;129(10):1139–51.
- Li Y, Liang P, Jiang B, et al. CARD9 promotes autophagy in cardiomyocytes in myocardial ischemia/reperfusion injury via interacting with Rubicon directly. Basic Res Cardiol. 2020 Apr 4;115(3):29.
- Gu S, Tan J, Li Q, et al. Downregulation of LAPTM4B Contributes to the Impairment of the Autophagic Flux via Unopposed Activation of mTORC1 Signaling During Myocardial Ischemia/Reperfusion Injury. Circ Res. 2020 Sep 11;127(7):e148–e165.
- Maejima Y, Kyoi S, Zhai P, et al. Mst1 inhibits autophagy by promoting the interaction between Beclin1 and Bcl-2. Nat Med. 2013 Nov;19(11):1478–88.
- Ma X, Liu H, Foyil SR, et al. Impaired autophagosome clearance contributes to cardiomyocyte death in ischemia/reperfusion injury. Circulation. 2012 Jun 26;125(25):3170–81.
- Buse JB, Ginsberg HN, Bakris GL, et al. Primary prevention of cardiovascular diseases in people with diabetes mellitus: a scientific statement from the American Heart Association and the American Diabetes Association. Diabetes Care. 2007 Jan;30(1):162–72.
- Yun JS, Ko SH. Current trends in epidemiology of cardiovascular disease and cardiovascular risk management in type 2 diabetes. Metabolism. 2021 Oct;123:154838.
- Jia G, Whaley-Connell A, Sowers JR. Diabetic cardiomyopathy: a hyperglycaemia- and insulin-resistance-induced heart disease. Diabetologia. 2018 Jan;61(1):21–28.
- Laakso M, Kuusisto J. Insulin resistance and hyperglycaemia in cardiovascular disease development. Nat Rev Endocrinol. 2014 May;10(5):293–302.
- Forrester SJ, Kikuchi DS, Hernandes MS, et al. Reactive Oxygen Species in Metabolic and Inflammatory Signaling. Circ Res. 2018 Mar 16;122(6):877–902.
- Filomeni G, De Zio D, Cecconi F. Oxidative stress and autophagy: the clash between damage and metabolic needs. Cell Death Differ. 2015 Mar;22(3):377–88.
- Kenny HC, Abel ED. Heart Failure in Type 2 Diabetes Mellitus. Circ Res. 2019 Jan 4;124(1):121–141.
- Uchiyama Y. Autophagic cell death and its execution by lysosomal cathepsins. Arch Histol Cytol. 2001 Aug;64(3):233–46.
- Man SM, Kanneganti TD. Regulation of lysosomal dynamics and autophagy by CTSB/cathepsin B. Autophagy. 2016 Dec;12(12):2504–2505.
- Wu P, Yuan X, Li F, et al. Myocardial Upregulation of Cathepsin D by Ischemic Heart Disease Promotes Autophagic Flux and Protects Against Cardiac Remodeling and Heart Failure. Circ Heart Fail. 2017 Jul;10(7).
- Chen HH, Khatun Z, Wei L, et al. A nanoparticle probe for the imaging of autophagic flux in live mice via magnetic resonance and near-infrared fluorescence. Nat Biomed Eng. 2022 Sep;6(9):1045–1056.
- Davidson MD, Ballinger KR, Khetani SR. Long-term exposure to abnormal glucose levels alters drug metabolism pathways and insulin sensitivity in primary human hepatocytes. Sci Rep. 2016 Jun 17;6:28178.
- Zhang J, Wang X, Cui W, et al. Visualization of caspase-3-like activity in cells using a genetically encoded fluorescent biosensor activated by protein cleavage. Nat Commun. 2013;4:2157.
- Lebek S, Chemello F, Caravia XM, et al. Ablation of CaMKIIdelta oxidation by CRISPR-Cas9 base editing as a therapy for cardiac disease. Science. 2023 Jan 13;379(6628):179-185.
- Xiao H, Zhang M, Wu H, et al. CIRKIL Exacerbates Cardiac Ischemia/Reperfusion Injury by Interacting With Ku70. Circ Res. 2022 Mar 4;130(5):e3–e17.
- Fang H, Geng S, Hao M, et al. Simultaneous Zn(2+) tracking in multiple organelles using super-resolution morphology-correlated organelle identification in living cells. Nat Commun. 2021 Jan 4;12(1):109.
- Chen Q, Hao M, Wang L, et al. Prefused lysosomes cluster on autophagosomes regulated by VAMP8. Cell Death Dis. 2021 Oct 13;12(10):939.
- Kimura S, Noda T, Yoshimori T. Dissection of the autophagosome maturation process by a novel reporter protein, tandem fluorescent-tagged LC3. Autophagy. 2007 Sep-Oct;3(5):452–60.
- Aghaei M, Motallebnezhad M, Ghorghanlu S, et al. Targeting autophagy in cardiac ischemia/reperfusion injury: A novel therapeutic strategy. J Cell Physiol. 2019 Aug;234(10):16768–16778.
- Gustafsson AB, Gottlieb RA. Autophagy in ischemic heart disease. Circulation research. 2009 Jan 30;104(2):150–8.
- Przyklenk K, Dong Y, Undyala VV, et al. Autophagy as a therapeutic target for ischaemia /reperfusion injury? Concepts, controversies, and challenges. Cardiovascular research. 2012 May 1;94(2):197–205.
- Sciarretta S, Boppana VS, Umapathi M, et al. Boosting autophagy in the diabetic heart: a translational perspective. Cardiovasc Diagn Ther. 2015 Oct;5(5):394–402.
- Murase H, Kuno A, Miki T, et al. Inhibition of DPP-4 reduces acute mortality after myocardial infarction with restoration of autophagic response in type 2 diabetic rats. Cardiovasc Diabetol. 2015 Aug 11;14:103.
- Matsui Y, Takagi H, Qu X, et al. Distinct roles of autophagy in the heart during ischemia and reperfusion: roles of AMP-activated protein kinase and Beclin 1 in mediating autophagy. Circ Res. 2007 Mar 30;100(6):914–22.
- Bugger H, Abel ED. Molecular mechanisms of diabetic cardiomyopathy [Research Support, N.I.H., Extramural Research Support, Non-U.S. Gov’t Review]. Diabetologia. 2014 Apr;57(4):660–71.
- Xu X, Kobayashi S, Chen K, et al. Diminished autophagy limits cardiac injury in mouse models of type 1 diabetes [Research Support, N.I.H., Extramural Research Support, Non-U.S. Gov’t]. J Biol Chem. 2013 Jun 21;288(25):18077–92.
- Zhao Y, Zhang L, Qiao Y, et al. Heme oxygenase-1 prevents cardiac dysfunction in streptozotocin-diabetic mice by reducing inflammation, oxidative stress, apoptosis and enhancing autophagy [Research Support, Non-U.S. Gov’t]. PLoS One. 2013;8(9):e75927.
- Zhang J, Cheng Y, Gu J, et al. Fenofibrate increases cardiac autophagy via FGF21/SIRT1 and prevents fibrosis and inflammation in the hearts of Type 1 diabetic mice [Research Support, Non-U.S. Gov’t]. Clin Sci (Lond). 2016 Apr;130(8):625–41.
- Wang B, Yang Q, Sun YY, et al. Resveratrol-enhanced autophagic flux ameliorates myocardial oxidative stress injury in diabetic mice [Research Support, Non-U.S. Gov’t]. J Cell Mol Med. 2014 Aug;18(8):1599–611.
- Guo Y, Yu W, Sun D, et al. A novel protective mechanism for mitochondrial aldehyde dehydrogenase (ALDH2) in type i diabetes-induced cardiac dysfunction: role of AMPK-regulated autophagy [Research Support, Non-U.S. Gov’t]. Biochim Biophys Acta. 2015 Feb;1852(2):319–31.
- Kanamori H, Takemura G, Goto K, et al. Autophagic adaptations in diabetic cardiomyopathy differ between type 1 and type 2 diabetes. Autophagy. 2015;11(7):1146–60.
- Eguchi M, Kim YH, Kang KW, et al. Ischemia-reperfusion injury leads to distinct temporal cardiac remodeling in normal versus diabetic mice [Research Support, Non-U.S. Gov’t]. PLoS One. 2012;7(2):e30450.
- Guo J, Mihic A, Wu J, et al. Canopy 2 attenuates the transition from compensatory hypertrophy to dilated heart failure in hypertrophic cardiomyopathy. Eur Heart J. 2015 Oct 1;36(37):2530–40.
- Traister A, Li M, Aafaqi S, et al. Integrin-linked kinase mediates force transduction in cardiomyocytes by modulating SERCA2a/PLN function. Nat Commun. 2014 Sep 11;5:4533.
- Drawnel FM, Boccardo S, Prummer M, et al. Disease modeling and phenotypic drug screening for diabetic cardiomyopathy using human induced pluripotent stem cells. Cell Rep. 2014 Nov 6;9(3):810–21.
- Ran FA, Hsu PD, Wright J, et al. Genome engineering using the CRISPR-Cas9 system. Nat Protoc. 2013 Nov;8(11):2281–2308.
- Velagapudi R, Lepiarz I, El-Bakoush A, et al. Induction of Autophagy and Activation of SIRT-1 Deacetylation Mechanisms Mediate Neuroprotection by the Pomegranate Metabolite Urolithin A in BV2 Microglia and Differentiated 3D Human Neural Progenitor Cells. Mol Nutr Food Res. 2019 May;63(10):e1801237.
- Jahng JWS, Alsaadi RM, Palanivel R, et al. Iron overload inhibits late stage autophagic flux leading to insulin resistance. EMBO Rep. 2019 Oct 4;20(10):e47911.
- Haslam G, Wyatt D, Kitos PA. Estimating the number of viable animal cells in multi-well cultures based on their lactate dehydrogenase activities. Cytotechnology. 2000 Jan;32(1):63–75.
- Lazar DF, Gillette AA, Lewis SR, et al. Multimodal assessment of autophagy in mammalian cells with a novel, LC3-based tandem reporter. Methods Cell Biol. 2021;165:39–57.