

Abstract
Purpose
Evidence between air pollution and COPD admissions is inconsistent and limited in China. In this study, we aimed to explore the effects of air pollutants on COPD admissions in Beijing, China.
Patients and methods
Daily COPD hospital admission visits derived from tertiary and secondary hospitals in Beijing were retrieved from January 2013 to February 2017. Air pollutant levels and meteorological data over the same periods were also achieved. Generalized additive model was applied to estimate the percentage changes with 95% CIs in daily admissions corresponding to 10 µg/m3 increases in pollutants levels [1 mg/m3 in carbon monoxide (CO)], stratified by age, gender, and season.
Results
Seventy-three thousand seventy-six COPD hospital admission visits were included with mean daily visits of 48 (21). Cumulative lag effect with per 10 µg/m3 increase in air pollutant levels was largest for nitrogen dioxide (NO2) with 3.03% (95% CI: 1.82%–4.26%) at lag 06, for sulfur dioxide (SO2) with 2.07% (95% CI: 1.00%–3.15%) at lag 01, for particulate matter ≤10 µm in aerodynamic diameter (PM10) with 0.92% (95% CI: 0.55%–1.30%) at lag 07, and for particulate matter ≤2.5 µm in aerodynamic diameter (PM2.5) with 0.82% (95% CI: 0.38%–1.26%) at lag 06, respectively. Percentage increase for each 1 mg/m3 increase in CO was 5.99% (95% CI: 2.74%–9.34%) at lag 06. Further, stronger effects on COPD admissions were found in warm seasons than in cold seasons.
Conclusion
Short-term exposures to PM2.5, PM10, NO2, SO2, and CO had adverse effects on COPD hospitalizations in Beijing with different magnitudes and lag days.
Supplementary materials
Figure S1 Scatter plots of daily hospital admission visits and daily concentrations of PM10, NO2, SO2, CO, and O3 levels in Beijing, China, from January 1, 2013, to February 28, 2017.
Abbreviations: CO, carbon monoxide; NO2, nitrogen dioxide; O3, ozone; PM2.5, particulate matter ≤2.5 µm in aerodynamic diameter; PM10, particulate matter ≤10 µm in aerodynamic diameter; SO2, sulfur dioxide.
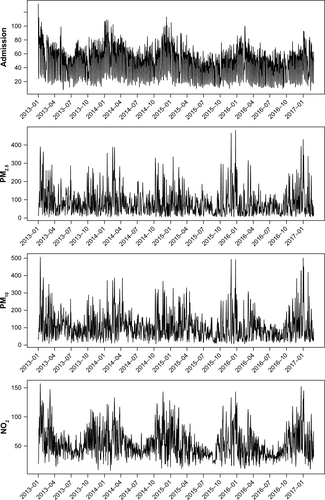
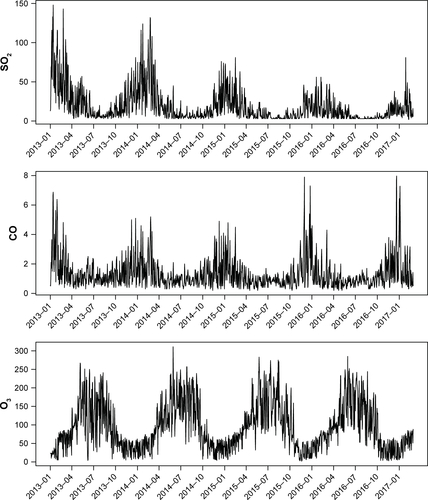
Figure S2 Percentages (%) with 95% CIs in multiday lag model for COPD hospital visits with per 10 µg/m3 increase in PM2.5 (A), PM10 (B), NO2 (C), SO2 (D), CO (E) and O3 (F) levels in patients aged over 75 years (in red color) and aged <75 years (in blue color).
Notes: For CO, percentage change in the relative risks corresponded to per 1 mg/m3 increase of CO levels. **P<0.01; *P<0.05.
Abbreviations: CO, carbon monoxide; NO2, nitrogen dioxide; O3, ozone; PM2.5, particulate matter ≤2.5 µm in aerodynamic diameter; PM10, particulate matter ≤10 µm in aerodynamic diameter; SO2, sulfur dioxide.
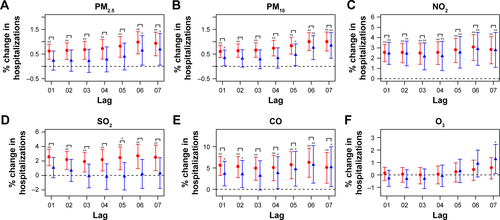
Figure S3 Percentages (%) with 95% CIs in multiday lag model for COPD hospital visits with per 10 µg/m3 increase in PM2.5 (A), PM10 (B), NO2 (C), SO2 (D), CO (E) and O3 (F) levels in female (in red color) and male (in blue color) patients.
Notes: For CO, percentage change in the relative risks corresponded to per 1 mg/m3 increase of CO levels. **P<0.01; *P<0.05.
Abbreviations: CO, carbon monoxide; NO2, nitrogen dioxide; O3, ozone; PM2.5, particulate matter ≤2.5 µm in aerodynamic diameter; PM10, particulate matter ≤10 µm in aerodynamic diameter; SO2, sulfur dioxide.
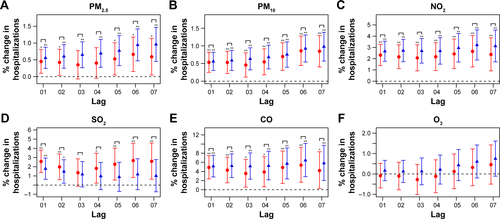
Table S1 Percentage changes (%) with 95% CIs in the single-day lag risks for COPD hospital admissions with per 10 µg/m3 increaseTable Footnotea in air pollutant concentrations stratified by age, sex, and season
Acknowledgments
This research was funded by the National Key Basic Research Program of China (973 Program) (2015CB553402), the Basic Research Fund of Central Public Welfare Scientific Institute (2016ZX310181-6), and the National Key Research and Development Program of China (2018YFC1313600).
Author contributions
Each author had full access to the data and took responsibility for the integrity of the data and the accuracy of the data analysis. All authors approved the final submitted manuscript. K-FX and CL conceived and designed the study. NG, JJ, YY, and SW collected and prepared the data. NG and JJ conducted the final analysis and drafted the manuscript. All authors contributed to data analysis, drafting or revising the article, gave final approval of the version to be published, and agree to be accountable for all aspects of the work.
Disclosure
The authors report no conflicts of interest in this work.