
Figures & data
Table 1. Reference location center points of the PCXMC simulations for different sizes of field-of-view (FOV) on maxillary canines and mandibular third molars.
Table 2. Simulated effective and absorbed organ doses from CBCT examinations of impacted maxillary canines and mandibular third molars.
Figure 1. Monte Carlo (ImpactMC) simulation of the 3D radiation dose distribution for CBCT scans of impacted maxillary canines and mandibular third molars with 40Ø × 35 mm FOV as applied to ATOM anthropomorphic female adult head and neck phantom model. (a) Imaging field positioning according to the location of a left maxillary canine tooth. (b) Simulated radiation dose distribution in axial view and (c) sagittal view for impacted maxillary canine, presented as a relative color heatmap. (d) Imaging field positioning according to the location of a left mandibular third molar tooth. (e) Simulated radiation dose distribution in axial view and (f) sagittal view for impacted mandibular third molar, presented as a relative color heatmap.
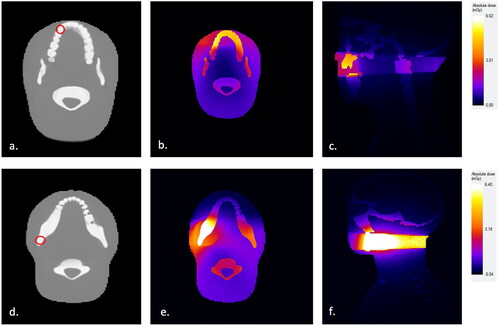
Table 3. Results of sensitivity analysis simulation with variable positioning of minimum FOV.