
Figures & data
Figure 1. Problem setting: Fictional, bi-temporal dataset shown in arbitrary data classification; change event is based on comparison of value difference Δx between epochs and for each region with pre-defined threshold – leading to four exemplary cases of confusion matrix on the right (e.g. upper case reads: although threshold is exceeded, no change is shown in visualization = = false negative).
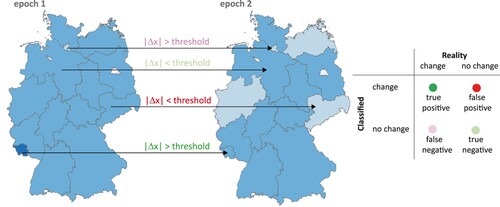
Figure 2. Variants of the assignment of class differences Δc depending on value differences Δx. ΔxMIN and ΔxMAX are the extreme value changes within dataset; the other thresholds are determined based on variants as described in the text.
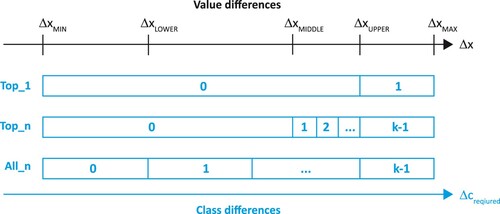
Figure 3. Comparison of weights for measures BMOC and MORC (according to Goldsberry and Battersby, Citation2009) and for measure POCC (including weights w – see text below).
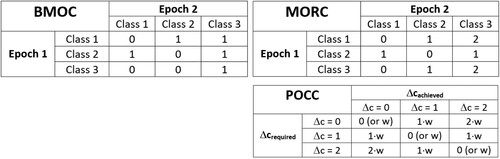
Figure 4. Sweep line diagram for given dataset: line segments below number line (representing values x) show placement and length of all value intervals |Δx|. This arbitrary example for variant ‘All_n’ requires class differences Δc (shown on right hand side) for ΔxUPPER = 60 and ΔxLOWER = 20.
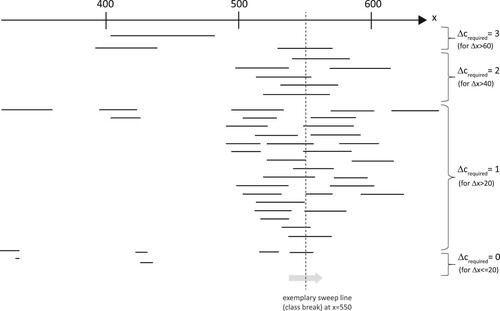
Figure 5. Example dataset on monthly COVID-19 incidences – four epochs, equidistant classification with four classes (data source: https://www.rki.de/DE/Content/InfAZ/N/Neuartiges_Coronavirus/Daten/Inzidenz-Tabellen.html).
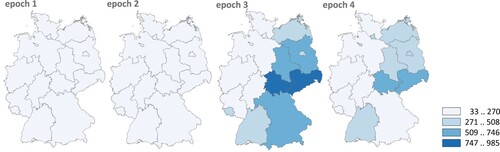
Figure 6. POCC classification for variant ‘Top_1’ (four epochs, four classes), point symbols describe correctness of change relative to previous epoch.
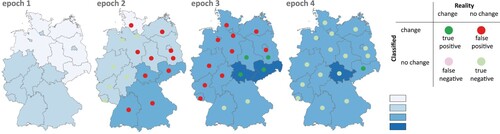
Figure 7. POCC classification for variant ‘Top_n’.
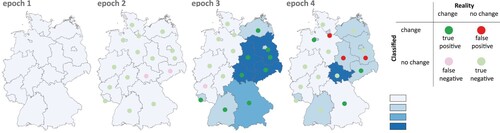
Figure 8. POCC classification for variant ‘All-n’ (no weighting for no-class changes).
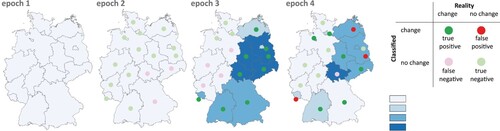
Figure 9. POCC classification for variant ‘All-n’ (with weighting for no-class changes).
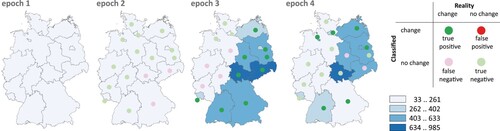
Table 1. Results of variant ‘Top_1’ ().
Table 4. Results of variant ‘All_n’ (with weighting for no-class changes).
Table 2. Results of variant “Top_n” ().
Table 3. Results of variant ‘All_n’ (no weighting for no-class changes).
Data Availability Statement
Data used in the experiments were extracted from https://www.rki.de/DE/Content/InfAZ/N/Neuartiges_Coronavirus/Daten/Inzidenz-Tabellen.html