
Figures & data
Table 1. Summary of studies addressing cognitive and behavioral functioning of individuals with CHARGE adapted from the review by Thomas et al. [Citation10].
Table 2. Selected demographic, sensory, and developmental information of the participants (N = 35).
Table 3. Categories of accommodations according to the review by Sireci and O’Riordan [Citation68] transferred to the present study to evaluate the comparability of scores obtained from test-items before and after any accommodations.
Figure 1. Distribution of the participants’ performance-based assessment after excluding the 5 who needed modified test conditions (n = 30). Despite skewing to the right, the distribution was considered normal according to the tests of normality. The distribution indicated a bimodality, marked by the blue arrow above.
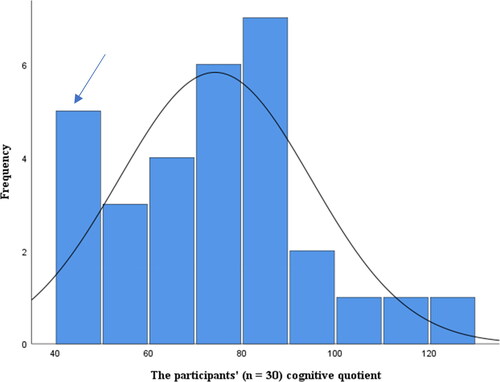
Figure 2. Distribution of the parental reports on Vineland adaptive ability Scale of the participants’ overall adaptive behavior abilities (GAI). The distribution was based on 22 reports. Twelve participants were eliminated because of their age, and 5 participants were already excluded to avoid compromising the validity of the data set. According to the tests of normality the data set appeared normally distributed.
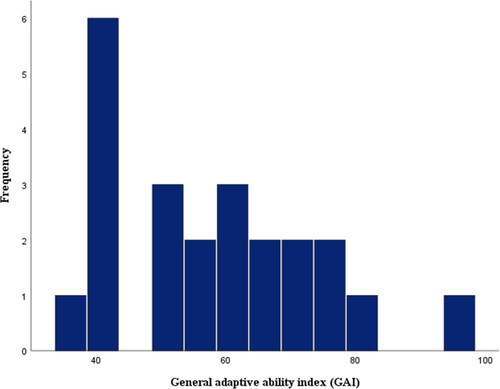
Figure 3. Distribution of the preschoolers’ CQ scores after their performances on either WPPSI (n = 4) or Bayley-III (n = 1). Four preschoolers out of 5 was assessed with WPPSI-IV. One child was assessed with Bayley-III because of the young age. Bayley-III is not an intelligence scale, like the Wechsler scales, but gives information about whether a child’s developmental trajectory is proceeding as expected, relative to same-age peers. This may be part of the reason for the differences in performances, as illustrated by the two blue bars.
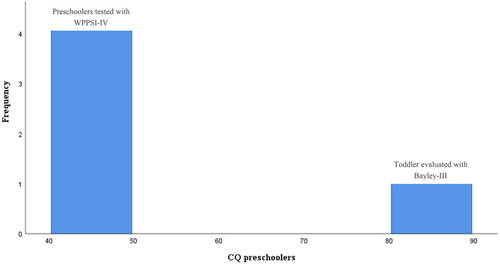
Figure 4. Distribution of the participants’ CQ scores after excluding the preschoolers’ performances due to the indicated bimodality. Tests of normality appeared satisfactory also after the exclusion (n = 25).
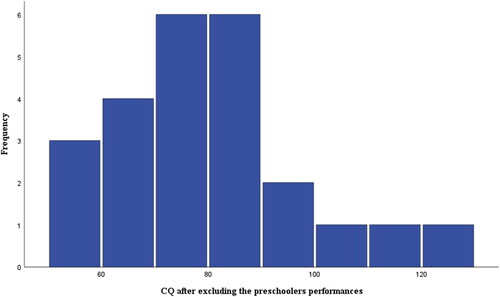
Table 4. Explorative bifactor analysis of the participants’ performances on WISC-V.
Table 5. Factor analysis of the performances on WISC-V with 5 fixed factors.
Table 6. Explorative bifactor analysis of the performances on WAIS-IV.
Table 7. Factor analysis of the performances on WAIS-IV with 4 fixed factors.